


Abstract
Evolution of gene expression mediated by cis-regulatory changes is thought to be an important contributor to organismal adaptation, but identifying adaptive cis-regulatory changes is challenging due to the difficulty in knowing the expectation under no positive selection. A new approach for detecting positive selection on transcription factor binding sites (TFBSs) was recently developed, thanks to the application of machine learning in predicting transcription factor (TF) binding affinities of DNA sequences. Given a TFBS sequence from a focal species and the corresponding inferred ancestral sequence that differs from the former at n sites, one can predict the TF-binding affinities of many n-step mutational neighbors of the ancestral sequence and obtain a null distribution of the derived binding affinity, which allows testing whether the binding affinity of the real derived sequence deviates significantly from the null distribution. Applying this test genomically to all experimentally identified binding sites of 3 TFs in humans, a recent study reported positive selection for elevated binding affinities of TFBSs. Here, we show that this genomic test suffers from an ascertainment bias because, even in the absence of positive selection for strengthened binding, the binding affinities of known human TFBSs are more likely to have increased than decreased in evolution. We demonstrate by computer simulation that this bias inflates the false positive rate of the selection test. We propose several methods to mitigate the ascertainment bias and show that almost all previously reported positive selection signals disappear when these methods are applied.
Introduction
Organism-level phenotypic changes in adaptive evolution are believed to be often caused by gene expression alterations brought by changes in cis-regulatory sequences (King and Wilson 1975; Wray 2007; Carroll 2008; Jones et al. 2012; Signor and Nuzhdin 2018). However, it is challenging to test positive selection on cis-regulatory sequences because the neutral expectation is difficult to know, unlike the test of positive selection on protein-coding sequences where the neutral expectation is usually assumed to be reflected by synonymous substitutions (Li et al. 1985; Nei and Gojobori 1986; McDonald and Kreitman 1991; Nei and Kumar 2000). While one can test positive selection on the cis-regulatory sequence of a gene by comparing it with the synonymous sites in the gene (Andolfatto 2005), the comparison would rely on the assumption that the regions being compared have equal mutation rates. The nonneutrality of many synonymous mutations (Lind et al. 2010; Lawrie et al. 2013; Sharon et al. 2018; She and Jarosz 2018; Shen et al. 2022) further complicates the test. Comparing the cis-regulatory sequence of a gene with the intron sequences of the gene is another choice (Haygood et al. 2007), but it similarly depends on the assumption that the regions being compared have equal mutation rates and that introns evolve neutrally. Additionally, because the number of functional sites in a cis-regulatory sequence is usually small, the above comparisons are generally statistically underpowered.
Because functional changes of cis-regulatory sequences typically occur via altering their bindings to trans-regulatory factors such as transcription factors (TFs), selection on cis-regulatory sequences is in a large part mediated by selection on binding affinities (Berg et al. 2004; Moses 2009). In theory, one can compare an observed evolutionary change in binding affinity with a null distribution in the absence of selection to test whether the cis-regulatory sequence has been positively selected. Such a test is possible only if the binding affinities of numerous potential mutant sequences, which would be labor-intensive to quantify experimentally, are known. This problem was recently solved by using machine learning to predict TF-binding affinities (Liu and Robinson-Rechavi 2020). Specifically, based on previously established techniques (Ghandi et al. 2014; Lee et al. 2015; Ghandi et al. 2016), Liu and Robinson-Rechavi trained a gapped k-mer support vector machine (gkm-SVM) using TF-binding sites (TFBSs) experimentally identified through chromatin immunoprecipitation followed by sequencing (ChIP-seq). This trained program is then used to calculate SVM weights (i.e. contribution to the overall binding affinity) of all possible 10-mers, based on which a binding affinity score (SVM score) can be calculated for an arbitrary sequence by summing up SVM weights of all 10-mers that it contains.
With the above tool, one can predict the binding affinities of many mutational neighbors of an ancestral regulatory sequence to obtain a null distribution of binding affinity changes and compare the observed evolutionary change (deltaSVM) with this null distribution. If the observed deltaSVM is in the right 5% or 1% tail of the null distribution, one could conclude that positive selection for a higher binding affinity to the TF of interest acted in the evolution of the regulatory sequence (Prabhakar et al. 2006; Gittelman et al. 2015). For example, based on this method, Liu and Robinson-Rechavi (2020) reported positive selection for elevated binding affinities in human evolution since the human–chimpanzee split for a few percent of the binding sites of each of 3 TFs examined: CEBPA, HNF4A, and CTCF.
In such tests of positive selection, the TFBSs considered are typically acquired from ChIP-seq peaks (Park 2009) identified in a focal species such as the human in the above study. This means that only TFBSs with relatively high binding affinities are included in the analysis, which could cause an ascertainment bias because binding affinities are more likely to have increased for TFBSs with relatively high affinities than for TFBSs with relatively low affinities even in the absence of positive selection for higher affinities (Fig. 1). As a result, one may miscall chance increases of binding affinities as signals of positive selection, raising the false positive rate in the test of positive selection. An analogy of this problem is to test whether students generally perform better in the final exam than in the midterm exam while considering only those who perform well in the final exam.
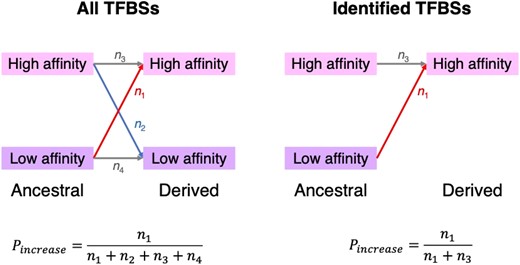
Schematic illustration of the ascertainment bias in the selection test of Liu and Robinson-Rechavi (2020). The left panel represents the scenario where all potential TFBSs in an ancestor are included in the test so there is no ascertainment bias, whereas the right panel represents the scenario in the actual test of Liu and Robinson-Rechavi where there is an ascertainment bias. Here, , , , and denote the number of potential TFBSs that underwent each type of binding affinity change, respectively. denotes the observed proportion of TFBSs with increased binding affinities and is unbiasedly estimated in the left panel. In the right panel, however, is overestimated because TFBSs with low-derived affinities (in the focal species) are not included.
In this study, we use computer simulation of neutral evolution to demonstrate the influence of the ascertainment bias on the test of positive selection on TFBSs. We propose 2 methods to mitigate this impact and show that almost all signals of positive selection previously reported for the binding sites of the 3 human TFs (Liu and Robinson-Rechavi 2020) disappear upon ascertainment bias mitigations.
Results
Interpretation of P-values in the Selection Test
For each TFBS subject to Liu and Robinson-Rechavi's one-tailed test of positive selection for elevated binding affinity, the P-value is the probability that deltaSVM under neutrality (denoted for short) is greater than the observed value (), given the ancestral sequence and the number of nucleotide substitutions separating the ancestral and derived sequences (note that Liu and Robinson-Rechavi required this number to be at least 2). That is, . However, for a TFBS from a real dataset, the probability that it shows under neutrality is the conditional probability , where I denotes the event that the TFBS is included in the dataset. That is, the P-value is conditioned not only on the ancestral state but also implicitly on the derived state as long as is dependent on the derived state. Because TFBSs with higher should have higher but lower , events I and are not mutually independent but tend to avoid each other. That is, . Thus, . This inequation shows that P will be underestimated if P′ is interpreted as P. Under neutrality, if the probability for P < 0.01 is 0.01, the probability for P’ < 0.01 must be greater than 0.01, inflating the false positive rate in the test of positive selection. If the test is unbiased, the action of positive selection can be inferred when the proportion of TFBSs showing P < 0.01 is greater than 1%. However, this inference is no longer valid if P′ instead of P is calculated because the fraction of TFBSs showing P′ < 0.01 under neutrality is expected to exceed 0.01. Therefore, the ascertainment bias is a problem both in assessing positive selection on an individual TFBS and for a dataset containing many TFBSs.
False Positive Rates Under Various Levels of the Ascertainment Bias
We performed a computer simulation to evaluate the impact of the ascertainment bias on the false positive rate. We first generated 50,000 10-nucleotide random sequences as ancestral TFBS sequences. While TFBSs in ChIP-seq data are much longer than 10 nucleotides, actual TF-binding sequences are around 10 nucleotides. Hence, our simulation is biologically relevant. In each sequence, we then introduced 2 random substitutions at 2 randomly picked sites to generate the corresponding derived sequence. We treated these sequences as potential binding sites of human CEBPA studied by Liu and Robinson-Rechavi. To mimic the ascertainment bias, we removed 10%, 20%, …, 90% of the simulated TFBSs with the lowest derived SVM scores, obtaining 9 datasets with increasing ascertainment biases. We then performed a one-tailed test of positive selection for an elevated CEBPA binding affinity for each TFBS. Following Liu and Robinson-Rechavi, we called a case statistically significant when the right-tail probability is below 0.01 (see Materials and Methods). Because all substitutions introduced are random, all cases of positive selection identified are false positives. Indeed, each of the 9 datasets with ascertainment biases showed a significantly higher false positive rate than that of the original dataset without the ascertainment bias (, two-sample Z-test for proportions; Table 1) and the false positive rate increased with the proportion of TFBSs removed (Spearman's , ; Table 1). For the most extreme level of ascertainment bias considered, the false positive rate is 11 times the expected level. We repeated the above analysis by treating the sequences as potential binding sites of 2 other human TFs studied by Liu and Robinson-Rechavi (HNF4A and CTCF) and obtained highly similar results (supplementary tables S1 and S2, Supplementary Material online).
All simulated TFBSs for human CEBPA and subsets of the simulated TFBSs with the highest derived SVM scores
| Subset | Number of TFBSs | Number (fraction) of TFBSs with positive deltaSVMs | Number (fraction) of false positives | P-value |
|---|---|---|---|---|
| Complete dataset | 50,000 | 24,908 (49.82%) | 553 (1.106%) | N.A. |
| Top 90% | 45,000 | 24,380 (54.18%) | 553 (1.230%) | |
| Top 80% | 40,000 | 23,281 (58.20%) | 553 (1.383%) | |
| Top 70% | 35,000 | 21,810 (62.31%) | 553 (1.580%) | |
| Top 60% | 30,000 | 20,003 (66.68%) | 553 (1.843%) | |
| Top 50% | 25,000 | 17,748 (70.99%) | 553 (2.212%) | |
| Top 40% | 20,000 | 15,085 (75.43%) | 553 (2.765%) | |
| Top 30% | 15,000 | 12,012 (80.08%) | 553 (3.687%) | |
| Top 20% | 10,000 | 8,464 (84.64%) | 553 (5.530%) | |
| Top 10% | 5,000 | 4,448 (88.96%) | 552 (11.040%) |
P-value in the last column is from a test of the null hypothesis that the false positive rate in a subset equals that in the complete dataset (two-sample Z-test for proportions).
Methods for Mitigating the Ascertainment Bias
With the ascertainment bias, the expected false positive rate under neutrality is unknown for a given dataset. Hence, one cannot directly use the proportion of TFBSs in a dataset that show significant positive selection signals to infer whether positive selection has occurred. Rather, one can infer the occurrence of positive selection on an individual TFBS by calculating the adjusted P-value after correcting for multiple testing, where the number of tests should be the sum of the considered and missing TFBSs. Below we present 2 different methods for estimating the number of missing TFBSs.
The first method regards twice the number of TFBSs with positive deltaSVMs as the total number of tests, because the number of TFBSs with negative deltaSVMs should be similar to that with positive deltaSVMs in the absence of ascertainment bias. This expectation is supported by the observation that almost exactly 50% of all simulated TFBSs have positive deltaSVMs (Table 1, supplementary tables S1 and S2, Supplementary Material online). Similarly, in the mouse data analyzed by Liu and Robinson-Rechavi (2020), which consists of TFBSs identified in the focal lineage and 2 nonfocal lineages, ascertainment bias is expected to be much less severe for the “conserved” subset of TFBSs that are identified from all 3 lineages (see Discussion). Indeed, the fraction of “conserved” TFBSs with positive deltaSVMs is 48.14%, 48.66%, and 48.73% for CEBPA, HNF4A, and FOXA1, respectively. Note that this method likely still undercounts the total number of tests, because it cannot recover TFBSs with low binding affinities in both the ancestral and focal taxa (i.e. in Fig. 1).
The second method regards the number of potential binding sites of a given TF in the genome that have at least 2 nucleotide differences between the ancestral and derived sequences as the number of total tests. If the binding sites for the TF is on average l nucleotides long, there are (L-l + 1) ≈ L total tests, where L >> l is the total number of nucleotides in the genome and is the fraction of TFBSs that have at least 2 nucleotide differences between the ancestral and derived sequences (see Materials and Methods). In the above calculation, potential binding sites are overlapping. However, to be more conservative in computing the total number of tests, we may require the potential binding sites to be nonoverlapping, which yields an estimate of L /l potential binding sites in the genome.
Most Positive Selection Signals Disappear Upon Ascertainment Bias Mitigations
As mentioned, Liu and Robinson-Rechavi (2020) reported the detection of positive selection on the binding sites of each of 3 human TFs investigated, because >1% of the TFBSs fall in the right 1% tail of the null distribution of deltaSVM. The TFBSs examined were all identified from human ChIP-seq data, so the test suffered from ascertainment biases. Below we use the 2 methods proposed in the preceding section to mitigate the ascertainment bias and reevaluate the evidence for positive selection by estimating adjusted P-values. If we use the cutoff of adjusted P-value = 1%, there are no positively selected binding sites for any of the 3 TFs when the ascertainment bias is uncorrected or corrected by either method (Table 2). If we use the cutoff of adjusted P-value = 5%, 109 CEBPA binding sites show significant positive selection signals when the ascertainment bias is uncorrected. This number reduces to 87 and 0 under the 2 methods of correction, respectively (Table 2). Binding sites of the other 2 human TFs show even weaker signals of positive selection. No HNF4A binding sites have adjusted P < 0.05 even when the ascertainment is not corrected (Table 2). A total of 161 CTCF binding sites have adjusted P < 0.05 when the ascertainment bias is uncorrected, but this number reduces to 0 when method 1 or 2 is used to correct the ascertainment bias (Table 2).
Number and fraction of positively selected human TFBSs after correction for multiple testing
| Multiple testing correctiona | Transcription factor | |||
|---|---|---|---|---|
| CEBPA (n = 5,807) | HNF4A (n = 12,734) | CTCF (n = 80,074) | ||
| Adjusted P < 0.01 | No correction | 436 (7.51%) | 612 (4.81%) | 2,821 (3.52%) |
| Method 0 | 0 (0%) | 0 (0%) | 0 (0%) | |
| Method 1 | 0 (0%) | 0 (0%) | 0 (0%) | |
| Method 2 | 0 (0%) | 0 (0%) | 0 (0%) | |
| Adjusted P < 0.05 | No correction | 1,135 (19.55%) | 1,922 (15.09%) | 9,132 (11.40%) |
| Method 0 | 109 (1.88%) | 0 (0%) | 161 (0.20%) | |
| Method 1 | 87 (1.50%) | 0 (0%) | 0 (0%) | |
| Method 2 | 0 (0%) | 0 (0%) | 0 (0%) | |
aThe total number of tests considered in the multiple testing correction is the observed number of TFBSs in the dataset (method 0), twice the number of observed TFBSs with positive deltaSVMs (method 1), or an estimate of the number of potential binding sites in the genome (method 2), respectively. Results for “no correction” is based on P-values reported by Liu and Robinson-Rechavi (2020).
Discussion
We showed that a previously proposed genomic test for positive selection for increased binding affinities of TFBSs suffers from inflated false positive errors due to an ascertainment bias. Because this bias is inevitable when real data are used, without an appropriate correction, the test would be unable to identify positively selected TFBSs accurately. After applying corrections as well as performing additional analyses, we found no evidence for positive selection on the binding sites of human HNF4A and CTCF and no to weak signals of positive selection on the binding sites of human CEBPA.
Using simulated data, we demonstrated that the false positive rate increases with the severity of the ascertainment bias, which is mimicked by removing from the dataset a subset of TFBSs with the lowest derived SVM scores. However, it is unclear whether the above approach accurately recapitulates the ascertainment bias that real data are subject to, because the exact relationship between the binding affinity of a TFBS and its probability of inclusion in the dataset is unknown. In addition, it is challenging to predict the overall binding affinity of a relatively long (i.e. >>10 bp) DNA segment. While deltaSVM, which is the sum of differences in SVM scores of all 10-mers encompassing the mutated sites, is sufficient for quantifying the effect of mutations, the summed SVM score for a long DNA segment is unlikely to be a good measure of the binding affinity of the segment because not all 10-mers in the segment contribute equally to TF binding and ChIP-seq detectability. As a result, it is difficult to estimate accurately the impact of the ascertainment bias on the selection test in real data analysis, and future studies are needed to address this problem. Indeed, when we examined a simulated dataset consisting of shuffled TFBS sequences detected by ChIP-seq (i.e. nucleotide sites in a real TFBS sequence are randomly reordered; see Materials and Methods), we found the distribution of the summed SVM score largely overlapping between the shuffled and unshuffled sequences (supplementary fig. S1, Supplementary Material online), indicating that the summed SVM score is not a reliable measure of the overall binding affinity of a TFBS and that removing TFBSs with the smallest summed SVM scores is unlikely to accurately emulate the ascertainment bias in actual data analysis. Notwithstanding, a positive correlation between the fraction of TFBSs removed and the false positive rate is still observed in this dataset (Spearman's , ; supplementary table S3, Supplementary Material online).
We considered 2 different methods to recover the missing TFBSs caused by the ascertainment bias. While method 1 probably recovers TFBSs that have detectable binding affinities in the ancestral node but not in the focal species (i.e. n2 in Fig. 1), it does not recover TFBSs that lack detectable binding in both species (i.e. n4 in Fig. 1). Hence, method 1 likely provides insufficient corrections. This said, if there are already no significant positive selection signals after the application of method 1, more stringent corrections would not be needed. However, if there are positive selection signals after the application of method 1, the identified TFBSs should be further tested by applying more rigorous corrections or be treated as candidates for further tests such as an experimental verification of fitness effects or a population genetic test of selective sweeps.
The second correction method (method 2) considers the number of potential TFBSs in the whole genome. In theory, this method provides the most complete correction. However, estimating the total number of potential TFBSs (i.e. number of sequence segments that can potentially become TFBSs in evolution) can be challenging. In this study, we assumed that all genomic regions can potentially become a TFBS. This assumption is reasonable at least qualitatively, because “leaky expression” caused by fortuitous TF binding is indeed widespread, as evidenced by the observation that over three quarters of the human genome is transcribed (Kellis et al. 2014) and that about one half of 120-nucleotide random sequences can drive gene expression in yeast (Xu et al. 2023). However, if different genomic regions have different potentials to evolve into a TFBS in the focal lineage, method 2 could overcorrect the ascertainment bias when regions with low potentials are counted. This said, if such heterogeneities can be modeled, method 2 should provide an appropriate correction of the ascertainment bias.
It should be noted that, because the P-value of the selection test is calculated based on a finite number of simulated mutants, the test inevitably loses power when multiple testing is corrected. For instance, Liu and Robinson-Rechavi (2020) considered 104 simulated mutants per test, so the smallest possible P-value was 10−4, yet the number of TFBSs in the dataset can be very large (e.g. on the order of 104 for HNF4A and CTCF; Table 2). While possible, the missing TFBSs are unlikely to be true targets of selection for stronger binding given their lack of detectable binding. Hence, the probability is low for missing TFBSs to have small P-values (i.e. below 0.05 or 0.01) if they are included in the test. But, when this is the case, multiple testing corrections could make the test overly conservative.
Our reanalysis showed no to weak signals of positive selection on the TFBSs of CEBPA (Table 2). This result appears consistent with the validation tests Liu and Robinson-Rechavi (2020) performed. Specifically, one of their validations, inspired by the McDonald–Kreitman test (McDonald and Kreitman 1991), compares the ratio of the number of substitutions to the number of polymorphisms between TFBSs detected to be under positive selection and the other TFBSs in the dataset. This test alone, however, is not a sufficient means of validation, because many binding sites not under positive selection are likely subject to negative selection because of stabilizing selection on their binding affinities, and negative selection can reduce the divergence-to-polymorphism ratio (Eyre-Walker 2002). Liu and Robinson-Rechavi further showed that the target genes of the positively selected TFBSs tend to have lowered expression variance across human populations, suggesting that the binding affinities of TFBSs not under positive selection are not generally under stronger stabilizing selection than TFBSs under positive selection. The 2 validation tests, together with our reanalysis, suggest the possibility of positive selection on some CEBPA binding sites in the human lineage. Liu and Robinson-Rechavi (2020) reported relatively high fractions of positively selected CTCF binding sites in human brain tissues relative to other tissues, but no statistic test for this comparison was performed. We note that, because no CTCF binding site has an adjusted P-value smaller than 0.05 under either method 1 or method 2 in the test of positive selection, the proportion of positively selected binding sites is zero in every tissue and thereby is not higher in brain tissues than in other tissues.
In addition to human TFBSs, Liu and Robinson-Rechavi also analyzed TFBSs in mice and fruit flies. These 2 datasets do not suffer from the ascertainment bias as severely as do the human datasets, because TFBSs detected in focal and nonfocal species (or lineages) are all included in the mouse and fly analyses. However, these datasets are not completely free of the ascertainment bias because only TFBSs with sufficiently strong binding in at least one species can be included, whereas proto-TFBSs that have low binding in all species considered (and presumably in their most recent common ancestor too) cannot. That is, the low-to-low class (n4) in Fig. 1 are still missing, and the number of TFBSs in the dataset is still smaller than the size of the ideal “complete” dataset. As a result, selection tests have inflated false positive errors. For example, the fraction of TFBSs with increased binding should be but is instead computed by (see Fig. 1). Because n4 is presumably the largest among the four n values, the above 2 fractions are very different. This problem can be mitigated to some extent by broader phylogenetic sampling, though ancestral sequence reconstruction would be subject to more errors when more divergent species are included. Another problem in analyses involving divergent species is that there could be divergence in the TF's binding preference. If this is the case, and only binding to a focal species’ TF is considered, there could be a spurious excess of increase in binding affinity.
It is worth noting that predictive sequence patterns learned by gkm-SVM can potentially be interpreted by different means (Shrikumar et al. 2019). Both Liu and Robinson-Rechavi (2020) and the present study used deltaSVM to quantify the effect of substitutions on binding affinity when testing selection on TFBSs. Although deltaSVM has potential pitfalls, the selection test is unlikely to be sensitive to the interpretation method because the test is nonparametric. Even if a different interpretation method is used in the test, the ascertainment bias is still expected as long as the TFBSs tested for positive selection come from experiments that detect TF binding.
We conclude that the previously proposed genomic test is unable to rigorously estimate the prevalence of positive selection on TFBSs due to an ascertainment bias. There are multiple ways to mitigate the bias, but it remains challenging to adequately correct but not overcorrect the bias. We suggest that it is necessary to combine multiple methods to verify the signal of positive selection on TFBSs, including broader phylogenetic sampling, correction for ascertainment bias, correction for multiple testing, and other means to test selection, to robustly estimate the prevalence of positive selection on TFBSs and identify individual TFBSs where nucleotide substitutions have been driven by positive selection.
Finally, it is worth pointing out that the type of ascertainment bias encountered here is not unique to the test of positive selection on TFBSs, especially at the postgenomic era. Evolutionary analyses of subsets of genomic data that satisfy certain criteria are potentially subject to ascertainment biases when the criteria are correlated with the factors being investigated. A prime example is the test of Ohno's hypothesis of X-chromosome dosage compensation in mammals (i.e. doubling of the expressions of X-linked genes to compensate the degeneration of their Y-linked counterparts) (Ohno 1967), where considering only genes with expression levels higher than a cutoff produced misleading results (He et al. 2011; Lin et al. 2012). Caution should be exerted in designing such tests.
Materials and Methods
Analysis of Simulated TFBSs
To generate a dataset that represents potential TFBSs, we randomly generated 50,000 distinct 10-nucleotide sequences with equal probabilities of the 4 nucleotides at each site. In each sequence, we randomly picked 2 sites and make a random change at each site such that the derived sequence differs from the original, ancestral sequence by 2 substitutions (with no multiple hits and no mutational bias).
Following Liu and Robinson-Rechavi (2020), for each pair of ancestral and derived TFBSs, we performed a one-tailed test of positive selection for an increased binding affinity of the derived TFBS. We separately considered 3 human TFs: CEBPA, HNF4A, and CTCF. Binding affinities (SVM weights) of 10-mers were acquired from https://github.com/ljljolinq1010/A-robust-method-for-detecting-positive-selection-on-regulatory-sequences/blob/master/data/human_SVM_model/CEBPA/kmer_10_library_weigths.txt, https://github.com/ljljolinq1010/A-robust-method-for-detecting-positive-selection-on-regulatory-sequences/blob/master/data/human_SVM_model/HNF4A/kmer_10_library_weigths.txt, and https://github.com/ljljolinq1010/A-robust-method-for-detecting-positive-selection-on-regulatory-sequences/blob/master/data/human_CTCF_adaptation/human_SVM_model/all_merged_ctcf_kmer_10_library_weigths.txt for CEBPA, HNF4A, and CTCF, respectively. CEBPA and HNF4A are both liver-specific TFs; CTCF is expressed in multiple tissues and the binding sites studied are the union of the binding sites identified from multiple individual tissues (Liu and Robinson-Rechavi 2020). For each ancestral TFBS, we generated 1,000 random mutants as the control set. Each mutant was a 2-step neighbor of the ancestral sequence and was generated as in the generation of the derived sequences. We simulated only 1,000 random mutants as the control set for each TFBS because the total number of 2-step neighbors of a 10-mer is only . Positive selection is inferred for a TFBS if fewer than 10 sequences in the control set has higher SVM scores than that of the derived sequence (i.e. ). Because the simulated TFBSs were subject to no selection, all positive cases identified in this analysis were false positives.
To mimic the ascertainment bias, we ranked the simulated TFBSs based on the SVM score of the derived sequence and removed the bottom 10%, 20%, … 90% of TFBSs, respectively, obtaining 9 subsets subject to increasing ascertainment biases. We then counted the number of TFBSs that showed in the selection test in each subset to investigate the relationship between the severity of the ascertainment bias and the false positive rate.
Analysis of Shuffled TFBS Sequences
For each human CEBPA binding site identified from ChIP-seq, we randomly reordered its nucleotide sites to obtain a sequence that matches the real sequence's length and nucleotide composition. The same reordering was also applied to the corresponding ancestral sequence, such that the specific types of nucleotide substitutions in the real sequences are also preserved. For each sequence, the total SVM score for CEBPA binding was calculated by adding up the SVM scores of all 10-mers in the human sequence. Ascertainment bias was generated by removing shuffled sequences with the smallest derived total SVM. For the selection test, 2,000 random mutants were generated for each TFBS as the control set. Although Liu and Robinson-Rechavi generated 10,000 mutants when performing the test, using a smaller number of mutants should not increase the number of positive test results. Because there are no true positives in the simulated data and because it is the overall false positive rate that is of interest, a smaller control set should not affect the conclusion.
Reanalysis of Human TFBSs
We examined the binding sites of human CEBPA, HNF4A, and CTCF, respectively. These TFBSs were previously studied by Liu and Robinson-Rechavi (2020), who used human (Homo sapiens) as the focal species and used human, chimpanzee (Pan troglodytes), and gorilla (Gorilla gorilla) to infer the sequence of the human–chimpanzee common ancestor. Data files analyzed here were made available by Liu and Robinson-Rechavi at https://github.com/ljljolinq1010/A-robust-method-for-detecting-positive-selection-on-regulatory-sequences/tree/master/data/human_deltaSVM (CEBPA and HNF4A binding sites) and https://github.com/ljljolinq1010/A-robust-method-for-detecting-positive-selection-on-regulatory-sequences/blob/master/data/human_CTCF_adaptation/human_deltaSVM/ctcf_deltaSVM_highertailTest.txt (CTCF binding sites).
We performed multiple testing corrections following the Benjamini–Hochberg procedure (Benjamini and Hochberg 1995) and computed adjusted P-values from P-values of the right-tail test in Liu and Robinson-Rechavi (2020). For the TFBS with the ith smallest P-value in a given dataset, the adjusted P-value is , where is the P-value reported by Liu and Robinson-Rechavi (2020) and M is the total number of tests to correct for. When multiple TFBSs have equal P-values, the greatest rank number is used; for example, if there are k () TFBSs with the same P-value and there are TFBSs with P-values that are smaller than these k TFBSs, the k TFBSs all have the rank number of . We applied 3 methods to calculate Padjust, which we refer to as methods 0, 1, and 2, respectively. In method 0, M is simply the number of TFBSs in the dataset. In method 1, M equals twice the number of TFBSs with positive deltaSVMs in the dataset. In method 2, , where L is the genome size, l is the mean length of TFBS sequences in the dataset, and is the probability that there are at least 2 substitutions between the ancestral TFBS and its derived version. L was set to be nucleotides, which is a rough estimate of human's haploid genome size multiplied by 2 because a TFBS can be on either the Watson or Crick strand and l was computed from the empirical data to equal 269, 340, and 537 nucleotides for CEBPA, HNF4A, and CTCF, respectively. was calculated as the ratio of the number of TFBSs used in the selection test (first row of Table 2) and the total number of TFBSs identified by ChIP-seq (16,212 for CEBPA, 27,782 for HNF4A, and 118,970 for CTCF).
We assume that the ranks of P-values of TFBSs with P < 0.01 or P < 0.05 do not change upon the inclusion of missing TFBSs, because the missing TFBSs have low binding affinities and are unlikely to be true positives in the selection test.
All simulations and analyses were conducted in an R environment (R Core Development Team 2010).
Supplementary Material
Supplementary material is available at Molecular Biology and Evolution online.
Acknowledgments
We thank Dr. Jialin Liu for his generous help during this study and S. Song, H. Xu, and 2 anonymous reviewers for their valuable comments.
Funding
This work was supported by the research grant R35GM139484 from the U.S. National Institutes of Health to J.Z. D.J. was supported by the Rackham Predoctoral Fellowship from the University of Michigan when performing this study.
Data Availability
Data needed to replicate the work are provided in the paper, supplementary materials, and GitHub (https://github.com/RexJiangEvoBio/TFBS).
