


Abstract
The Y chromosome is theorized to facilitate evolution of sexual dimorphism by accumulating sexually antagonistic loci, but empirical support is scarce. Due to the lack of recombination, Y chromosomes are prone to degenerative processes, which poses a constraint on their adaptive potential. Yet, in the seed beetle, Callosobruchus maculatus segregating Y linked variation affects male body size and thereby sexual size dimorphism (SSD). Here, we assemble C. maculatus sex chromosome sequences and identify molecular differences associated with Y-linked SSD variation. The assembled Y chromosome is largely euchromatic and contains over 400 genes, many of which are ampliconic with a mixed autosomal and X chromosome ancestry. Functional annotation suggests that the Y chromosome plays important roles in males beyond primary reproductive functions. Crucially, we find that, besides an autosomal copy of the gene target of rapamycin (TOR), males carry an additional TOR copy on the Y chromosome. TOR is a conserved regulator of growth across taxa, and our results suggest that a Y-linked TOR provides a male specific opportunity to alter body size. A comparison of Y haplotypes associated with male size difference uncovers a copy number variation for TOR, where the haplotype associated with decreased male size, and thereby increased sexual dimorphism, has two additional TOR copies. This suggests that sexual conflict over growth has been mitigated by autosome to Y translocation of TOR followed by gene duplications. Our results reveal that despite of suppressed recombination, the Y chromosome can harbor adaptive potential as a male-limited supergene.
Introduction
Driven by differences in reproductive strategies (Parker 2006; Schärer et al. 2012), males and females commonly experience sexually antagonistic selection on traits present in both sexes, for example (Andersson 1994; Arnqvist and Rowe 2005). When the sexes share genetic variation in homologous traits (Lande 1980), an allele beneficial to females may be deleterious for males and vice versa. This genetic dependency can hinder sex-specific adaptations, causing intralocus sexual conflict (Bonduriansky and Chenoweth 2009). The Y chromosome is limited to males, and linkage of sexually antagonistic loci on the Y would represent a straightforward solution to this genetic conflict (Charlesworth and Charlesworth 1980; Rice 1984; Charlesworth 2002; Mank 2012). A male limited pathway to alter the expression of a sexually antagonistic trait disconnects the genetic basis between the sexes and can reduce gender load by enabling not only males but also females to reach their fitness optima. Yet, the role of Y chromosomes in the evolution of sexual dimorphism has historically been neglected (Mank 2012). This is because the Y typically degenerates quickly after the loss of recombination with the X, which is expected to constrain its adaptive potential (Bachtrog 2013).
The Y chromosome degenerates due to reduced efficacy of selection and mutation accumulation (reviewed in Charlesworth and Charlesworth 2000), selective haploidization driven by regulatory evolution (Lenormand et al. 2020), or a combination thereof. As a consequence of degeneration, Y chromosomes are often heteromorphic, void of genes, and rich in repetitive elements. Y chromosome sequences are therefore challenging to assemble, and Y assemblies considered as complete are available only in a handful of mammalian species (Skaletsky et al. 2003; Hughes et al. 2010; Hughes et al. 2012; Hughes et al. 2020). There are also a few examples of near complete assemblies such as for malaria mosquitos (Hall et al. 2016), some fish (Peichel et al. 2020; Sandkam et al. 2021) and neo-Y in Drosophila miranda (Mahajan et al. 2018), and the affordability of high quality long read sequencing is expected to extend this list at a swift pace. Genes remaining on degenerate Y chromosomes are frequently translocated from the autosomes, allowing their male specialization. Y linked genes show typically testis specific expression, for example (Skaletsky et al. 2003; Hughes et al. 2012; Soh et al. 2014; Peichel et al. 2020), which suggests they are associated with male primary reproductive functions. But recently, heteromorphic Y chromosomes have also been shown to affect sexually dimorphic, nonreproductive traits in humans (Prokop and Deschepper 2015), drosophila (Nielsen et al. 2023), fish (Lampert et al. 2010; Sandkam et al. 2021; Singh et al. 2023), and seed beetles (Kaufmann et al. 2021), suggesting a wider role in nonsexual traits than previously appreciated (Cīrulis et al. 2022).
The order of Coleoptera (beetles) is the most species rich group of animals on the earth. Yet, only a handful of beetle species have been sequenced thus far (McKenna et al. 2019), and their Y chromosomes remain largely uncharted. Coleoptera has XY sex determination, but the sex determining genes involved are largely unknown. A study of karyotypes of over 4,000 beetle species shows occasional loss of Y chromosomes (Blackmon and Demuth 2014), suggesting that Y is not essential for sex determination (Blackmon et al. 2017). Interestingly, most studied species in the largest Coleopteran suborder Polyphaga do not have an obligate XY chiasmata formation and therefore lack a pseudo autosomal region (PAR) and XY recombination altogether (Blackmon and Demuth 2014). One such species is a seed beetle Callosobruchus maculatus that harbors a dot-like heteromorphic Y chromosome estimated to represent <2% of the genome (Sayadi et al. 2019). Based on cytogenetic data, the C. maculatus Y is euchromatic despite its small size (Angus et al. 2010).
We recently discovered segregating Y-linked genetic variance for male body size (Kaufmann et al. 2021). Female and male C. maculatus have different fitness optima for body size (Berg and Maklakov 2012; Berger et al. 2014a; Berger et al. 2016), which is closely connected to many other life history traits (Arnqvist et al. 2022). A combination of quantitative genetic analysis, artificial selection, and isolating the effect of Y linked genetic variance by introgressing the putative Y haplotypes onto a common genetic background revealed two phenotypically distinct male morphs associated with different Y haplotypes (YL and YS for large and small size, respectively). We demonstrated that selection on males can deplete Y haplotype variation quickly (Kaufmann et al. 2023) and that carrying either one of the Y haplotype alters the male size (weight), and consequently the level sexual size dimorphism, by 30% (Kaufmann et al. 2021). Body size is a classic quantitative trait, and although quantitative genetic evidence suggests that even the autosomal genetic architecture of body size in C. maculatus consist of a combination of few major effect loci and many small effect loci (Kaufmann et al. 2023), finding that a substantial part of its architecture in males is controlled by a nonrecombining “supergene” is surprising. But, a Y-linked element has also been implicated in male body size variation in humans (Ellis et al. 2001) and fish (Lampert et al. 2010; Sandkam et al. 2021; Singh et al. 2023) suggesting that Y-linkage may be a common way to mitigate sexual conflict over growth across diverse taxa.
In this study, we assembled previously uncharacterized X and Y chromosome sequences of C. maculatus and identified molecular differences between the two Y haplotypes (YS and YL) associated with small or large male body size and with major effects on sexual size dimorphism, shedding light on the underlying molecular mechanisms. To do this, we took advantage of comparing genomes of the YS and YL introgression lines (Kaufmann et al. 2021) (hereafter referred to as S and L, respectively) that share inbred autosomal and X chromosomes and only differ in their respective Y haplotype. Here, we first identified nonrecombining X and Y contigs in both S and L genomes, by comparing sequence coverage difference between males and females, and verified male specificity of the longest Y contig (8.4Mb) with polymerase chain reaction (PCR). To further confirm the identity of the Y contigs and characterize Y variation, we compared the genomes of S and L lines that share variants in all other chromosomes except on the Y. We identified and functionally characterized protein coding genes and repeat structure of the Y contigs, analyzed the origins of the Y genes as X gametologs or autosomal paralogs, studied gene duplications within the Y to identify putative ampliconic genes, and examined expression of Y-linked genes.
Results
Genome Assembly
First, we separately assembled the genomes of the S and L lines and annotated the slightly more continuous S genome (carrying the ancestrally more frequent YS haplotype), which was subsequently used as the reference genome in this study. Assembly quality assessment using k-mer spectrum showed that only 1.5% of unique k-mers (containing repeats and low coverage reads) could not be assembled, whereas the k-mer completeness of the assembly (i.e., of primary and alternative) is >97%. In accordance, 99.9% of the hi-fi reads mapped back to the assembly with relatively even coverage. The assembled S genome has 938 contigs that yield a total genome length of 1.246 Gb, in close accordance with the genome size estimate of 1.2Gb for this species (Arnqvist et al. 2015). The N50 value of the assembly is 9.45 Mb with the longest contig being 37.4 Mb in length, the L50 is 38, and the BUSCO completeness scores over 98% (insecta_odb10: complete: 98.1% [single copy: 87.6%, double copy: 10.5%], fragmented: 0.2%, missing: 1.7%, n = 1367), demonstrating that the assembly is of a very high quality and further improves the previously published genome for this species (C. maculatus reference genome; N50 of 0.15 Mb and total genome size of 1.01 Gb Sayadi et al. 2019). Five hundred ninety-seven contigs were shorter than 100 kb (consisting of 24.9 Mb length, 2.00% of the total S assembly length) and were not considered in the downstream sex chromosome identification analysis because their chromosome type (autosome, X or Y) could not be determined with confidence due to their short length. The L line assembly is also of high quality with 1,323 contigs and a total length of 1.224 Gb, the longest contig being 30.2 Mb in length, with an N50 of 9.86 Mb, L50 of 38 and a BUSCO completeness score of over 97% (insecta_odb10: complete: 97.8% [single copy: 87.5%, double copy: 10.3%], fragmented: 0.3%, missing: 1.9%, n = 1367). Nine hundred forty-five contigs were shorter than 100 kb (consisting of 41.0 Mb, 3.35% of the total L assembly length).
After repeat-masking, 72.1% of the reference genome was soft-masked, of which 21.1% was identified as retroelements (primarily LINEs: 17.8%) and 21.0% as DNA transposons. A total of 24.8% interspersed repeats remained unclassified. Various low-complexity repeats formed the remainder of the soft-masked content. The final set of annotated gene models include 35,865 genes (68% increase compared with the original assembly Sayadi et al. 2019) and 39,983 transcripts (3,451 two-transcript gene models and 297 with more than two transcripts; 14% increase in the total number of transcripts Sayadi et al. 2019). A total of 25,651 transcripts received functional annotation.
Given our strict laboratory protocol, we did not expect any bacterial contaminations. Upon inspection, we did however find 16S genes from Enterococcus spp. in both L and S samples, and the same strains were present in both. The coverage for these contigs is five to seven times higher than the average coverage for genomic contigs and therefore way above the reference level for the initial detection of candidate sex-linked contigs. Importantly, our identification of Y linked contigs relies on several methods described below and is also guided by RNA-seq data from poly-A selected RNA, thus eliminating a risk of contaminating bacterial reads among the contigs identified as Y linked.
Identification of Y and X Contigs
We performed a coverage comparison analysis (with sex assignment through coverage [SATC] Nursyifa et al. 2022) using Illumina short-read sequencing data from samples of both sexes (Sayadi et al. 2019) to identify novel sex chromosome sequences. SATC correctly identified the sexes of the samples. In the S genome assembly, four Y (total of 10.1 Mb) and eight X contigs (total of 58.6 Mb) were detected based on significant coverage differences, whereas in the slightly more fragmented L genome, we identified five Y contigs (total of 4.89 Mb) and ten X contigs (total of 64.2 Mb) (supplementary tables S1 and S2, Supplementary Material online). Importantly, the identified Y contigs from both assemblies map to each other, demonstrating that SATC identified homologous sequences in both assemblies (supplementary figs. S1 and S2, Supplementary Material online). The same contigs were identified whether using unfiltered data or when using repeat masked contigs, with minor exceptions (see supplementary tables S1 and S2 and figs. S1 and S2, Supplementary Material online). Note that the SATC analysis identified several additional contigs to show significant coverage difference between the sexes (see supplementary table S1, Supplementary Material online); however, the relative coverage difference in these cases was below 10%, and we therefore took a more conservative approach and only considered sex chromosome contigs above this threshold in our downstream analysis. It is possible however that these (or other unidentified) contigs are still sex linked but less diverged between X and Y.
Gene ontology (GO) enrichment of Y linked transcripts, as compared with all identified sex-linked transcripts, shows that Y is functionally different from the X (fig. 1). The significantly enriched processes on the Y include cell proliferation, regulation of development, cell death and apoptosis, response to stress/external stimulus such as response to starvation, immune response, RNA processing and regulation of posttranscriptional gene expression as well as protein modification (ubiquitination), and various metabolic processes (fig. 1; supplementary table S2, Supplementary Material online). GO enrichment of Y transcripts for molecular function is presented in supplementary figure S7, Supplementary Material online.
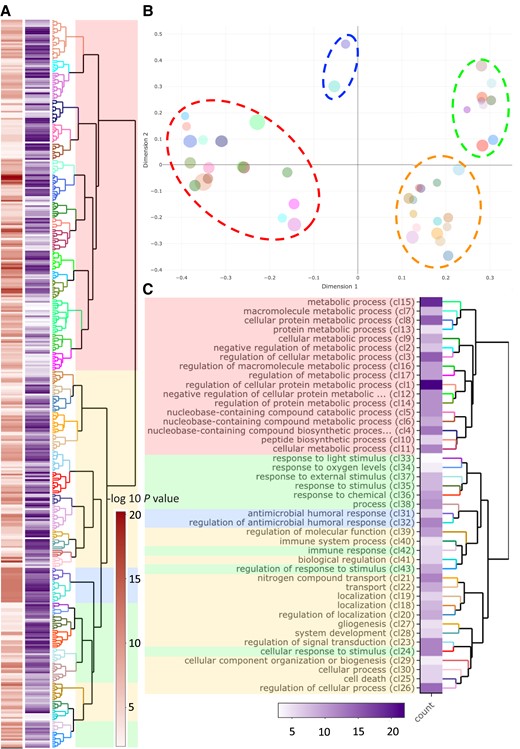
GO enrichment for Y-linked genes with “biological process” annotations. (A) Dendrogram of GO terms based on Wang's semantic similarity distance, heatmap (red) indicates statistical significance as -log10P-values (i.e., higher -log10P-values have higher statistical support) and information content (purple). (B) Multidimensional scaling (MDS) plot based on BMA distance, representing the proximities of dendrogram clusters in (A). Dot size indicates the number of GO terms within each cluster. We highlight the four major functional groups with dashed ellipsoids (red ≅ metabolic processes; blue ≅ antimicrobial response; green ≅ response to stimulus; yellow ≅ development, cell organization, growth, and cell apoptosis) (C) Dendrogram representation of clusters from (B) with GO term description of the first common GO ancestor and heatmap for the number of GO terms within each cluster.
The identified Y contigs, in either the YS or the YL haplotype, do not seem to show a higher number of repeats per length, nor a higher percentage of repeat content, compared with the X or autosomal contigs (supplementary figs. S4 and S5, Supplementary Material online). However, the composition of repeat content on the Y is somewhat unique, where repeats identified as DNA/Maverick and LINE/Penelope are overrepresented, as a proportion of all repeat elements, on the Y compared with the X or autosomal contigs (supplementary fig. S6, Supplementary Material online).
Gametologs, Paralogs, and Ampliconic Genes
We detected 437 transcripts on the YS, of which 202 transcripts are ampliconic, and have between 1 and 13 additional nearly identical copies on the Y (>99.9% nucleotide similarity), forming 67 ampliconic groups. Hence, we identified 302 unique Y-linked transcripts, of which 235 are nonampliconic transcripts and 67 form ampliconic groups. 424 transcripts have at least one gametolog or paralog in the genome (when searching for Y protein sequences against all C. maculatus proteins, using blastp Camacho et al. 2009 (>50% query coverage) and filtering for >80% sequence identity and E-value threshold = 1e-20). With these criteria, we detected in total 281 unique autosomal paralogs, 214 unique X-linked gametologs and 359 unique Y-linked homologous transcripts (supplementary fig. S8, Supplementary Material online). When lowering the sequence similarity threshold, we find homologs even for the remaining 12 Y-linked transcripts, although the best hit protein sequence similarity drops to below 40% for some of them. To identify autosomal or X ancestry for each Y transcript, we categorized them as exclusively autosomal paralogs (n = 157), exclusively gametologs on the X (n = 99) or homologs on both (n = 73) (fig. 2), while excluding genes that have homologs on uncategorized contigs (<100 kb, n = 51 genes). Y shared significantly more exclusive X gametologs than exclusive autosomal paralogs, when accounting for size difference (two-tailed Fisher's exact test: 95%CI (9.56, 16.07), P < 0.0001) or difference in the overall number of transcripts (two-tailed Fisher's exact test: 95% CI (8.32, 14.13), P < 0.0001). Gametologs that have been maintained on the Y are functionally enriched for RNA processing, particularly genes involved in RNA splicing, development as well as metabolic processes. Y transcripts with paralogs on the autosomes are functionally enriched for response to stimulus, developmental processes, protein translation and posttranslation modification (supplementary fig. S10, Supplementary Material online). Interestingly, this elevated sequence similarity between the X and the Y is not reflected in pronounced sequence synteny blocks between X and Y contigs, neither in nucleotide sequence nor gametolog synteny (supplementary fig. S11, Supplementary Material online).
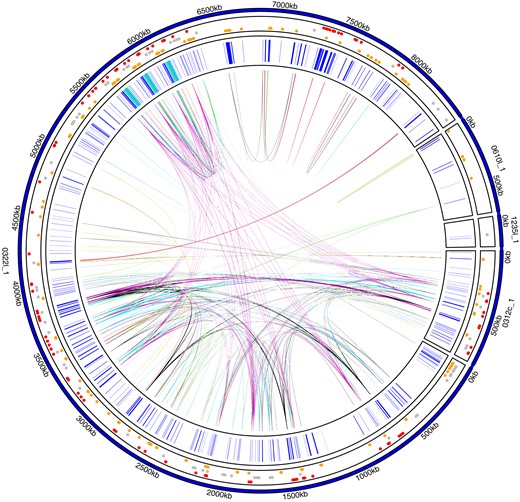
Overview of Y genes. Each amplicon group (i.e., genes with >99.9% nucleotide sequence identity and >95% query coverage) is highlighted with a genomic link. Two hundred nineteen out of a total of 437 Y genes have at least one additional copy on Y. Gene positions of all Y-linked genes are shown in inner track in blue; regions containing TOR are highlighted in turquoise (see fig. 4A for more details). The outer track indicates whether a gene has exclusively gametologs on the X (red, n = 99), paralogs on the autosomes (yellow, n = 157), or both (gray, n = 73); dots are scattered by homolog type. See supplementary figure S9, Supplementary Material online for amplicon groups on the X.
Characterization of the Y Variation Associated with the Body Size Difference
Variant Calling
The patterns of shared single nucleotide polymorphisms (SNPs) and fixed single nucleotide variants (SNVs) in the S and L genomes are well aligned with the expectations considering how the lines were created and further confirm the identity of the detected X and Y sequences. The majority of SNVs (2,823,154) are shared polymorphisms in both genomes (2,812,361 SNPs, 99.6%), and there are only few fixed SNV differences between the two introgression lines (10,793, 0.38%) (table 1). Autosomal contigs have significantly more shared SNP/bp than contigs identified as the sex chromosomes (two-tailed Fisher's exact test: 95% CI [28.8, 30.5], P < 0.0001% and 95% CI [83.2, 109.6], P < 0.0001, for the X and Y, respectively) (supplementary fig. S12, Supplementary Material online), and the X contigs have significantly more shared SNP/bp than the Y contigs (two-tailed Fisher's exact test: 95% CI (2.80, 3.71), P < 0.0001). In contrast, the Y contigs have significantly more fixed SNV differences/bp than autosomal contigs (two-tailed Fisher's exact test: 95%CI (43.4, 47.3), P < 0.0001), and there are no fixed SNV differences on the X contigs (supplementary fig. S13, Supplementary Material online).
The Number of SNP and Fixed Differences between the Two Y Introgression Lines Split by Chromosome Type. Note that Contigs Shorter Than 100 kb Are Not Categorized as Y, X, or A.
| SNP | Fixed SNV | Total Length YS (bp) | Length YS-YL Coverage [bp] | |
|---|---|---|---|---|
| A | 2,802,495 | 7,737 | 1,153,104,983 | 1,143,254,074 |
| X | 4,806 | 0 | 58,557,095 | 58,489,645 |
| Y | 212 | 2,622 | 10,112,272 | 8,276,151 |
| <100 kb | 4,571 | 185 | 24,939,325 | 22,280,823 |
| SNP | Fixed SNV | Total Length YS (bp) | Length YS-YL Coverage [bp] | |
|---|---|---|---|---|
| A | 2,802,495 | 7,737 | 1,153,104,983 | 1,143,254,074 |
| X | 4,806 | 0 | 58,557,095 | 58,489,645 |
| Y | 212 | 2,622 | 10,112,272 | 8,276,151 |
| <100 kb | 4,571 | 185 | 24,939,325 | 22,280,823 |
We identified a total of 137 genes with fixed SNV differences within the gene region or in close proximity to genes (i.e., ±2 kb as an approximation of cis-regulatory up and downstream area) between the two Y-haplotypes (fig. 3). For 12 of these 137 genes, we could identify unique D. melanogaster orthologs and annotate their function via FlyBase (Larkin et al. 2021) including DNA/RNA binding, mRNA splicing, regulation of cell proliferation and protein ubiquitination (supplementary table S3, Supplementary Material online).
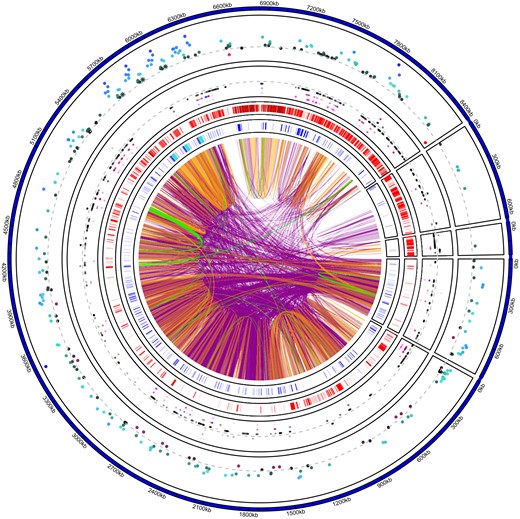
Overview of Y contigs in the YS genome. Color-coded genomic links show high level of nucleotide sequence similarity among and within Y contigs (purple > 99%, orange > 99.9%, green >99.99% nucleotide similarity matches > 1 kb in size). The inner track shows the position of annotated genes in blue, with the TOR regions highlighted in turquoise (fig. 4). The second inner track highlights areas of low mapping coverage between the two Y haplotypes: areas shown in red indicate coverage lower than 17× (i.e., regions that may lack coverage for reliable variant calling via DeepVariant). The third track shows the position of SNVs, SNPs (outside of the dashed gray line) and fixed SNV (inside the dashed gray line). SNVs in black (closest to the dashed gray line) are outside of gene regions; SNVs in magenta (farthest from the dashed gray line) are within gene regions. SNVs in blue and red are in 2 kb upstream or 2 kb downstream (proxy for cis-regulatory region of a gene) of a gene. The outer track shows differential gene expression between males and females. Genes in blue toward the outside are male biased; genes in red toward the center are female biased (gray dashed line is shown as a reference to indicate no difference in gene expression). TOR gene expressions are highlighted as asterisks and are significantly male biased. The YL haplotype is similarly repetitive as the YS haplotype shown here (see supplementary fig. S14, Supplementary Material online).
Y-Linked Target of Rapamycin Amplicon
One of the annotated Y-linked genes indicated strong homology to the gene target of rapamycin (TOR), a highly conserved growth regulatory gene forming the IIS/TOR pathway (Wullschleger et al. 2006). Mapping a consensus TOR protein to our assembly via exonerate (Slater and Birney 2005) identified one autosomal TOR gene, detected in both YS and YL genomes (see supplementary methods, Supplementary Material online “genome annotation” for full details). In addition, there is one gene on the opposite strand that matches to adenosine deaminase 2 in several taxa (also involved in cell proliferation).
We further discovered three consecutive copies of the Y TOR on the YS haplotype that causes the small body size morph in males (fig. 4A), but there is only a single Y-linked TOR in the YL haplotype associated with the large body size morph in males (fig. 4B), revealing Y-linked copy number variation (CNV) of the TOR region. Aligning YS and YL contigs (supplementary fig. S14, Supplementary Material online) shows that the TOR region CNV is located in the middle of an otherwise continuous alignment between two haplotypes, showing that CNV is not an artefact caused by a broken YL haplotype contig.
![Zoom into the TOR region on the Y (blue) and on the autosome (yellow). The inner track shows the position of identified exons in red. Note that all Y linked TOR copies lack the exons 1–5 (from the 5′ end) and have one partial exon 6; all the other TOR exons (7–25) are present and complete. (A) YS haplotype, showing the three TOR regions (denoted with [a], [b], and [c]). Note that we here only present the relevant region of the whole utg0003221_l YS contig (blue, see highlighted region in figs. 2 and 3). (B) YL contig containing the TOR region in the YL haplotype (blue, showing the whole contig) and the autosomal TOR region (yellow, from the annotated YS assembly). In the YL haplotype, we identify only one Y-linked copy.](https://oup.silverchair-cdn.com/oup/backfile/Content_public/Journal/mbe/40/8/10.1093_molbev_msad167/1/m_msad167f4.jpeg?Expires=1748139757&Signature=yGlX5tky514Oh6PFieWg~NUjOoyfSxBkIGBGoUh38Tzs6X7eTduGtN30vCARMYbr-VM1iJIuSxbMo82gVp9Augz3tMddCQTWqe0etqidLiUC~0lWxs6qzbPyPl2W-kkEs1yGXZQyJ-yhO2suzvZ0JjB80vkSeD4Q7sJs7-BafietnnDXv-c5pIngl0H1UYZ6s6ESFnWarBjAHI2zzK5d3hxQaB0KwocE9m8M-~Tb~ySNQANNUQU8syYX4JYn63PbhFzRaZLgBjgJmJqhNTxaW6os-vaT66uukq-relZk0-5osONuPNWr3ps96fJgBq-9vD-h9PVmHAvlMHpt9Lrpfw__&Key-Pair-Id=APKAIE5G5CRDK6RD3PGA)
Zoom into the TOR region on the Y (blue) and on the autosome (yellow). The inner track shows the position of identified exons in red. Note that all Y linked TOR copies lack the exons 1–5 (from the 5′ end) and have one partial exon 6; all the other TOR exons (7–25) are present and complete. (A) YS haplotype, showing the three TOR regions (denoted with [a], [b], and [c]). Note that we here only present the relevant region of the whole utg0003221_l YS contig (blue, see highlighted region in figs. 2 and 3). (B) YL contig containing the TOR region in the YL haplotype (blue, showing the whole contig) and the autosomal TOR region (yellow, from the annotated YS assembly). In the YL haplotype, we identify only one Y-linked copy.
A closer comparison of the autosomal and the Y linked TOR region reveals that all Y-linked TOR copies (in both YS and YL haplotypes) lack the initial five 5′ coding sequences (CDSs) compared with the autosomal TOR. A maximum likelihood tree (fig. 5A) of concatenated CDS comparing all TOR regions (i.e., the autosomal TOR of each assembly [AS and AL], three Y-linked YSTOR copies, and one Y-linked YLTOR) shows the following: First, the autosomal AS and ALTOR regions are isogenic, as expected. Second, all Y-linked TOR sequences cluster together with high bootstrap confidence, indicating that the TOR transposition from the autosome to the Y predates the two Y haplotypes. Also, DeepVariant SNP calling did not detect any SNV differences within the TOR region between the YS and YL haplotypes, which may also be due to lower coverage when mapping the two Y haplotypes against each other (fig. 3). We find with high confidence that YS[a] and YS[b]TOR copies are most similar to each other but the remaining clustering of Y-linked TOR sequences has low support. Importantly, although the exons align with high similarity across all TOR regions, non-CDSs have diverged more and show lower sequence similarities (fig. 5B). This is particularly apparent when comparing autosomal and Y-linked TOR regions, where non-CDSs frequently do not align, indicating structural differences between them (fig. 5B; supplementary fig. S14, Supplementary Material online).
![TOR region genealogy and comparison. (A) Maximum likelihood gene tree of exonic TOR sequences. Note that the AS and AL (highlighted in orange shades) have identical exonic sequences. High bootstrap values (100/100) indicate that Y-linked TOR (highlighted in blue shades) are more similar to each other than to the autosomal TOR and that YS[a] and YS[b] are sister sequences to each other (88/89). However, the clustering of the remaining Y-linked TOR sequences has low support (0/29). (B) Nucleotide alignment with Mummer of exonic and noncoding regions separately. The outer track shows the TOR exon positions in red. Genomic links show nucleotide similarity, exonic links are shifted upwards, whereas noncoding alignments are shifted down to guide easier distinction between the two regions. Fully factorial pairwise comparison of all TOR regions is presented in supplementary figure S15, Supplementary Material online. Left side: Comparison of the autosomal and the YS[c]TOR region. Although there are structural differences (gaps) and low sequence identity matches in the noncoding regions, the exonic regions seem conserved between the autosomal and the YSTOR copy. Note that all Y TOR regions lack the exon 1–5 (from the 5′ end) and exon 6 is only partially present. Exons 7–25 are present in all Y TOR regions. Right side: Comparison of YS[c]TOR and the TOR region on the other Y haplotype (YL). We find high nucleotide similarity in both noncoding and exonic regions alike, with one structural difference in a noncoding region.](https://oup.silverchair-cdn.com/oup/backfile/Content_public/Journal/mbe/40/8/10.1093_molbev_msad167/1/m_msad167f5.jpeg?Expires=1748139757&Signature=gUG9Nx67RkluxiXNN8~Rlwje7M2HvMNgcKj1mCHADIIKQwEizNojHJszhEKnxPmd7VfXmJDkf2NuYicago6t3bP0Xfj6hNc851vJTl1wBsFU7xK3bOORa3U8q~UZxUGnUqYOWbNnJ~jxLCnGfBZvZoc5nj7-myz-DAv6tUcAiIYhaCA1ZHUP~8YntZkjHE9iKXE4alPjoVuLO8OjMsNtqtEY2SLqWRlPn7k6EDWxXXv0whSw~NBEpsyETTzf5fUwfcqLVocRfg6JtWBNXPLMUrlCXSrg9znelhE3~w7HvGsd7TTsplHrQydZu2FPv8kLEqrFCw33vNZeSGBYNaVyrg__&Key-Pair-Id=APKAIE5G5CRDK6RD3PGA)
TOR region genealogy and comparison. (A) Maximum likelihood gene tree of exonic TOR sequences. Note that the AS and AL (highlighted in orange shades) have identical exonic sequences. High bootstrap values (100/100) indicate that Y-linked TOR (highlighted in blue shades) are more similar to each other than to the autosomal TOR and that YS[a] and YS[b] are sister sequences to each other (88/89). However, the clustering of the remaining Y-linked TOR sequences has low support (0/29). (B) Nucleotide alignment with Mummer of exonic and noncoding regions separately. The outer track shows the TOR exon positions in red. Genomic links show nucleotide similarity, exonic links are shifted upwards, whereas noncoding alignments are shifted down to guide easier distinction between the two regions. Fully factorial pairwise comparison of all TOR regions is presented in supplementary figure S15, Supplementary Material online. Left side: Comparison of the autosomal and the YS[c]TOR region. Although there are structural differences (gaps) and low sequence identity matches in the noncoding regions, the exonic regions seem conserved between the autosomal and the YSTOR copy. Note that all Y TOR regions lack the exon 1–5 (from the 5′ end) and exon 6 is only partially present. Exons 7–25 are present in all Y TOR regions. Right side: Comparison of YS[c]TOR and the TOR region on the other Y haplotype (YL). We find high nucleotide similarity in both noncoding and exonic regions alike, with one structural difference in a noncoding region.
In addition to the CNV of the TOR locus, aligning the YS and YL haplotypes to each other suggests that there are further structural differences between the haplotypes (supplementary fig. S15, Supplementary Material online). Moreover, there are similarities between the classes and distribution of repetitive elements between the autosomal and the different copies of the Y-linked TOR region, indicating homology also at the level of TOR-associated repetitive elements (supplementary fig. S16, Supplementary Material online).
Discussion
Here, we assembled two new C. maculatus genomes, and successfully identified 10 Mb of the Y chromosome, using a set of complementary methods, and analyzed the gene content of the Y sequences. We discovered that despite having lost most of its sequence since divergence from the X, the C. maculatus Y is rich in genes, many of which are expressed, with diverse functions from metabolism, development, and stimulus response to regulation of gene expression and translation. This is in line with cytogenetic data suggesting that the Y is mostly euchromatic (Angus et al. 2010), in spite of not recombining. We characterized molecular differences between the two Y haplotypes that were previously inferred from patterns of male limited inheritance of body size (Kaufmann et al. 2021). In addition to fixed single nucleotide differences in proximity of over a hundred genes, we identified a Y-linked copy of a functionally conserved and well-studied autosomal growth factor gene TOR, highlighting the potential for male specific growth regulation via the Y chromosome. Furthermore, we detected CNV of TOR between the two Y haplotypes underlying body size variation. Together our results indicate a central role of the Y chromosome in the evolution of sexual dimorphism in C. maculatus via male-specific evolution of TOR.
XY Identification
Degenerate sex chromosomes are notoriously difficult to assemble (Rhie et al. 2022), and in C. maculatus, the entire genome has a high repeat content (Sayadi et al. 2019). Despite these challenges, long read sequencing yielded high quality and contiguous genome assemblies for both Y introgression lines that allowed us to identify large parts of both the X and the Y chromosomes, greatly extending and curating previously identified sex chromosome-linked portions of the genome. In C. maculatus, the size of the Y and X chromosomes has been estimated as ∼18 and 93Mb, respectively (Sayadi et al. 2019), based on a combination of flow cytometry and cytogenetic data, although the size estimate for the Y is uncertain (Arnqvist et al. 2015). We could assemble four Y contigs yielding 10.1 Mb, ∼56% of the current length estimate. By comparison, in D. melanogaster ∼10% of the Y has been assembled thus far (Hoskins et al. 2015), and to our knowledge, no Y assemblies exist yet for other beetle species. Additionally, we assembled a total of 58.6 Mb of the X chromosome, corresponding to approximately 63% of the estimated size. Sex chromosome contig identification depends on the quality and length of contigs, accuracy and completeness of the genome, and, importantly, on the state of differentiation between the X and Y chromosomes. Here, we rely on a suite of complementary methods including coverage difference between male and female reads, as well as genomic patterns of SNVs between our Y introgression lines that share the genome apart from the nonrecombining Y chromosome. Mapping of previously described putative X and Y contigs (Sayadi et al. 2019) also colocalize to our identified X and Y contigs in our assemblies, as expected. Furthermore, transcript expression patterns across the identified contig groups are in line with the unequal distribution of sex chromosomes between the sexes and show exclusive expression, or significantly higher male bias, of Y linked transcripts, and significantly less male bias for X-linked transcripts, as compared with the autosomal background. A large proportion of Y-linked transcripts show high sequence similarly with X-linked transcripts, in line with their common ancestry. As the expression data used here come from inbred lines that originate from the same ancestral population as the Y introgression lines, future work including gene expression data directly from the Y lines will provide a more complete view of Y linked gene expression.
Crucially, we confirmed the largest identified Y contig (8.4Mb)—carrying the identified Y linked TOR region—via male limited PCR amplification. The designed Y-specific primers work for both identified Y haplotypes and enables molecular sexing, a method that has thus far been lacking for C. maculatus.
Gene Content on the Y
We find 437 Y-linked transcripts (417 genes) and the identified Y contigs show high gene density. The number of genes is similar to the gene rich Y chromosomes characterized in mouse (Soh et al. 2014) and bull (Hughes et al. 2020) but in contrast with human Y and other old insect Y chromosomes (DrosophilaZhang et al. 2020 and mosquito Hall et al. 2016) that harbor only few genes, which have been instrumental in forming the general expectation that Y-chromosomes are low in gene content (Mank 2012). Genes retained on the Y, despite its degeneration, can broadly be categorized into two classes: genes that are dosage sensitive X gametologs (Bellott et al. 2014; Bellott et al. 2017) and genes that are male beneficial, which may have been recruited to the Y via autosomal translocations. Many (often ampliconic) Y genes show testis limited expression and are likely central to the male reproductive function (Skaletsky et al. 2003; Murphy et al. 2006; Hughes et al. 2010; Soh et al. 2014; Janečka et al. 2018; Peichel et al. 2020). However, testis specific expression of highly amplified genes may also be indicative of meiotic drive (Soh et al. 2014; Hughes et al. 2020), in which case the involved genes need not be male beneficial but Y beneficial instead. Y is predicted to accumulate sexually antagonistic genes only beneficial to males (Rice 1984), but there is still little direct evidence to support Y-linkage of traits that are also present in females. Metabolic rate, body size, longevity (Berg and Maklakov 2012; Berger et al. 2014b; Berger et al. 2016), immunity, and gene expression (Immonen et al. 2017; Sayadi et al. 2019; Bagchi et al. 2021) are all sexually dimorphic traits in C. maculatus, indicating their evolutionary history under sexually antagonistic selection. We find functional enrichment of Y-linked genes that reflects these phenotypes remarkably well, including metabolic processes, immune response, response to stimulus and development, cell organization, growth, and cell apoptosis (fig. 1). This suggests that the Y-linked genes affect sexually dimorphic phenotypes beyond the body size (Kaufmann et al. 2021) and can offer a resolution to sexual conflict more broadly in C. maculatus.
Roughly 50% of the Y genes have either exclusively X gametologs (99 genes, 58.6 Mb) or autosomal paralogs (157 genes, 1,153 Mb) with >80% protein sequence similarity (fig. 2), indicating different origins for these genes. Notably, the number of identified X and autosomal homologs is positively correlated (Pearson correlation: t = 20.55, df 113, P < 0.001) for 115 Y-linked transcripts that have homologs on both regions (supplementary fig. S18, Supplementary Material online, note that this includes also transcripts that additionally have homologs on uncharacterized contigs), suggesting their coupling to transposable elements. The higher absolute number of genes acquired from the autosomes follows the pattern seen in D. melanogaster (Carvalho 2002) and humans (Skaletsky et al. 2003), where all or a substantial proportion of functional genes originate from autosomes, respectively. In contrast to known XY systems, in female heterogametic ZW taxa the W chromosomes mainly harbor Z gametologs, for example (Smeds et al. 2015). The difference is explained by sexual selection favoring transpositions to the Y in male heterogametic taxa (Carvalho 2002; Skaletsky et al. 2003; Hughes et al. 2012). The finding that C. maculatus Y contains a mix of male-specific but also seemingly functional X gametologs, with high sequence similarity retained to the X, suggests that the ancestral X genes have still important roles in males and may evolve under purifying selection. These X gametologs are enriched for functions related to development and metabolic processes as well as RNA processing/splicing (supplementary fig. S10, Supplementary Material online). Sex-specific RNA splicing allows expression of alternative transcripts in the sexes and can facilitate sexual dimorphism (Rideout et al. 2015; Rogers et al. 2021). However, whether the X gametologs are dosage-sensitive and sexually concordant or sexually antagonistic and on the Y specialized for male beneficial functions remain to be tested.
The male-specific Y genes acquired via transposition from autosomes are functionally enriched for a broader range of terms than the gametologs and account much of the general enrichment patterns observed across all Y genes (supplementary fig. S10, Supplementary Material online). An important avenue by which the Y chromosome can affect male phenotypes is by modulating gene expression throughout the genome, an effect described in D. melanogaster (Lemos et al. 2008) and for the SRY locus in mammals (Berta et al. 1990; Goodfellow and Lovell-Badge 1993). In line with such a mechanism, Y-autosome epistatic effects have also been associated with sexually antagonistic coloration in guppies (Paris et al. 2022). Callosobruchus maculatus Y shows significant enrichment for DNA binding molecular function, a category that SRY also falls into (supplementary fig. S7, Supplementary Material online), which is consistent with the idea that the Y chromosome has a wider regulatory role. The autosomal paralogs on the Y are enriched for genes involved in protein translation and posttranslational modification. Although transcriptional sex differences are the commonly evoked explanation for how sexual conflict can be resolved (Ellegren and Parsch 2007), this suggests that the Y chromosome may allow for translational modification to alter male beneficial phenotypic expression.
The Y contigs also contain a large number of sequences with strong homology to other Y loci, suggesting frequent gene duplication events, which is commonly observed in Y chromosomes (Skaletsky et al. 2003; Hughes et al. 2010; Soh et al. 2014; Brashear et al. 2018; Janečka et al. 2018; Ellison and Bachtrog 2019; Hughes et al. 2020; Peichel et al. 2020). The level of gene amplification we see is similar to the stickleback Y (Peichel et al. 2020) but less pronounced than in well-characterized mammalian Y chromosomes (Skaletsky et al. 2003; Hughes et al. 2010; Soh et al. 2014; Brashear et al. 2018; Janečka et al. 2018; Hughes et al. 2020). Amplification of genes on the Y may be fueled by sexual conflict over associated traits (Soh et al. 2014). Conservation of ampliconic genes is also observed in mammals (Brashear et al. 2018) and suggests that male specific amplified genes may have a large evolutionary advantage that withstand degenerative processes, such as Muller's ratchet (Brashear et al. 2018). Ampliconic genes tend to be expressed in the testis and enriched for male-specific reproductive functions in mammals (Skaletsky et al. 2003; Hughes et al. 2010; Soh et al. 2014; Janečka et al. 2018) and in stickleback (Peichel et al. 2020). But here, we could not yet detect any genes with obvious reproductive functions in males, based on GO terms or previously described C. maculatus seminal fluid proteins (N = 185) (Bayram et al. 2019).
X and Y do not form a chiasmata in C. maculatus and hence lack recombination by crossing-over and the PAR altogether. All species belonging to the Callosobruchus genus lack PAR based on their meiotic karyotypes (Blackmon and Demuth 2014), suggesting that XY divergence predates the genus. Long evolutionary history without recombination with the X could explain why our analysis of sequence similarity between X and Y does not indicate synteny between them (supplementary fig. S11, Supplementary Material online), nor do we find indications for inversion blocks that could have led to recombination suppression between X and Y. Ampliconic regions are prone to structural rearrangements (Jackson and Fink 1981; Skaletsky et al. 2003), which may cause further amplification and can also contribute to the lack of synteny between the X and Y.
Molecular Differences Between the YS and YL Haplotypes Associated with Body Size Variation
We detected substantial molecular differences between the sequences of the YS and YL haplotypes associated with two distinct male limited body size morphs (Kaufmann et al. 2021). As expected for a nonrecombining, hemizygous genetic region, nearly all identified point mutation differences are fixed between the two Y haplotypes. The few detected SNPs could indicate real segregating polymorphisms (as the sample for sequencing consisted of multiple males) but are more likely artefacts caused by repetitive elements that add difficulty in genome assembly, accurate mapping, and variant calling. The 137 genes with fixed differences between the YS and YL haplotypes either in their coding or potential cis-regulatory regions are candidates to explain the phenotypic differences. Independent of body size, males with the YS haplotype also sire more offspring (manuscript in preparation). This could suggest that the Y haplotypes could cause differences in regulatory pathways associated with seminal fluid production or spermatogenesis, although we did not find any previously described C. maculatus seminal fluid proteins to be Y-linked. We identified Drosophila orthologs for 14 genes with fixed SNVs, and although we do not find any obvious causal candidate to explain the difference in reproductive capacity, we find two notable orthologs: male-specific lethal 2 and ubiquitin specific protease 47. Male-specific lethal 2 is a well-known regulator of dosage compensation between the X and Y in D. melanogaster (Zhou et al. 1995), which opens for differences in regulation of X-linked gene expression as a possible avenue to contribute to the phenotypic differences between the two Y haplotypes. Further, ubiquitin specific protease 47 is known to interact with insulin/insulin-like signaling (IIS) pathway in Drosophila (Ashton-Beaucage et al. 2016), an important pathway that connects nutrient levels to metabolism, growth, development and longevity, which could affect the observed growth differences between the male morphs.
Remarkably, the longest C. maculatus Y chromosome contig also contains a TOR gene ortholog, the strongest candidate to explain the Y linked size variation between the sexes as well as in males. The TOR signaling pathway is highly conserved and present in organisms from bacteria and plants to animals and is one of the most ancient nutrient-sensing pathways (Wullschleger et al. 2006). The TOR pathway regulates growth and lifespan by coupling the growth factor signaling with nutrient sensing (Wullschleger et al. 2006). It is centrally involved in controlling cell metabolism, growth, proliferation and apoptosis. Together with IIS, TOR has also been implicated in differential gene expression between the sexes (Graze et al. 2018) and more specifically sexual size dimorphism in D. melanogaster (Rideout et al. 2015). To our knowledge it has never been detected on a sex chromosome before. But the potential for Y specific regulation of the TOR pathway has recently been implicated in the male polymorphic Poecilid fish Poecilia parae, where an inhibitor of the TOR pathway has been detected segregating on the Y (Sandkam et al. 2021). To understand whether the C. maculatus TOR gene on the Y represents ancestral homology with the X, or has occurred by a transposition from the autosomes after X-Y divergence, we searched the genome for any TOR copies. We could not detect the TOR on the X, but only in one of the autosomal contigs, supporting its origin on the Y by translocation. We detected multiple transposable element sequences flanking the TOR sequence in all of the Y copies as well as the autosomal one (supplementary fig. S17, Supplementary Material online), which could have played a role in the translocation and should be subject to further investigations.
Importantly, we detected TOR CNV between the YS and YL haplotypes, which makes this gene the most likely candidate for the striking difference in male body size between the two haplotypes, and thereby sexual size dimorphism (Kaufmann et al. 2021). The elevated intronic sequence divergence between the autosomal and Y-linked TOR copies suggests that the translocation of the TOR has occurred before the split of the two Y haplotypes, and also that sufficient time has passed since the translocation, to accumulate such differences in the introns. The exonic sequences have diverged only little, suggesting purifying selection on all copies to retain Y TOR regions as functional.
How the Y-linked TOR functions and putatively interacts with the autosomal TOR pathway presents important area for future research. The Y-linked, exonic TOR sequence is nearly identical to its autosomal paralog apart from five missing exons on the 5′end. The N-terminal of TOR proteins consist of HEAT repeats (Perry and Kleckner 2003) that mediate protein-protein interactions (Baretić et al. 2016). Empirical studies in D. melanogaster (Hennig and Neufeld 2002) and amoeba Dictyostelium discoideum (Swer et al. 2016) have demonstrated that overexpressing TOR inhibits cell growth and proliferation similar to loss of function mutants (Hennig and Neufeld 2002; Swer et al. 2016). Even a truncated extra copy of TOR is enough to reduce growth (Vilella-Bach et al. 1999; Hennig and Neufeld 2002). Gene copy number can correlate positively with gene expression (Shao et al. 2019), and TOR expression in adults in our data is overall male-biased (fig. 3). Paralog interference has been suggested as one possible consequence of gene duplications (Baker et al. 2013), whereby the paralogs can mutually exclude each other from binding with potential partners. The Y TOR could therefore affect male growth by interfering with the autosomal TOR pathway. The more common YS haplotype that makes males roughly 30% smaller than the YL haplotype has two additional copies of TOR on the Y, suggesting that the additional copies lead to further growth inhibition. Future work can establish how each of the copies in the two haplotypes may be expressed and function in regulating growth.
Recombination is a key mechanism generating and maintaining allelic diversity across loci. Finding substantial diversity in the absence of recombination is therefore unexpected, but echoes similar recent findings in Y-polymorphic fish species (Sandkam et al. 2021; Singh et al. 2023), including Xiphophorus where CNV in Y linked melanocortin 4 receptor gene is associated with male limited body size polymorphism (Lampert et al. 2010). Genetic variation should be rapidly fixed by selection and drift on the Y chromosome. Finding segregating Y polymorphism in both copy number and SNV differences in proximity to over 100 genes therefore suggests that processes such as frequency dependent selection likely have maintained these Y haplotypes in the population for a longer evolutionary time. Our identification of over 400 genes on the C. maculatus Y, despite the evidence of its degeneration, suggests that males can harbor substantial evolutionary potential through their Y chromosomes. Y translocation and TOR duplications reveal how evolutionary novelty in a conserved gene can be generated, adding to the growing literature that posit variation in gene copy numbers as central to generating genetic variance, and thereby to adaptive evolution.
Materials and Methods
Study Organism and Generation of the Y-Lines
As a model organism to study sexual conflict, much is known about sexual antagonism in the seed beetle C. maculatus. Aphagous adult C. maculatus females oviposit directly onto legume seed pods, within which larvae will develop for about 3 weeks, which allows for large scale experiments across multiple generations. The populations used in this study all stem from originally field caught (2010) individuals from Lomé, Togo (more details in Berger et al. 2014a) and have been kept in the lab for ∼200 generations as 41 isofemale lines.
The creation of YS and YL haplotype introgression lines is described in detail in (Kaufmann et al. 2021). Briefly, replicated bidirectional selection was applied on male body size for 10 generations, giving rise to L and S males. We then crossed S and L males from these selection lines with females from a single inbred line (originating from the same Lomé base population as the selection lines, inbred for >20 generations Grieshop and Arnqvist 2018), respectively. At each subsequent generation, sons were backcrossed to females from the maternal line, for a total of 11 generations, after which the lines were sequenced. The backcrossing scheme replaced the original autosomes and the X chromosome with those from the inbred line while maintaining the nonrecombining parts of the Y chromosome of the founding S or L males. Subsequent analysis of the body sizes confirmed the presence of two distinct male body size classes, whereas there was no difference in female body size (Kaufmann et al. 2021). We chose a single line representing each of the YS and YL haplotypes for sequencing.
The beetles used for the sequencing were reared under strictly standardized and controlled laboratory conditions, to minimize any environmental variation including risk of infestations. The larval food (mung beans, Vigna radiata, which is the only food source as adults do not eat) was stored in −20 °C for several months prior to use. The beetles were given ad libitum access to food, and reared under low density in incubators with 12:12 light, 29 °C temperature and 50% humidity.
Sequencing and Genome Assembly
DNA Extraction and Library Preparation
For the extraction of high molecular weight (HMW) DNA, we flash froze adult virgin males (within 24 h after emergence) in liquid nitrogen. Individual abdomens were dissected on ice to avoid thawing of the tissue by removing head, thorax and the elytra. Five male abdomens were pooled and ground into fine powder with liquid nitrogen and a precooled pestle. The QIAGEN Genomic-Tip 20/g kit was used to extract HMW DNA, following the manufacturer's protocol, with an over-night incubation time for cell lysis (i.e., 12 h). To achieve the required amounts of HMW DNA, we pooled two samples (total of 10 males per Y introgression line). Five micrograms of genomic DNA were sheared on a Megaruptor3 instrument (Diagenode, Seraing, Belgium) to a fragment size of about 13–16 kb. The SMRTbell library was prepared according to Pacbio's Procedure & Checklist—Preparing HiFi Libraries from low DNA input using SMRTbell Express Template Prep Kit 2.0 (Pacific Biosciences, Menlo Park, CA, USA). The SMRTbells were sequenced on a Sequel IIe instrument, using the Sequel II sequencing plate 2.0, binding kit 2.2 on three Sequel II SMRT Cell 8 M per introgression line, with a movie time of 30 h and a pre-extension time of 2 h.
The genomes of the YS and the YL introgression lines were assembled individually using hifiasm (v. 0.7-dirty-r25) (Cheng et al. 2021) with default settings, yielding the S and L genomes. For each, the raw primary and alternative assemblies from hifiasm were subsequently separated into two approximately equal sized haplotype assemblies with purge_dups (v. 1.2.5, default parameters) (Guan et al. 2020). Following the purge_dup partitioning of repeats and low coverage contigs that could not be assembled, the k-mer completeness of the primary and alternative assemblies was checked again with Merqury, and the read mapping rate back to the final assembly assessed using default mapping parameters. Genome assembly completeness was also assessed via BUSCO (Manni et al. 2021), using default parameters on the insecta_odb10 database. We then chose the S genome (containing the ancestrally more frequently occurring YS haplotype) to be the reference genome, that we subsequently soft-masked for repetitive content (Arnqvist et al. 2023) using RepeatMasker (v. 4.1.2) (Smit et al. 2015) and fully annotated using the BRAKER (v. 2.1.6) (Hoff et al. 2019)/TSEBRA (v. 1.0.3) (Gabriel et al. 2021) pipeline. Detailed annotation methods are provided in the supplementary methods, Supplementary Material online “genome annotation.”
Identification of Y and X Contigs
Mapping of Putative X and Y Contigs
We used gmap (v. 2021-03-08) (Wu and Watanabe 2005) default setting to quantify the number of hits of putative X and Y contigs, previously identified in C. maculatus (Sayadi et al. 2019), to our assembled contigs in both genomes. Mapping to contigs shorter than 100 kb was excluded.
Sex Assignment Through Coverage
To independently identify putative sex-linked contigs in each of our assemblies, we employed SATC (Nursyifa et al. 2022), which uses normalized coverage information across contigs to first identify XX and XY individuals from sets of male and female samples (Nursyifa et al. 2022). Informed by a t-test, SATC compares normalized coverage at each contig between XX and XY individuals to find contigs with significantly different coverage. At sex-linked chromosomes, specific XY:XX coverage ratios are expected for X-linked contigs (0.5:1) and Y-linked chromosomes (1:0) (Nursyifa et al. 2022). In practice, coverage can be highly variable resulting in deviations from the strict expectation. Here, we used the SATC approach to identify any contigs that had significantly different coverage between XX and XY individuals. We collected Illumina short-read sequencing data from Sayadi et al. (2019; ENA accession numbers: ERR3053159, ERR3053160, ERR3053163, ERR3053164, ERR3053161, ERR3053162, ERR3053165, and ERR3053166) (Sayadi et al. 2019). To increase certainty, we limited ourselves to the analysis of contigs >100 kb in length. Contigs that are shorter than this account for a total of 24′939′325 bp and make up only 2.00% of the reference genome (1′246′713′675 bp). For more details, see supplementary methods, Supplementary Material online “sex assignment through coverage (SATC).”
Polymerase Chain Reaction
We confirmed male-specificity of the longest identified Y contig with a multiplexed PCR, using two primers pairs, one that is Y specific and amplifies a 297 bp on utg000322l_1 product and a primer pair that amplifies an autosomal product of 189 bp length on utg000177l_1 as a positive control. For more details, see supplementary methods, Supplementary Material online “Molecular sexing.”
Gene Expression Analysis
To assess how the identified sex-linked genes may be expressed, we used gene expression data from virgin adult males (n = 29) and females (n = 32) (Kaufmann 2022). The expression data were collected from reproductive tissues of the abdomen of virgin individuals from different inbred lines that originate from the same Lomé base population as the Y lines. We used splice variant aware mapping of transcript via STAR (v. 2.7.2b) with default settings (Dobin et al. 2013). We then used picard (v. 2.23.4) (Broad Institute 2019) to mark duplicates and subread (v. 2.0.0) featurecount (Liao et al. 2014) to summarize exons by gene IDs allowing for multimappers due to high gene duplications on the Y. Additionally, we also summarized exons by gene IDs using default setting (i.e., no multimapping). We then used DESeq2 (Love et al. 2014) to analyze the gene expression patterns in males and females. We split the dataset into genes on the autosomes and the identified X and the Y contigs.
GO Enrichment on the Y
We examined how the Y chromosome is functionally diverged from the X using GO enrichment analysis. For this, we used the topGO R package (Alexa and Rahnenführer 2022), with nodeSize parameter of 10, comparing the frequency of terms among the Y linked transcripts to those among all transcripts on the sex chromosomes (X and Y). Visualization and clustering of the GO enrichment analysis was done using ViSEAGO R package (Brionne et al. 2019), clustering GO terms based on Wang's semantic similarity distance and ward.D2. Further aggregating of semantic similarity GO clusters was done with best-match average (BMA) method, as implemented in the ViSEAGO package.
Identification of Y Homologs on the X and the Autosomes
To identify whether the genes on the Y represent X gametologs or paralogs translocated from the autosomes, we used blastp (v.2.12.0) (Camacho et al. 2009) to compare Y proteins against all proteins in our reference assembly, requiring a minimum Y protein coverage of >50% and at least >80% AA identity, excluding self matches. To test whether X contigs show elevated number of Y gametologs due to shared XY ancestry, we compared the number of Y transcripts for which we exclusively find gametologs on the X, to the number of Y transcripts with exclusively paralogs on the autosomes, while accounting for difference in length or number of transcripts between autosomes and the X.
Y Amplicons
The mammalian Y chromosomes contain large ampliconic regions enriched with high-identity segmental duplications, for example (Skaletsky et al. 2003). Given that there seem to be a lot of duplicated genes also on the C. maculatus Y, we used blastn (v. 2.12.0) (Camacho et al. 2009) to blast all concatenated CDS for each transcript on the Y contigs against each other with stringent requirements of >95% query coverage and >99.9% sequence identity and excluding self matches, to detect amplicon groups on the Y.
Characterization of the YS and YL Haplotypes
Variant Calling
We used minimap2 (v. 2.18-r1015) (Li 2018) to align reads to the reference allowing for up to 20% sequence divergence (asm20), as was recommended for HiFi reads. Duplicates have been marked with picard (v. 2.23.4) (Broad Institute 2019). We then used DeepVariant (v. 1.3.0, default settings) (Poplin et al. 2018) with model type PACBIO for HiFi reads to call variants and GLnexus (v. 1.4.1) (Lin et al. 2018) to merge the variant calling files for both Y haplotype lines. We used vcftools (Danecek et al. 2011) to filter the VCF files to only get SNVs with a minimum depth of 5 and an upper depth cutoff of 65. SNV were categorized into SNPs that are shared between both Y introgression lines (SNP) and single nucleotide differences that are fixed between the two Y-introgression lines (fixed SNV).
TOR Candidate Gene Analysis
A copy of a conserved gene coding for TOR was discovered in a putative Y contig identified in the study that sequenced C. maculatus genome for the first time (Sayadi et al. 2019). TOR is well known for its role in regulating growth across taxa (reviewed in Wullschleger et al. 2006) and is therefore a prime candidate to explain the male body size difference between the YS and YL haplotypes. We identified and curated TOR locations in the genome (see supplementary methods, Supplementary Material online “genome annotation” for full details). To compare the different TOR regions, we used MAFFT (v. 7.407, with –ep 0 –genafpair parameters) (Katoh et al. 2002) to align concatenated TOR CDS of each identified region in both assembled genomes and create a guided gene tree. To assess whether there are differences in exonic and non-CDSs divergence across the different TOR regions, we used fully factorial pairwise alignment of exonic and non-CDSs separately. For the noncoding alignment, we masked identified exonic regions with bedtools maskfasta and then aligned the non-CDSs with masked exons via Mummer nucmer (v. 4.0.0 with –maxmatch –c 100 parameters). For the exonic alignment, we used the same procedure but masking the noncoding regions instead. We visualized the exonic and noncoding alignments with the R package circlize (Gu et al. 2014).
Supplementary Material
Supplementary data are available at Molecular Biology and Evolution online.
Acknowledgments
We thank Johanna Liljestrand-Rönn for help with DNA extractions, James M. Howie for help to develop the molecular sexing protocol, and Madeline Chase for computational advice and feedback on figures. We thank Martyna Zwoinska and Göran Arnqvist for valuable discussions. We would like to acknowledge support of the National Genomics Infrastructure (NGI)/Uppsala Genome Center and UPPMAX for providing assistance in massive parallel sequencing and computational infrastructure. Work performed at NGI/Uppsala Genome Center has been funded by RFI/VR and Science for Life Laboratory, Sweden. Computations were enabled by resources in projects SNIC 2022/5-83 and SNIC 2022/22-176 provided by the Swedish National Infrastructure for Computing (SNIC) at UPPMAX, partially funded by the Swedish Research Council through grant agreement no. 2018-05973. This work was funded by the grants from the Swedish Research Council (grant no. 2019-05038) and Carl Trygger Foundation (grant no. CTS-18:163) to E.I. and a research grant from Nilsson-Ehle Endowments (grant no 146700723) to P.K.
Author Contribution
The study idea and general design was conceived by E.I. SATC, Repeat analysis and identifying Drosophila orthologs of Y-linked genes (including associated tables and figures) was done by R.A.W.W. Molecular sexing protocol was designed by K.P and E.I and optimized by K.P. Genome was assembled by C.T.-R. and annotated by D.G.S. All other laboratory work, data analyses, and figures were done by P.K. with input from E.I. The manuscript was written by P.K and E.I. with contributions from R.A.W.W. and D.G.S.
Data Availability
Sequencing data are available on ENA study_ID PRJEB62873, and the code is available in Zenodo (DOI: 10.5281/zenodo.7948013).
Conflict interest statement. The authors declare no competing interests.
References
