


Abstract
Throughout the Plio-Pleistocene, climate change has impacted tropical marine ecosystems substantially, with even more severe impacts predicted in the Anthropocene. Although many studies have clarified demographic histories of seabirds in polar regions, the history of keystone seabirds of the tropics is unclear, despite the prominence of albatrosses (Diomedeidae, Procellariiformes) as the largest and most threatened group of oceanic seabirds. To understand the impact of climate change on tropical albatrosses, we investigated the evolutionary and demographic histories of all four North Pacific albatrosses and their prey using whole-genome analyses. We report a striking concordance in demographic histories among the four species, with a notable dip in effective population size at the beginning of the Pleistocene and a population expansion in the Last Glacial Period when sea levels were low, which resulted in increased potential coastal breeding sites. Abundance of the black-footed albatross dropped again during the Last Glacial Maximum, potentially linked to climate-driven loss of breeding sites and concordant genome-derived decreases in its major prey. We find very low genome-wide (π < 0.001) and adaptative genetic diversities across the albatrosses, with genes of the major histocompatibility complex close to monomorphic. We also identify recent selective sweeps at genes associated with hyperosmotic adaptation, longevity, and cognition and memory. Our study has shed light on the evolutionary and demographic histories of the largest tropical oceanic seabirds and provides evidence for their large population fluctuations and alarmingly low genetic diversities.
Introduction
Climate change in the past has shaped the evolution of species and populations on this planet (Chen et al. 2011). Ocean climate and ecosystems are greatly influenced by climate change, and oceanic species have been subjected to extreme climatic fluctuations (Grant et al. 2014), which will become more extreme in the Anthropocene (Lewis and Maslin 2015). Global warming and cooling and climatic fluctuation can alter ocean currents and primary productivity in the Pacific (Hoegh-Guldberg and Bruno 2010), and can hence impact the distribution and survivorship of different marine species. Pelagic seabirds represent a group that is particularly vulnerable to such climate-related changes. Although there are many studies of seabirds in the polar regions (e.g., Cole et al. 2019; Kersten et al. 2021), there is limited population genomics research of seabirds in the tropical Pacific region, which is also a region suffering a great impact of climate change (Lam et al. 2020).
Albatrosses (Diomedeidae, Procellariiformes) are the largest among oceanic seabirds. There are only three species that breed in the North Pacific Ocean: the black-footed albatross (Phoebastria nigripes) and Laysan albatross (P. immutabilis) mainly breed in the Hawaiian archipelago, and the short-tailed albatross (P. albatrus) breeds on islands south of Japan (fig. 1A). These three species, together with the waved albatross (P. irrorata) in the Galapagos, are the only albatrosses found in the North Pacific Ocean and, as the most tropical of all albatross species, are subject to the effects of environmental change in the tropical region. Diomedeidae are among the most threatened avian families (Phillips et al. 2016). All albatross species, like many other seabirds, are of conservation concern. P. irrorata is critically endangered, P. albatrus is vulnerable, and both P. nigripes and P. immutabilis are near threatened (IUCN 2022). In addition to climate change (Reynolds et al. 2015), they face additional threats from pollution (Vo et al. 2011; Gray et al. 2012), bycatch (Phillips et al. 2016), and habitat loss (Reynolds et al. 2017). Their life-history characteristics, such as long generation time and long time to reach sexual maturity (Van Ryzin and Fisher 1976), small clutch size, and low fecundity (Jouventin and Dobson 2002), make them especially vulnerable to these rapidly increasing threats in the Anthropocene.
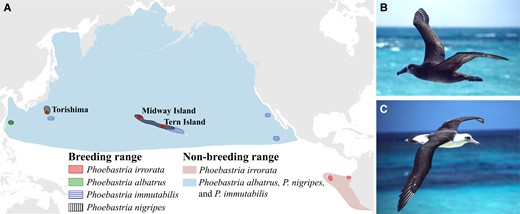
(A) Ranges of North Pacific albatrosses. Red dots indicate sampling sites (Midway Island, Tern Island, and Torishima) of Phoebastria nigripes and/or P. immutabilis. (B) P. nigripes and (C) P. immutabilis. Photos © Scott V. Edwards.
Genetic diversity is important for a species to adapt to a changing environment (Steiner et al. 2013). Both genome-wide diversity and diversity of particular functional genes can have significant effects on the survival and fitness of organisms. Endangered species usually have low genetic diversity and hence lower evolutionary potential than species with high genetic diversity. A decrease in genetic diversity can be caused by population bottlenecks and population size fluctuations, which were strongly affected by climate change in the past. The study of the demographic history of a species and how it might be interrelated with climate change and distribution range shifts will help us to understand the future evolutionary trajectories of threatened species in the face of the rapid human-driven climate change that may lead to conditions outside of their natural range. An earlier study shows that P. nigripes may have a low genetic diversity (Dierickx et al. 2015). To understand the risk of extinction and to develop proper conservation plans for the albatrosses, it is imperative for us to understand both the genome-wide diversity and adaptive diversity of these species (Steiner et al. 2013). Genomic regions important for adaptation can also be revealed by the signature of selective sweeps in the genomes (Moest et al. 2020).
In addition, there are also reports of hybridization between P. nigripes and P. immutabilis, which indicates possible introgression of genetic materials between the two species (Rohwer et al. 2014). P. nigripes and P. immutabilis have much in common, including high overlaps in their distribution ranges and breeding sites and timing (Fisher 1972). One of the major differences is the coloration, with P. nigripes being melanic while only the upper surfaces of wings and back are black in P. immutabilis (fig. 1 and supplementary fig. S1, Supplementary Material online). Hybrids between the two species have intermediate plumage color (McKee and Pyle 2002; Rohwer et al. 2014). Although gene flow between closely related avian species is not uncommon (Toews et al. 2016), given both species are facing multiple threats and the increasing risk of extinction due to climate change and water level rise (Reynolds et al. 2015), introgression of genetic materials from sister species may lead to outbreeding depression due to the disruption of coevolved genes in the genome. The extent and direction of introgression between these two species are not well understood, and this knowledge can help us to understand if introgression may pose another threat to the albatrosses.
In this study, we perform whole-genome analyses to examine the evolutionary and demographic histories of all the North Pacific albatrosses, in particular the sister species P. nigripes and P. immutabilis that share the most recent common ancestor. A whole-genome approach has the advantage of superior resolution relative to studies that focus solely on candidate genes or part of the genome, but thus far it has only been applied to genomics studies of the Atlantic puffin (Kersten et al. 2021) and common murre (Tigano et al. 2018) among oceanic seabirds. We study both the genetic diversity at the genome-wide level and of particular functional genes of adaptive value, that is the major histocompatibility complex (MHC) genes (Steiner et al. 2013), which play a crucial role in pathogen resistance. The diversity of these functionally important genes has been demonstrated to persist despite a decline in genome-wide diversity in endangered species that suffered population bottlenecks (Aguilar et al. 2004). We further investigate the divergence and gene flow between P. nigripes and P. immutabilis. Genomic regions are examined for signatures of selective sweeps to determine if any genes and gene ontology pathways might be under selection. We also conduct ecological niche modeling to determine the change in distribution range in the past and how it might influence the demographic history. Demographic histories of major prey species of P. nigripes and P. immutabilis (Harrison et al. 1983; Cherel and Klages 1998) are also investigated to explore their potential associations with albatross population size fluctuations. The knowledge of the evolutionary and demographic history, gene flow, genetic diversity, and breeding range change will be valuable for the conservation of these iconic oceanic seabirds and for us to understand the potential effect of climate change on the biodiversity of the North Pacific Ocean.
Results and Discussion
Albatross Genome Assemblies
To study the demographic histories of the albatrosses, we sequenced the whole genome of the four North Pacific albatrosses and the outgroup wandering albatross (Diomedea exulans) (supplementary tables S1 and S2, Supplementary Material online). We additionally performed low-coverage whole-genome resequencing of 15–16 individuals of P. nigripes and P. immutabilis for more detailed analyses. We assembled the draft genomes of five albatrosses (supplementary table S3, Supplementary Material online) with a genome size of approximately 1.2 Gb. The scaffold N50 ranged from ∼1.1 Mb (D. exulans) to ∼1.6 Mb (P. immutabilis). All genomes had >98.5% completeness and more than 18,000 protein-coding genes predicted (supplementary table S3, Supplementary Material online).
Revised Phylogeny of the North Pacific Albatrosses
Using whole-genome phylogenomic analyses and a mito-genome tree, we determined the phylogenetic relationships of the four North Pacific albatross species. Our revised phylogeny places the three species breeding in the North Pacific (fig. 2A and supplementary fig. S2, Supplementary Material online) in a monophyletic group to the exclusion of P. irrorata, which differs from earlier topologies inferred using only cytochrome b (cytb) sequences that lacks the power to resolve the relationship (Nunn et al. 1996; Chambers et al. 2009). Colonization of the North Pacific Ocean was therefore likely a single event by the common ancestor of P. nigripes, P. immutabilis, and P. albatrus.
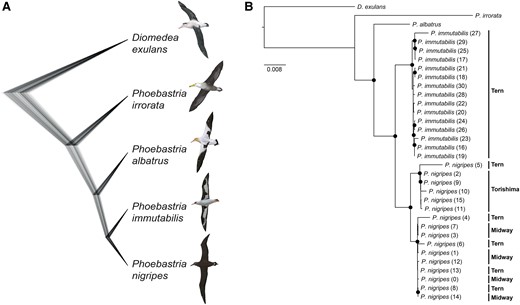
Species phylogeny of North Pacific albatrosses (Phoebastria spp.). Phoebastria nigripes and P. immutabilis are sister species, which cluster with P. albatrus to form a monophyletic clade. P. irrorata is the outgroup to this clade. Species tree inferred using (A) SNAPP based on SNPs. Topology is the same as MP-EST species trees based on UCEs, exons, and introns (supplementary fig. S1, Supplementary Material online). Diomedea exulans is included as outgroup. Scales are shown in coalescent units. (B) Phylogeny based on whole mitochondrial genomes. Individual IDs are in parentheses (see supplementary table S1, Supplementary Material online for sample information). Islands of origin are shown at right. Black circle indicates bootstrap support >90%. Illustrations reproduced with permission of Lynx Edicions.
Divergence and Gene Flow between P. nigripes and P. immutabilis
Although there are reports of hybridization between P. nigripes and P. immutabilis (Rohwer et al. 2014), little is known of the extent of introgression between the two species. The divergence between these two most closely related North Pacific albatrosses (mean FST = 0.63; supplementary fig. S3, Supplementary Material online) was relatively high compared with other hybridizing avian species, such as Vermivora warblers (mean FST = 0.0045; Toews et al. 2016), hummingbird species (mean FST = 0.041–0.323; Henderson and Brelsford 2020), and Ficedula flycatchers (mean FST ∼0.29; Burri et al. 2015) for hybridizing bird species. Consistent with the mito-genome tree, based on samples collected from both Hawaiian and Japanese colonies, principal component and STRUCTURE analyses of genome-wide single nucleotide polymorphisms (SNPs) clearly differentiated these species and identified further genetic structuring within P. nigripes, with the Torishima population being genetically distinct from the Midway and Tern island populations in the leeward Hawaiian islands (fig. 3A and B and supplementary figs. S4 and S5, Supplementary Material online). TreeMix analyses suggested an evolutionary history involving very low gene flow between the albatross species (fig. 3C and supplementary fig. S6, Supplementary Material online). Gene flow from P. immutabilis to P. nigripes on Tern Island was detected but accounted for a very small proportion of Tern Island ancestry. ABBA-BABA tests detected substantial gene flow among P. nigripes populations, but not between P. nigripes and P. immutabilis (fig. 3D and supplementary table S4, Supplementary Material online). The joint demographic history of P. immutabilis and P. nigripes suggests a scenario without gene flow (fig. 3E and supplementary fig. S7, Supplementary Material online). Under this scenario, the two species diverged from each other approximately 167k generations ago (fig. 3E), that is approximately 1.7–2.9 Ma during the beginning of the Pleistocene.
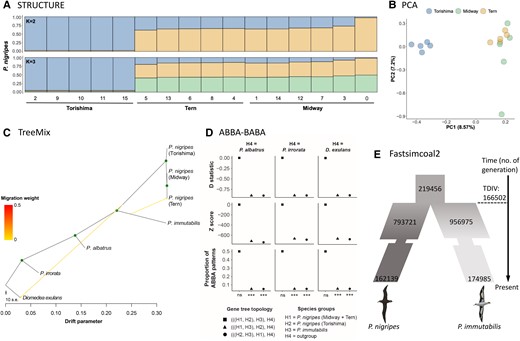
Population structure and gene flow in tropical albatrosses. (A) Population structure of P. nigripes inferred by STRUCTURE (K = 2 and 3). Assignment probabilities of individuals to one or other cluster(s) are indicated on the y-axis. Individual IDs are indicated on the x-axis along with their population of origin. (B) PCA for P. nigripes individuals. (C) Gene flow among albatross species detected by TreeMix. The migration weight represents the fraction of ancestry derived from the migration edge. Green circle on node indicates bootstrap support >90%. (D) Introgression inferred by ABBA-BABA tests between P. nigripes populations and P. immutabilis using three different outgroup species. The test significance is indicated on the x-axis following P-values as follows: ***P < 0.001, **P < 0.01, *P < 0.05, and (ns) nonsignificant. Detailed results are given in the supplementary table S1, Supplementary Material online. (E) Divergence of P. nigripes and P. immutabilis reconstructed by Fastsimcoal2. Numbers represent effective population size or generation number (not to scale). Detailed results are given in the supplementary figure S7, Supplementary Material online. Illustrations reproduced with permission of Lynx Edicions. s.e, standard error.
The divergence and maintenance of P. nigripes and P. immutabilis as separate species is intriguing given their sympatric distribution and highly overlapping breeding range and timing, as well as the observation of hybrids (Rohwer et al. 2014). Plumage color likely contributes to maintaining a strong barrier of interspecific gene flow between P. nigripes and P. immutabilis through its probable role in species recognition and mate choice (Fisher 1972; Uy et al. 2009). Albatrosses perform complex courtship behaviors (supplementary fig. S1C, Supplementary Material online) where body coloration plays a noticeable role (Fisher 1972). Whole-body melanism, as seen in P. nigripes, is usually attributed to mutations in the MC1R gene, which encodes the melanocortin-1 receptor involved in melanin synthesis, and can lead to reproductive isolation in some cases (Mundy et al. 2004). We identified two fixed amino acid differences in the MC1R gene between P. nigripes and P. immutabilis (supplementary fig. S8, Supplementary Material online), but which only involve amino acids with similar properties, suggesting such differences might not be adaptive. There was also no signal of positive selection detected for MC1R. However, we cannot rule out the possibility that the plumage color differences are due to mutations in regulatory regions of MC1R or other melanogenesis genes, given that juvenile P. albatrus have black plumage and contour feathers that are slowly replaced with white to attain full adult plumage (Bretagnolle 1993).
Although hybrids (Fisher 1972) and forced copulations (Rohwer et al. 2014) are known, hybrids are rare and no record of successful breeding of hybrids exists. Consistent with this observation, the influence of interspecific gene flow at the genomic level is minimal, given the high overall genomic divergence between the two species. Barriers to gene flow, which could be both behavioral and ecological, appear effective in maintaining the genomic divergence between these two sympatric species.
Population Fluctuation and Climate Change
The demographic histories inferred by the pairwise sequentially Markovian coalescent (PSMC) method (fig. 4A), which exhibits great accuracy and precision among demographic history inference approaches (Patton et al. 2019), showed that the effective population size of all four North Pacific albatross species, plus the outgroup wandering albatross (D. exulans), decreased from 100–300k to less than 50k after entering the Pleistocene (2.6 Ma). The population sizes of all four species remained low until the Last Glacial Period (LGP), then began to rise after the LGP, with the population sizes of all but P. nigripes and P. irrorata increasing more than 10-fold. A similar demographic history was supported by the three-change model of ∂a∂i (supplementary table S5, Supplementary Material online). These increases in population size coincided with decreases in global temperature and sea level (fig. 4A). Ecological niche models suggest that there was greater coastal area suitable as breeding sites for P. nigripes and P. immutabilis in both Hawaii and the Western Pacific (fig. 5A and supplementary figs. S9 and S10, Supplementary Material online) as well as many islands south of their current distribution (supplementary figs. S11 and S12, Supplementary Material online) during the Last Glacial Maximum (LGM), when sea level reached a minimum (fig. 4A) and when populations of P. nigripes peaked. Sea levels then increased rapidly after the LGM, and populations of P. nigripes decreased along with suitable breeding sites (supplementary figs. S9–S12, Supplementary Material online). Sea level changes likely pose a more serious threat to species like P. nigripes that breed on sandy beaches very close to the sea (Fisher 1972) than to other albatross species such as P. immutabilis that breed in island interiors, a scenario consistent with the population decline of P. nigripes after the LGM (fig. 4A). Sea levels, which are tightly associated with global warming and cooling (fig. 4A), therefore seem to be an important correlate of the population size of albatrosses. Indeed, fossil data suggest that Cenozoic changes in sea level and marine circulation systems likely extirpated albatross populations in the Northern Hemisphere (Olson and Hearty 2003; Mayr and Goedert 2017).
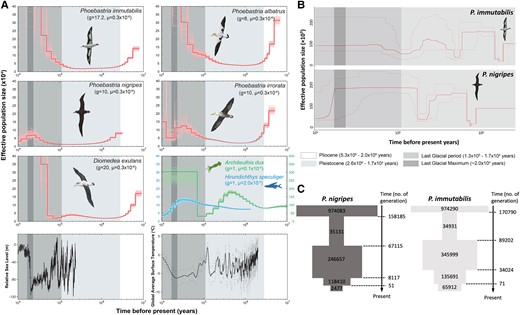
Demographic history of tropical albatrosses. (A) Demographic history of five albatrosses (Phoebastria nigripes, P. immutabilis, P. albatrus, P. irrorata, and Diomedea exulans), Architeuthis dux, and Hirundichthys speculiger revealed by PSMC. Lines in lighter color indicate the 100 bootstraps. Relative sea level (Grant et al. 2014) and global average surface temperature (Snyder 2016) of the corresponding periods are also shown. Refer to (B) for periods indicated by the gray areas. (B) Demographic history of P. nigripes and P. immutabilis inferred using Stairway plots. Solid lines shows median estimates of Ne, whereas thin lines indicate upper and lower bounds of 95% confidence intervals from 200 bootstrap replicates. (C) Demographic history of P. nigripes and P. immutabilis reconstructed by fastsimcoal2 (see supplementary fig. S13, Supplementary Material online for details). Numbers inside rectangles represent effective population size. Generation number and population size are not to scale. Illustrations reproduced with permission of Lynx Edicions. g, generation time; μ, mutation rate.
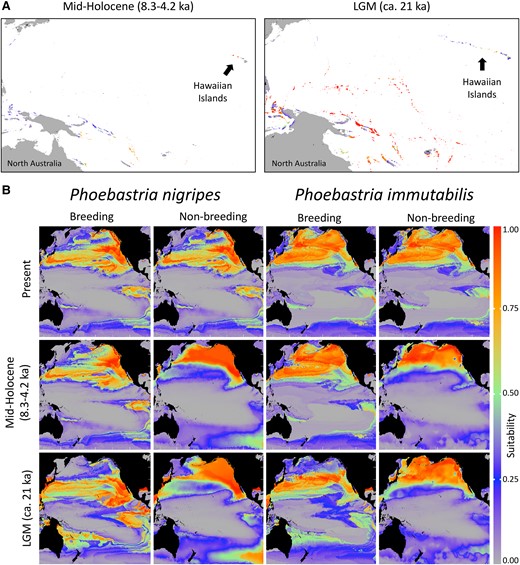
SDMs of tropical albatrosses. (A) Reconstruction of ecological niche models for Phoebastria nigripes breeding sites in the North Pacific at LGM and mid-Holocene. See (B) for suitability color scale. See supplementary figures S9 and S10, Supplementary Material online for details. (B) Reconstruction of ecological niche models for P. nigripes and P. immutabilis in the present, mid-Holocene (approximately 8.3–4.2 Ka), and LGM (approximately 21 Ka) periods. Higher probability of suitable condition is indicated by warmer colors.
Demographic histories for P. nigripes and P. immutabilis inferred using site frequency spectrum (SFS)–based methods also reveal large population fluctuations (fig. 4B–C), with a strong bottleneck in the mid-Pleistocene. Population sizes for both species then increased after entering the LGP and stayed relatively stable for P. immutabilis but declined rapidly for P. nigripes after the LGM (fig. 4B). Similar to the PSMC results, both SFS-based methods inferred an obvious recent decline and small effective population size for P. nigripes (fig. 4B–C), which was likely due to bigger impacts of sea level changes on P. nigripes breeding sites. Although both Stairway plot and fastsimcoal2 indicated past bottlenecks, the results were inconsistent between the two approaches, with three bottlenecks inferred by Stairway plot but only two by fastsimcoal2. The incongruence was probably due to the simplicity of the fastsimcoal2 models (supplementary fig. S13, Supplementary Material online) (de Pedro et al. 2021); therefore, the fastsimcoal2 results should be interpreted with caution.
Climate change also affects the distributional ranges of the albatrosses. Ecological niche models show that P. nigripes is predicted to have had a more southerly oceanic range for the breeding season during the LGM (fig. 5B), reaching the coast of the Philippines. This more southerly range could have encompassed islands lying just beyond the current distribution of P. nigripes due to the lower sea level in the LGM (supplementary figs. S11 and S12, Supplementary Material online), which could have increased the available breeding habitat for this species and hence explain the larger population size during that period. There was a predicted loss of suitable range in the North Pacific during the nonbreeding season from the LGM to the present (fig. 5B), coinciding with a decrease in population size. For P. immutabilis, the suitable nonbreeding range did not show obvious changes since the LGM, but the breeding season range underwent a predicted expansion in the northern North Pacific (fig. 5B). P. immutabilis was therefore less impacted by climate change in terms of suitable habitat availability during this period than P. nigripes.
Population sizes of albatrosses could also be greatly affected by food availability. The major diet component of P. nigripes is flying fish eggs (Exocoetidae [Harrison et al. 1983; Cherel and Klages 1998]), whereas squid (Decapodiformes) comprise that of P. immutabilis (Harrison et al. 1983; Cherel and Klages 1998). We therefore also investigated the demographic history of two representative prey species: the mirrorwing flying fish (Hirundichthys speculiger) and an oceanic squid (Architeuthis dux; fig. 4A). Patterns of population fluctuation of H. speculiger mirror that of P. nigripes, with both the predator and prey increasing in population size after entering the LGP, but later showing a decline. In contrast, the squid underwent a population expansion at the beginning of the LGP that coincided with the increase in population size of P. immutabilis and other albatross species but was not followed by a decline as in H. speculiger. Whether the similar demographic histories of tropical albatrosses and their major prey were linked indirectly by parallel responses to climate change or directly remains an open question.
Low Genome-wide Diversity and Lack of MHC Polymorphism
Genetic diversity can have a significant effect on the survival and fitness of organisms and is important for species to adapt to a changing environment (Steiner et al. 2013). The mean global genetic diversity (π) of the two North Pacific albatrosses was relatively low, ranging from 0.0008 in P. nigripes to 0.0009 in P. immutabilis, similar to other threatened species (fig. 6A and supplementary fig. S3, Supplementary Material online) and confirming earlier reports for P. nigripes based on ddRAD-seq (Dierickx et al. 2015). Both species showed low levels of inbreeding (F < 0.09; fig. 6B) and genetic relatedness (< 0.03; fig. 6C and D). The short runs of homozygosity (ROHs; mostly < 500 kb; fig. 6E and F) suggest only ancient inbreeding events. P. nigripes, which has a smaller effective and census population size and a more pronounced recent population decline, showed lower genetic diversity, higher relatedness, a higher inbreeding coefficient, more and longer ROHs, and higher levels of linkage disequilibrium (LD) than P. immutabilis (fig. 6A–G), suggesting that past climate-driven fluctuations in effective population size (fig. 4) can impact current genetic diversity. In addition to a reduced genetic diversity, small population size and bottlenecks may also lead to accumulation of deleterious mutations (Grossen et al. 2020). P. nigripes and P. immutabilis carried a similar number of highly deleterious variants (0.001% of SNPs; supplementary table S6Aand fig. S14, Supplementary Material online), with the majority being a stop-gain mutation (supplementary table S6B, Supplementary Material online). However, P. nigripes had more moderate impact variants (0.04% vs. 0.03%; supplementary table S6Aand fig. S14, Supplementary Material online), whereas P. immutabilis carried more low impact variants (0.06% vs. 0.05%; supplementary table S6Aand fig. S14, Supplementary Material online). Hence, P. nigripes that had a smaller population relative to P. immutabilis showed an accumulation of more moderately deleterious variants due to genetic drift.
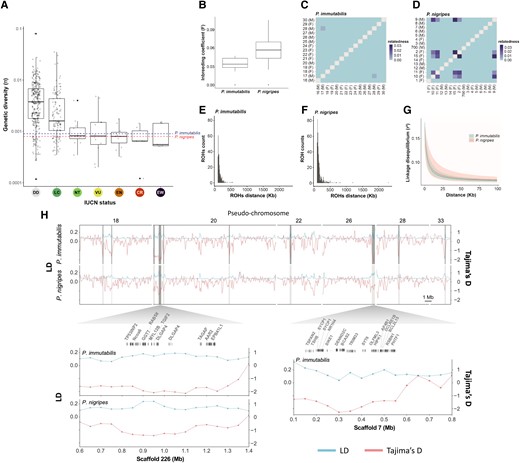
Genetic diversity (π), inbreeding coefficients, genetic relatedness, ROHs distribution, LD, and selective sweeps of Phoebastria immutabilis and P. nigripes. (A) Genetic diversity (π) assessed across species of different IUCN categories. Genetic diversity data are adopted from Robinson et al. (2016). The genetic diversities estimated for P. immutabilis and P. nigripes are highlighted by horizontal dotted lines. Both albatross species are currently classified as near threatened. (B) Inbreeding coefficient of P. immutabilis and P. nigripes. Genetic relatedness among pairwise individuals of (C) P. immutabilis and (D) P. nigripes. Distribution of ROHs for (E) P. immutabilis and (F) P. nigripes based on unlinked SNPs, with minimum windows sizes of 50 SNPs and 1 kb, allowing for five missing sites and five heterozygous sites. (G) LD decay based on the r2 index. (H) Signal of selective sweep in P. immutabilis and P. nigripes. Each genome was scanned for regions with outliers of high LD and low Tajima's D, along sliding-windows of 100 kb size and 50 kb step. The LD (upper blue lines) and Tajima's D (lower red lines) values are shown on the left and right y-axes, respectively. Pseudochromosomes (top panel) and scaffolds (bottom panel) are shown on the x-axis. Only pseudochromosomes 18, 20, 22, 26, 28, and 33 are shown here. Candidate genomic windows with signature of selective sweeps are highlighted in dark gray. The largest candidate windows (300–450 kb), located on scaffolds 7 and 226, are shown in detail with their gene content. Positions on the scaffold are shown on the y-axis. DD, data deficient; LC, least concern; NT, near threatened; VU, vulnerable; EN, endangered; CR, critically endangered; EW, extinct in the wild.
MHC genes, which are important for pathogen resistance and hence survival (Steiner et al. 2013), showed extremely low diversity in albatrosses, with only one to three alleles identified for duplicated MHC IIβ (DAB2) genes (supplementary table S7, Supplementary Material online). Individuals of P. nigripes, P. immutabilis, and D. exulans only carried one to two alleles for the two loci, and alleles within a species differed by only one to two nucleotides, whereas there was no polymorphism in the critically endangered P. irrorata. The diversity of MHC genes is usually maintained by balancing selection, and in some species is maintained at high levels despite depletion of genomic diversity outside of the MHC region (Aguilar et al. 2004). Demographic factors are not the only possible explanation for the low MHC diversity in albatrosses. The high similarity of the two DAB2 genes and almost identical alleles suggests that gene conversion could have homogenized MHC gene duplicates and eliminated variation, leading to both intraspecific similarity and divergence between species (supplementary figs. S15 and S16, Supplementary Material online) (Nei and Rooney 2005; Sin et al. 2012). However, another procellariiform seabird, Oceanodroma leucorhoa, with a much larger census size but still low effective population size (Sin et al. 2021) exhibits considerable genetic diversity at its MHC IIβ loci (Dearborn et al. 2016; Hoover et al. 2018). The low MHC diversity in tropical and wandering albatrosses could therefore be unique to this group of seabirds. As the high diversity of the MHC is crucial for disease resistance, survival (Spurgin and Richardson 2010; Sin et al. 2014), and mate choice (Hoover et al. 2018) especially in a changing environment where new diseases may arise quickly (Weimerskirch 2004; Tompkins et al. 2017; Schoombie et al. 2018; Uhart et al. 2018; Jaeger et al. 2020), the lack of MHC diversity is concerning.
Candidate Genes for Adaptation
Genomic scanning for signatures of selective sweeps highlighted several candidate regions potentially under selection (fig. 6H and supplementary fig. S17, Supplementary Material online; SEM S1, Supplementary material online). The two largest regions showing such a pattern were located on pseudochromosomes 20 and 26 (fig. 6H). Enrichment analysis of the candidate genes identified significant enrichment in P. immutabilis for “regulation of tumor necrosis factor-mediated signaling pathway” function, and in P. nigripes for 11 biological processes and 1 stress response (SEM S1, Supplementary material online). The selective sweep regions also contained candidate genes that may be involved in adaptation to hyperosmotic environments (Frings and Frings 1959) (fig. 4H and supplementary table S8, Supplementary Material online). Both MYL12B and CDC42EP3 are important genes for the modification of cytoskeleton and maintenance of cell structure and volume under osmotic stress (supplementary table S8, Supplementary Material online; Hirsch et al. 2001; Lewis et al. 2002; Park et al. 2011; Stewart et al. 2011; Mosaliganti et al. 2019). Many cytoskeleton-related genes are regulated when aquatic species acclimate to osmotic shock (Di Ciano-Oliveira et al. 2006; Whitehead et al. 2011). In birds, research on tidal marsh sparrows is the only study revealing potential salinity tolerance genes (Walsh et al. 2018; Walsh, Benham et al. 2019; Walsh, Clucas et al. 2019), including CDC42, which is upstream of the CDC42EP3 identified here and is also important for cytoskeleton organization (Lewis et al. 2002).
Candidate genes linked to telomere protection and neuronal development and plasticity were also likely under selection, with genes DCLRE1B (aka. Apollo), DLGAP4, SYT6, TSPAN2, CPNE1, and CARF identified in regions of selective sweeps (fig. 6H and supplementary table S8, Supplementary Material online; SEM S1, Supplementary material online), indicating possible selection for longevity (Lenain et al. 2006; van Overbeek and de Lange 2006; Touzot et al. 2010; Ye et al. 2010), cognition, memory, and behavioral plasticity (Tao et al. 2002; Park et al. 2012; de Monasterio-Schrader et al. 2013; Wong et al. 2015; Rasmussen et al. 2017) in albatrosses. A recent study on food-caching birds revealed genes associated with hippocampal development and function under selection, likely for better spatial learning and memory to survive harsh winters (Branch et al. 2022). Spatial cognitive ability and memory are critical for albatrosses foraging over the open oceans (Bonadonna et al. 2005; Collet and Weimerskirch 2020). Natural selection on genes of relevance to cognition highlights the importance of cognition and memory in the life histories of albatrosses. This study provides a list of potential genes under selection in the albatrosses, and more detailed analyses of selection on the albatross genomes should be performed in the future to understand their adaptations to the pelagic lifestyle.
Conclusions
Our results provide an important contribution to understand factors affecting the demographic histories and conservation of tropical oceanic seabirds, which are top predators in many marine ecosystems. Albatross population fluctuations are associated with past climate changes that drove sea level fluctuations and attendant breeding site availability, a relationship reflected in the recent loss of breeding areas due to increasing sea levels and tsunamis (Reynolds et al. 2015, 2017). Concordant population trends of the wandering and tropical albatrosses suggest widespread underlying factor(s) affecting albatrosses in both North Pacific and Southern oceans. Their low genetic diversity is also alarming, because climate in the Anthropocene may change at a rate much faster than the natural fluctuations species have historically experienced. Given the long generation times and low reproductive rates of albatrosses, together with the multiple environmental threats they face (Vo et al. 2011; Beal et al. 2021), we advocate future conservation plans to take genetic diversity into account to preserve the evolutionary potential and resilience of these species and to inform translocation efforts, such as those establishing new colonies on offshore Mexican islands (Ortega 2021). Our study also provides evidence for the genetic basis of adaptation to the marine environment in seabirds, laying the foundation for study of evolutionary processes of marine species derived from terrestrial ancestors.
Materials and Methods
Sample Collection and DNA Extraction
For de novo genome assembly, we used samples from a single individual of each of the four North Pacific albatross species (P. nigripes, P. immutabilis, P. irrorata, and P. albatrus), plus an outgroup species (D. exulans; supplementary table S1, Supplementary Material online). Blood samples were collected for P. nigripes, P. immutabilis, and P. irrorata. Tissue samples of P. albatrus and D. exulans were provided by the Burke Museum. For resequencing analyses, blood samples were collected for 15 individuals of P. immutabilis from Tern Island, and 5 or 6 individuals of P. nigripes from each of Tern, Midway, and Torishima islands, for a total of 16 P. nigripes individuals (supplementary table S1, Supplementary Material online). For MHC genotyping, blood samples were collected for 39, 10, and 16 individuals of P. nigripes, P. immutabilis, and P. irrorata, respectively, and tissue samples for 7 individuals of D. exulans were provided by the Burke Museum (SEM S2, Supplementary material online).
Blood samples were stored in Queen's lysis buffer and kept at −20 °C until DNA extraction. Genomic DNA was extracted using DNeasy Blood & Tissue Kit (Qiagen, Hilden, Germany) following the manufacturer's protocol. We confirmed the sex of the individual using published polymerase chain reaction (PCR) primers targeting CHD1 genes (2550F and 2718R) (Fridolfsson and Ellegren 1999) and measured DNA concentration with a Qubit dsDNA HS Assay Kit (Invitrogen, Carlsbad, CA).
DNA Library Preparation for Whole-genome Sequencing
For whole-genome sequencing and assembly, we followed the optimized protocol for avian genome sequencing and assembly from Grayson et al. (2017) and Sin et al. (2020). In brief, we prepared a 3 kb mate-pair library and a 220 bp fragment library for each of the five albatross species using the Nextera Mate Pair Sample Preparation Kit (cat. No. FC-132-1001, Illumina) and the PrepX Complete ILMN 32i DNA Library Kit (TaKaRa), respectively. The libraries were sequenced on Illumina HiSeq 2500 (High Output 250 kit, PE 125 bp reads) to achieve ∼30 × coverage per library.
For whole-genome resequencing, the extracted DNA was sheared to targeted size using Covaris S220 and used to prepare 320 bp fragment libraries with the PrepX Complete ILMN 32i DNA Library Kit (TaKaRa). The library qualities were assessed using the High Sensitivity D1000 ScreenTape for the Tapestation (Agilent). The libraries were quantified with quantitative PCR (qPCR; KAPA library quantification kit) and then multiplexed in equimolar ratio for sequencing on Illumina HiSeq 2500 at low coverage (∼5×). Sequencing data quality was assessed using FastQC v.0.11.9 (Andrews 2010). High-throughput sequencing of the five albatross species yielded a total of 771,696,538 paired-end reads and 806,760,752 mate-pair reads with an average coverage of 30 × for whole-genome assembly. The resequencing of 30 individuals resulted in 799,904,028 paired-end reads with an expected 5 × coverage.
Whole-genome Analyses
Genome Assembly and Annotation
Adapters of sequencing data were removed using Trimmomatic (Bolger et al. 2014). Genomes were then assembled using AllPaths-LG v52488 (Gnerre et al. 2011), and the assemblies completeness was estimated using BUSCO v2.0 (Simão et al. 2015). Syntenic alignment of the scaffolds was performed against the chicken genome (GRCg6a assembly), with 98–99.8% of the total draft genome length that could map to the chicken reference and reordered to form pseudochromosomes. Some scaffolds exhibited 2-fold lower coverage among female individuals than in male individuals, supporting them as sex-linked. By combining Satsuma and MUMmer, a total of 346 sex-linked scaffolds—accounting for ∼ 6.97% of the P. nigripes draft genome—were identified and further excluded from downstream analyses.
Genome annotation was performed following Sin et al. (2022) using MAKER2 (Holt and Yandell 2011). A custom repeat library created with Repeat Modeler 1.0.10, protein databases from other vertebrates (n = 16), and gene predictions from the genome of chicken (G. gallus) were used for the annotation. The putative functions of the annotated genes were identified using the UniProt/SwissProt protein database and BLAST 2.2.31 + blastp from NCBI and combined with InterProScan v.5.36-75.0.
Whole-genome Resequencing Data Preprocessing
Adapters of resequencing data were removed using Trimmomatic (Bolger et al. 2014). Sex-linked scaffolds were identified by combining results from the whole-genome synteny aligners MUMmer 3.0 (Kurtz et al. 2004) and Satsuma v3.1.0 (Grabherr et al. 2010) and by comparing read coverage ratio of the scaffolds between male and female samples using samtools idxstats (Li et al. 2009) on realigned BAM files (see below). The chicken genome (GRCg6a assembly, Warren et al. 2017) was used as reference for MUMmer and Satsuma analyses. Scaffolds having the longest summed hits on a reference chromosome were identified to that chromosome. Scaffolds identified as sex-linked in both MUMmer and Satsuma analyses were excluded from downstream analyses, as well as scaffolds showing a male/female coverage ratio greater than 1.5.
Phylogenomic Analyses
The phylogenetic relationships among the five albatross species were assessed using their mitochondrial genomes and four different types of nuclear markers: 1) exons and introns of orthologs, 2) ultra-conserved elements (UCEs), and 3) single-nucleotide polymorphisms (SNPs). Genome-wide SNPs provide a large amount of information to resolve difficult and/or shallow species phylogenies (Leaché and Oaks 2017), whereas UCEs are useful markers to resolve phylogenomic relationships at multiple scales (McCormack et al. 2012). The use of exons and introns may also provide contrasting information at broad phylogenetic scales as they exhibit different evolutionary rates and may be under variable selective pressure (Chojnowski et al. 2008; Zhan et al. 2015).
To extract exonic and intronic regions from coding genes, the reciprocal best hits (RBHs) method was used as a proxy to identify orthologous sequences from the translated proteins inferred by MAKER2. For each species pair, protein sequences were reciprocally blasted using BLAST 2.2.31 + blastp (Coulouris et al. 2008), each species serving in turn as a database for the other species, with an Expect value (E) of 10. Two protein sequences were considered as orthologous if they were reciprocally found as their best BLAST hits. After putative orthologous proteins between all albatross species were identified, we extracted their genomic sequences based on their respective annotation files. For each species, we concatenated the corresponding exonic and intronic nucleotide regions separately. Concatenated exons were then aligned using MACSE v2.03 (Ranwez et al. 2011), a software that aligns coding nucleotide sequences with regard to the reading frame of their amino-acid translations. Parameters were left as default except for -gap_op_term = 7.0 and -gap_ext_term = 1.0. Concatenated introns were aligned with MAFFT v7.149b (Katoh et al. 2002) with –auto and –adjustdirection options and opening gap penalty –op = 2. Local alignments were further trimmed at both ends and filtered for very gappy sites, that is sites for which most individuals showed a gap, using trimAl (Capella-Gutiérrez et al. 2009) with -resoverlap = 0.75 and -seqoverlap = 30, and global pairwise identity below 0.001 (i.e., nearly identical sequences) were removed. Finally, species phylogenies based on either exons (n = 12,417) or introns (n = 11,525) were inferred using ParGenes, a tool that combines a suite of softwares to simultaneously determine best-fit models and infer maximum-likelikhood (ML) phylogenies in a massively parallel fashion (Morel et al. 2019). ParGenes v.1.1.2 first used ModelTest-NG (Darriba, et al. 2020) to find the best nucleotide substitution model for each gene, which is then used by RAxML-NG v.0.9.0git (Kozlov et al. 2019) to infer ML gene trees. The resulting gene trees were then all rooted on D. exulans and ultimately passed to MP-EST 2.0 (Liu, et al. 2010) to infer the species tree. The node supports were estimated from MP-EST runs based on 100 MP-EST bootstrapped species trees (Cloutier et al. 2019).
To identify the UCEs in our albatross genomes, we used the UCE sequences previously identified in the Avian Phylogenomics Project (Jarvis et al. 2014) to blast against the albatross genomes. Here, we used BLAST + blastn for the RBH method, between the albatross species and four distant outgroups among the ones investigated in the Avian Phylogenomics Project: Fulmarus glacialis, Eurypyga helias, Gavia stellata, and G. gallus. UCE markers were kept if the best hits identified by BLAST were reciprocally the same for any pairwise species comparison. Retained UCEs (n = 3,660) were then locally aligned with MAFFT as above before being trimmed for gaps using trimAl v1.4 with -automated1 option. Cleaned alignments were then similarly processed by ParGenes and MP-EST to infer the UCE-based species phylogeny.
To infer the SNP-based species phylogeny, we first merged and filtered the raw paired-end reads of the samples used for genome assemblies following the Genome Analysis Toolkit (GATK v3.8) best practices workflow (Van der Auwera et al. 2013). Adapters were trimmed with NGmerge v0.3 (Gaspar 2018) and Picard Tools v2.20.6 (Toolkit 2019) before reads were aligned onto the P. nigripes draft genome using BWA-MEM v.0.7.13 (Li and Durbin 2009), generating BAM files that were then merged and marked for adaptors using Picard Tools. The alignment rate of all species was equally high (supplementary table S2, Supplementary Material online). Reads were further realigned around indels using GATK IndelRealigner before running an initial variant calling with HaplotypeCaller and GenotypeGVCFs (Poplin et al. 2018). We then applied a base quality score recalibration procedure on SNPs and indels, using these initial variant calls as true sets of variants following GATK best practices for nonmodel organisms. The recalibrated BAM files were then ready-to-analyze and passed to ANGSD v0.921 (Korneliussen et al. 2014) for final SNP calling, with the following parameters: -remove bads 1 -trim 0 -minMapQ 20 -minQ 20 -uniqueOnly 1 -only_proper_pairs 0 -baq 1 -C 50 -doMaf 1 -doMajorMinor 1 -skipTriAllelic -doCounts 1 -minMaf 0.05 -SNP_pval 1e-6 -setMinDepth 5 -maxDepth 290 -doDepth 1 -dumpCounts 2 -doGeno 3 -doPost 1 -GL 1. BAQ computation (-baq 1) have proven to greatly reduce false SNP calls around misaligned indels (Li 2011). Species phylogeny was inferred based on 1,010,476 genome-wide SNPs using the SNAPP package (Bryant et al. 2012) implemented in BEAST2 (Bouckaert et al. 2019), for 1 million Monte Carlo Markov Chain (MCMC) generations after a burn-in of 100,000 MCMC generations and with trees sampled every 10,000 generations. Analysis convergence was checked in Tracer v1.6 (Rambaut et al. 2014) and trees summarized by TreeAnnotator v.2.6.0 (provided with BEAST2) and visualized in FigTree v1.4.3.
To compare with the species phylogeny inferred from nuclear markers and detect potential hybridization events, we assembled the mitochondrial genome of the five albatross species and the 30 resequenced individuals of P. nigripes (N = 15) and P. immutabilis (N = 15) using the whole-genome sequencing data. The assembly of the mitochondrial genomes was performed following the two-step procedure of MITObim v1.7 (Hahn et al. 2013), which consists of an initial mapping assembly using MIRA 4 (Chevreux et al. 2004) followed by a baiting and iterative mapping with MITObim of the raw reads onto the generated de novo assembly. The chicken mitochondrial genome (GRCg6a assembly) was used as a reference for the assembly. For the five individuals sequenced to high-depth, the mate-pair libraries were also used to improve the initial mapping with MIRA, with a subset of 20 M reads for both fragment and mate-pair libraries. After trimming reads from adapters, using Trimmomatic v0.38 (Bolger et al. 2014) for high-coverage samples and NGmerge (Gaspar 2018) for resequenced samples, reads were quality filtered using fastp v0.20.1 (Chen et al. 2018). Phylogenetic inferences of the assembled mitochondrial genomes (supplementary table S2, Supplementary Material online) were then performed by RAxML-NG (Kozlov et al. 2019) with 100 bootstraps.
Demographic History Analyses
The demographic history of the five albatross species was inferred from the same samples used for the whole-genome assembly using the pairwise sequentially Markovian coalescent (PSMC) method (Li and Durbin 2011), which infers past changes of the effective population sizes (Ne) of a species/population based on the whole-genome sequence information of a single individual. After trimming adapters with Trimmomatic (Bolger et al. 2014), reads were mapped onto their respective species draft genome using BWA-MEM (Li and Durbin 2009). Duplicate reads were removed and variants called using samtools mpileup with base (-q) and mapping quality (-Q) of 30, and minimum (-d) and maximum (-D) read depth of 20 and 150, respectively. The PSMC analyses were conducted using an atomic time interval of “4 + 30×2 + 4 + 6 + 10” and a mutation rate (μ) of 2.89 × 10⁻⁹ per site per generation (based on the mutation rate of another procellariiform species, the northern fulmar F. glacialis) following Nadachowska-Brzyska et al. (2015), given the mutation rate of albatross is not known. Although in the same avian order, attention should be paid that the mutation rate of the northern fulmar might not be representative of that of albatrosses. However, mutation rate bias do not change the PSMC curve shape but only move the curve along the axes (Nadachowska-Brzyska et al. 2015). The generation time was estimated for each species as two times the age of sexual maturity (Nadachowska-Brzyska et al. 2015). Sexual maturity information was from the Animal Ageing and Longevity Database (http://genomics.senescence.info). Bootstrapping was performed following github.com/lh3/psmc.
In addition to PSMC, we used complementary approaches to infer the demographic histories as each method performs best at different time scales. Although PSMC performs better at inferring relatively ancient demographic histories (Li and Durbin 2011; Liu and Fu 2015; Terhorst et al. 2017), methods dependent on the SFS perform better at inferring relatively recent demographic histories (Liu and Fu 2015; Terhorst and Song 2015; Lapierre et al. 2017). We therefore used the Stairway plot method (Liu and Fu 2015; Lapierre et al. 2017), which is a model-flexible approach and can infer effective population size changes over time by maximizing the composite likelihood of the SFS profile. Stairway plot was reported to be more sensitive to recent demographic events than fastsimcoal2 (Miao et al. 2021). We used this method to analyze the demographic histories of P. nigripes and P. immutabilis, for which we calculated the unfold SFS profiles (supplementary fig. S18, Supplementary Material online) using the resequenced samples (see Population structure and genetic diversity analyses). We ran the Stairway plot analyses for each species using the two-epoch model, with 67% sites sampled for training as recommended and for 200 bootstraps, and singletons excluded. We also assessed the goodness-of-fit of various predefined demographic models to the observed unfolded SFS using and the fast sequential markov coalescent (fastsimcoal2) (Excoffier et al. 2013) and the diffusion approximation for demographic inference (∂a∂i) (Gutenkunst et al. 2009). The same estimates of mutation rates and generation time as for the PSMC were used. Four demographic models were tested in ∂a∂i v2.1.0 with increasing scenario complexity: constant model, one-change model, and “two-change” and “three-change” models following Dierickx et al. (2020), with the same optimization parameters run from 10 to 50 times and singletons excluded. Since at least one bottleneck was inferred with PSMC and Stairway plot for both P. nigripes and P. immutabilis, six models were run with fastsimcoal2 ver 2.6.0.3 : “constant population size,” “population expansion,” “1 bottleneck event,” “1 bottleneck event followed by expansion,” “2 bottleneck events,” and “2 bottleneck events followed by expansion.” Each model was run 100 times each with 500,000 simulations and Brent tolerance threshold of 0.01, and singletons excluded. The best-fit demographic scenario was chosen based on the lowest AIC calculated using the script calculateAIC.sh, and the demographic parameter values were estimated from the best run using the script fsc-selectbestrun.sh (both scripts from https://github.com/speciationgenomics/scripts). To estimate the confidence intervals of the inferred demographic parameters, nonparametric bootstrapping was done for the best model using 100 bootstrapped SFSs with 10 iterations each, and values of the best fastsimcoal2 run were used as starting values for parameter optimization. The 95% confidence intervals were then computed for each parameter from the 100 best runs (one for each bootstrapped SFS) using the percentile method as implemented in the R package boot (Ripley 2021).
In addition, we used fastsimcoal2 to estimate the divergence time and levels of gene flow between P. immutabilis and P. nigripes along with the demographic history using their joint SFS inferred in ANGSD. Six demographic models were tested: “constant model with no gene flow,” “constant model with ongoing gene flow,” “ancient bottleneck before divergence with no gene flow,” “ancient bottleneck before divergence with gene flow,” “recent independent bottleneck in both species with no gene flow,” and “recent independent bottleneck in both species with gene flow.” The best model assessment and nonparametric bootstrapping were done as described above.
Demographic histories of the main prey of P. nigripes and P. immutabilis—flying fish and squid—were also inferred using PSMC. The draft genomes and whole-genome sequencing data were available for the mirrorwing flying fish (H. speculiger) (Xu et al. 2021), whose eggs are the major diet of P. nigripes (Harrison et al. 1983; Cherel and Klages 1998). Squids (Decapodiformes) are the main prey of P. immutabilis, and we inferred the demographic history of A. dux, which is the only squid with a draft genome available (Da Fonseca et al. 2020). It is an oceanic squid that has a distribution range overlapped with many other Pacific oceanic squids, and the knowledge of its demographic history would therefore inform us the possible demographic histories of other Pacific oceanic squids. For H. speculiger, we performed PSMC with the atomic time interval of “4 + 10×1 + 20×2 + 4 + 6” (Li et al. 2021), mutation rate (μ) of 2 × 10⁻⁸ per site per generation, and generation time of 1 year (Lewallen et al. 2016). For A. dux, we performed PSMC with the atomic time interval of “4 + 25×2 + 4 + 6,” mutation rate (μ) of 0.1 × 10⁻⁸ per site per generation, and generation time of 1 year (Winkelmann et al. 2013).
Population Structure and Genetic Diversity Analyses
Analyses of population structure and genetic diversity of P. nigripes and P. immutabilis were performed using the recalibrated BAM files. We first assessed the existing genetic clusters within and among species by calling the genotypes in ANGSD with the following filters: -remove_bads 1 -trim 0 -minMapQ 20 -minQ 20 -uniqueOnly 1 -only_proper_pairs 0 -skipTriallelic 1 -minInd 7 -setMinDepth 7 -setMaxDepth 260 -minmaf 0.05 -SNP_pval 1e-6, and these parameters: -baq 1 -C 50 -doCounts 1 -doMajorMinor 1 -GL 1-doGeno 32. The called genotypes were then used by ngsCovar, a tool from ngsTools package (Fumagalli et al. 2014), to generate a covariance matrix from which a principal component analysis (PCA) was performed in R. The population structure was inferred on the same called variants in STRUCTURE v2.3.4 (Pritchard et al. 2000), using the admixture model to assess the level of introgression among the genetic clusters (K). We tested from K = 1 to K = 10 for 10,000 MCMC generations, 1,000 burn-in, and 10 iterations. The best K was chosen based on the deltaK from Evanno et al. (2005) method, which is based on the second order rate of change of the likelihood Ln P(D) between each K (called deltaK). The number of K for which the deltaK is maximized was considered as the best K. We note that the Evanno method cannot identify a single cluster as a superior model to multiple clusters, leaving open the possibility that one cluster is indeed optimal.
Several metrics were used to measure the level and distribution of genetic diversity within each species, including individual inbreeding, ROHs, LD, observed heterozygosity (Ho), genetic relatedness within populations, and SFS profile. Pairwise LD was calculated using ngsLD from ngsTools package (Fumagalli et al. 2014), and the rate of LD decay was plotted over 2 Mb using the R script fit_LDdecay.R, which was provided with the ngsTools package. The level of genetic relatedness and individual inbreeding (F) were inferred using ngsRelate and ngsF from ngsTools package, respectively, based on outputs from ANGSD (see above). The number and distribution of ROHs among individuals was estimated on unlinked (i.e., LD-pruned) SNPs using PLINK v1.90b6.15 (Purcell et al. 2007) with the following parameters: –homozyg –homozyg-snp 50 –homozyg-kb 100 –homozyg-window-het 5 –homozyg-window-missing 5. Genome-wide heterozygosity was measured using the script from Dierickx et al. (2020), with sliding-windows of 100 kb length and steps of 50 kb. To estimate various diversity indices and neutrality test statistics, including the genetic diversity π and Tajima's D test (Korneliussen et al. 2013), for both P. immutabilis and P. nigripes, we first generated the site allele frequencies (SAF) using ANGSD (with -doSaf) and the unfolded SFS (i.e., containing the information of ancestral alleles) using realSFS. The two files were then used by ANGSD (with the options -doSaf 1 -doThetas 1 -pest) to generate the input file for thetaStat to compute the diversity indices and neutrality test statistics. The draft genome of P. nigripes was used as the reference genome. The ancestral genome of P. immutabilis and P. nigripes was reconstructed using the software est-sfs v2.03 (Keightley and Jackson 2018), by setting both species as ingroups, whereas the three other North Pacfic albatrosses P. albatrus, P. irrorata, and D. exulans were used as outgroup species, ordered from the most to the least closely related based on our inferred species trees. The software was designed to infer the unfolded SFS, but it also output the allelic state probabilities of each site, which we further used to reconstruct the ancestral genome sequence. The inferred ancestral genome was then used in downstream genomic and demographic analyses of the resequenced samples. The genomic divergence between P. immutabilis and P. nigripes was estimated as the global fixation index (FST) using realSFS fst from ANGSD, which uses the SAF files to compute global and sliding-windows FST, here within windows of 100 kb and steps of 50 kb. Measures of Tajima's D and of LD were compared for each sliding-window to detect genomic footprints of selective sweep, indicated by a low Tajima's D (99th percentile) along with a high LD (95th percentile), and outlier windows were identified. The genes present in the candidate windows were extracted and analyzed for gene ontology enrichment in ShinyGO v0.61 (Ge et al. 2020), using G. gallus as background gene list. In addition, we annotated SNPs for putative functional effects on genes and proteins with SnpEff v5.0, by creating and using P. nigripes genome assembly and annotations as database (Cingolani et al. 2012).
Intraspecific and Interspecific Gene Flow
To test for gene flow, we assessed the number and direction of past introgression events using TreeMix v1.12, which infers the population mixtures but also splits from genome-wide SNPs (Pickrell and Pritchard 2012). All five albatross species and resequenced P. nigripes and P. immutabilis individuals were included. TreeMix was set to simulate from 1 to 8 migrations events (-m), on blocks of 1000 SNPs (-k 1000) to account for LD, and D. exulans was used as the outgroup to root the tree (-root). The analyses were first run for 100 times for the best m to infer the best tree, which was then used as the starting tree to run for 100 bootstrap replicates (-bootstrap). In addition to TreeMix, we performed ABBA-BABA tests to detect introgression between P. nigripes and P. immutabilis. The ABBA-BABA test, also known as D-statistics, uses biallelic SNPs to test for a significant difference between ABBA and BABA sites, which indicates a signal of gene flow (Zheng and Janke 2018). Two populations of P. nigripes (i.e., Tern + Midway and Torishima) and P. immutabilis were included as ingroups H1-H3, and either P. albatrus, P. irrorata, or D. exulans was used as the outgroup species (i.e., H4). The analyses were run with ANGSD, which applied error correction for low-coverage data, with all sites or transition sites removed. The ABBA-BABA tests were run using -doAbbababa 1 on genome blocks of 1 Mb size to avoid linked dataset, using the same parameters as applied for genotype calling. The jackKnife.R script in ANGSD was performed to test for significance of ABBA-BABA statistics. A |Z| value > 3 was considered to be significant (Zheng and Janke 2018).
Species Distribution Modeling
To investigate the effect of past climate change on the demographic histories of P. immutabilis and P. nigripes, species distribution models (SDMs) were built using Maxent v3.4.4 (Phillips et al. 2006). Occurrence data of P. immutabilis and P. nigripes were downloaded from Global Biodiversity Information Facility database (GBIF.org 2021a, 2021b) and VertNet (Constable et al. 2010; VertNet 2021). Duplicated records and records located outside of current distribution range of the two species were removed. Records with high precision at approximately 1.11 km spatial resolution (i.e., coordinates with more than two decimal places) were retained. The filtered data points were then assigned to breeding (November to June) and nonbreeding season records (August to October). A subset of breeding season occurrence points that located on current breeding sites were extracted (Awkerman et al. 2020a, 2020b). This resulted in a total of three occurrence datasets for each albatross species. To avoid spatial sampling bias, randomized spatial thinning was performed on all datasets using the R package spThin (Aiello-Lammens et al. 2015) with 100 iterations. The thinning distances of data points in the ocean and data points on land were 300 and 1 km, respectively. To infer the past breeding sites of the two species, a set of SDMs based on terrestrial bioclimatic variables was constructed. Nineteen terrestrial bioclimatic variables at 2.5 arc-minute spatial resolution were obtained from the PaleoClim database (Brown, et al. 2018). SDMs of 10 time periods were constructed including present time (1979−2013), Meghalayan (4.2–0.3 Ka), Northgrippian (8.326–4.2 Ka), Greenlandian (11.7–8.326 Ka), Younger Dryas Stadial (12.9–11.7 Ka), Bølling-Allerød (14.7–12.9 Ka), Heinrich Stadial 1 (17.0–14.7 Ka), LGM (ca. 21 Ka), and Last Interglacial (ca. 130 Ka). To infer the past distribution range of the two species in the Pacific Ocean, a set of SDMs based on oceanic bioclimatic variables was also constructed. Eighteen oceanic bioclimatic variables at 5 arc-minute spatial resolution were obtained from the MARSPEC database (Sbrocco and Barber 2013; Sbrocco 2014). SDMs were constructed for three time periods: present time, Mid-Holocene (ca. 6 Ka), and LGM. All variables were cropped to the Pacific Ocean area. Highly correlated variables were removed in order to avoid multicollinearity, using the function vifstep in the R package usdm (Naimi et al. 2014) based on variance inflation factor (VIF). The VIF threshold was set to 3 for both terrestrial variables and oceanic variables. Remaining variables were filtered with the function VariableSelection from the R package MaxentVariableSelection (Jueterbock et al. 2016) to find the best combination of variables with the best performance, based on the area under the curve (AUC) statistic for each set of SDMs. The optimal model settings for the final model of each dataset were identified using the function ENMevaluate from the R package ENMeval (Muscarella et al. 2014), based on the Akaike information criterion corrected (AICc) for small sample sizes. The model feature types evaluated were “L,” “LQ,” “LQH,” “H,” “LQHP,” and “LQHPT” (L = linear, Q = quadratic, H = hinge, P = product, and T = threshold), whereas the regularization values evaluated were 0.5, 1, 1.5, 2, 2.5, 3, 3.5, and 4. Maxent models were visualized using the R package ggplot2 (Wickham 2016). All the filtering steps, model evaluation, and model visualizations were performed in R v.4.0.2 (Team 2020). Each SDM was performed in Maxent with 50 replication and 5,000 maximum iterations. The SDMs of breeding sites performed well with an average mean AUC value of 0.987, whereas average mean AUC of SDMs of distribution range was 0.881 (supplementary table S9, Supplementary Material online). Based on the model selection results, each model was constructed with different combination of variables and settings (supplementary table S10, Supplementary Material online).
MC1R Genotyping and Analyses
The MC1R gene from chicken (G. gallus; GenBank accession number: NP_001026633.1) was used as the query sequence to blast against the albatross genomes. The MC1R gene was extracted from the draft genomes and resequenced individuals of all albatrosses (supplementary table S1, Supplementary Material online), including P. nigripes (n = 16), P. immutabilis (n = 15), P. irrorata (n = 1), P. albatrus (n = 1), and D. exulans (n = 1), for alignment and identification of variants. To detect sites that were under selection, we investigated the ratio of the rate of synonymous substitutions to the rate of nonsynonymous substitutions (ω = dN/dS). We used the HyPhy package (Pond and Muse 2005) implemented in the Datamonkey webserver (datamonkey.org) to estimate ω. We used single-likelihood ancestor counting (SLAC), fixed effects likelihood (FEL), mixed effects model of evolution (MEME), fast unconstrained Bayesian AppRoximation (FUBAR), and Branch-site Unrestricted Statistical Test for Episodic Diversification methods implemented in HyPhy to infer signals of positive selection. All methods were used with default settings. We identified signals of purifying selection in codon 84, 119, 134, and 295, but not positive selection, in MC1R.
MHC Genotyping and Analyses
MHC Region Reconstruction
We identified scaffolds containing classical MHC class IIα and class IIβ genes in each of the five albatross genome assemblies using tblastn searches with translated nucleotide query sequences from chicken (G. gallus, GenBank accessions AY357253 and AB268588), thin-billed prion (Pachyptila belcheri, GenBank accessions FJ588549 and KJ162518-162528), blue petrel (Halobaena caerulea, GenBank accessions KJ162503-162505), and Leach's storm petrel (Oceanodroma leurcohoa, NCBI BioProject PRJNA776570). We also searched for genes commonly found in proximity to classical MHC class II genes (COL11A2, BRD2, TAP1, TAP2, DMA, DMB, and MHC class I genes) using translated query sequences from assembled MHC genomic regions for chicken (GenBank accession AB268588) (Shiina et al. 2007), crested ibis (Nipponia Nippon, GenBank accession KP182408) (Chen et al. 2015), and Oriental stork (Ciconia boyciana, GenBank accession LC180358) (Tsuji et al. 2017).
Misassembly across regions containing repeats, segmental duplications, or tandemly arrayed gene duplicates is well documented for de novo genome assembly of short read data, with these repetitive regions often being collapsed into a single region in the final assembly (Ramdas et al. 2019; Peona et al. 2021; Wang et al. 2021). We therefore used a read mapping and depth-of-coverage (DoC) approach to determine whether duplicated MHC class II genes in albatross might have been collapsed in the final genome assemblies. We first mapped the 220 bp fragment libraries of each albatross species to scaffold_1411 from the waved albatross (P. irrorata), which contains a single MHC classIIα/β pair flanked by COL11A2 and BRD2 genes (see supplementary fig. S19, Supplementary Material online). Reads were trimmed with Trimmomatic v. 0.32 (Bolger et al. 2014) and mapped to their respective genome with BWA v. 0.7.12 (Li and Durbin 2009). Mapped reads were then postprocessed with SAMtools v. 1.5 (Li et al. 2009) and custom Perl scripts to remove improperly mapped read pairs and to filter reads with < 50% matches to the target region. A consensus sequence was called from this initial mapping in Geneious v. 10.1.2 (www.geneious.com), and reads for each species were then remapped to its consensus sequence following the same parameters as described above. Per-site DoC was calculated for this second round of mapping using GATK v. 3.5 (Van der Auwera et al. 2013) and the average DoC across each MHC class II gene was compared with that of the flanking COL11A2 and BRD2 genes.
This first mapping trial provided evidence for collapsed MHC class II gene copies in each albatross species (see supplementary fig. S20, Supplementary Material online), so we therefore mapped reads to a reference MHC region that contained a duplicated MHC class IIα/β gene pair to further corroborate this result. We generated this reference MHC region in silico by overlapping the MHC-containing scaffolds identified for P. nigripes and then mapped the 220 bp fragment libraries of each albatross species to this reference, and then to a consensus sequence built from the first round of mapping as described above.
The MHC class II α and β genes were shown to undergo duplication in each albatross species (supplementary fig. S20, Supplementary Material online) and therefore likely originated from a single ancestral duplication event. The duplicated α and β genes are adjacent to each other, separated by only ∼1.2 kb and flanked by the COL11A2 and BRD2 genes.
MHC Class II α and β Gene Duplication Confirmation
We performed two PCRs to confirm the MHC class II α and β gene duplication (supplementary fig. S21, Supplementary Material online). The first PCR used a forward primer (MHC-F1: 5'–ACTTTATTGTGGTGAGAAAGCAGCGGA–3′) that is located at the upstream region of the first MHCIIa gene and a reverse primer (MHC-R1: 5′–AGCAGCAGTAAAGGTGGTTGG–3′) that is located at the downstream region of the first MHCIIβ gene, to amplify a region of ∼5.95 kb containing the first pair of MHC class II α and β genes. The second PCR used a forward primer (MHC-F2: 5′– GGRACCAGAYRCTCTTGGTGGCCTG–3′) that is located between the first MHCIIβ gene and second MHCIIa gene and a reverse primer (BRD2-F2: 5′– CGAGTTCAGCTACGCCAAGATGC–3′) that is located at the BRD2 gene downstream of the second MHCIIβ gene, to amplify a region of ∼8.58 kb containing the second pair of MHC class II α and β genes. Both PCR amplifications were performed in a 50 μl reaction mix that contained 0.25 μM of each primer, 0.2 μM of each dNTP, 1× PrimeSTAR GXL buffer (containing MgCl2, TaKaRa), 1.25 unit of PrimeSTAR GXL DNA polymerase (TaKaRa), and 2 μl of DNA. The PCR cycle began with six touchdown incubation cycles at 98 °C for 10 s, 68 °C to 63 °C for 15 s, and 68 °C for 6 min, followed by 30 incubation cycles at 98 °C for 10 s, 62 °C for 15 s, and 68 °C for 6 min. The long-range PCR amplifications confirmed the existence of the MHC class II gene duplicates (supplementary fig. S21, Supplementary Material online).
MHC Genotyping
The MHC genes identified in the genome assemblies showed low polymorphism, both among loci within the same species and between loci of different species. We therefore designed a pair of primers (albaMHC_b_ex2-10797F: 5′-CCTTGTCCTGTCGTCTGTCC-3′ and albaMHC_b_ex2-11783R: 5′-CTCACCTTGGGCTGAACTGG-3′) that can amplify the exon 2 of both MHC class II loci in the albatrosses. We genotyped the MHC IIβ genes of P. nigripes (n = 39), P. immutabilis (n = 10), P. irrorata (n = 16), and D. exulans (n = 7). PCR amplifications were performed in a 25 μl reaction mix that contained 0.5 μM of each primer, 0.2 μM of each dNTP, 1× PCR buffer (Qiagen), 0.75 μM of MgCl2, 1.25 μl of DMSO, 1 unit of DNA polymerase (Qiagen), and 2 μl of DNA. The PCR cycle began with 94 °C for 5 min, then 10 touchdown incubation cycles at 94 °C for 30 s, 68 °C to 58 °C for 30 s, and 72 °C for 1 min, followed by 25 incubation cycles at 94 °C for 30 s, 58 °C for 30 s, and 72 °C for 1 min, with a final extension at 72 °C for 5 min. The PCR products were sequenced using the same primers as above or the primer pair albaMHC_beta_ex2-11118F (5′-GGAGGAGAGTGGCGATGGG-3′) and albaMHC_beta_exon2-11668R (5′-CCAGAGAGGGTGCAAGGG-3′). 2, 2, 0, and 1 SNPs were identified for the exon 2 of MHC IIβ genes of P. nigripes, P. immutabilis, P. irrorata, and D. exulans, respectively. To identify individual alleles, phasing was performed for sequences showing multiple peaks using PHASE v2.1.1 (Stephens et al. 2001). The genotype of each individual is given in Supporting Electronic Material S2.
MHC Diversity
Because alleles from both MHC IIβ loci were amplified at the same time, we used several commonly employed indices (Lam et al. 2023) instead of locus-based statistics (e.g., observed heterozygosity). We used the average percentage difference (APD) to reflect the MHC diversity within a species. APD was calculated by averaging the percentage of nucleotide alleles not shared between two individuals, which does not rely on allelic frequency (Lynch 1990, 1991; Miller et al. 2010; Gillingham et al. 2017). We also used mean number of sequence per individual (MHC/Ind) to estimate MHC heterozygosity in a species; theta k () to estimate MHC allelic richness for each species; and theta Pi (; mean number of pairwise differences between all pairs of MHC alleles) to reflect nucleotide diversity of MHC in a species. Both and were calculated using Arlequin 3.1 (Excoffier and Lischer 2010).
Phylogenetic Analysis of MHC Genes
A phylogenetic tree of MHC IIβ exon 2 sequences from the albatrosses and other procellariiform seabirds was constructed using MrBayes 3.1.2 (Ronquist and Huelsenbeck 2003) to determine if there is a signal of trans-species polymorphism. Model test was first performed using JModelTest (Posada 2008) to ascertain the best-fit model of nucleotide substitution, which was identified as the K80 model with invgamma distributed rates. A MCMC sampling procedure was run for 5,000,000 generations. The mean standard deviations of split frequencies were <0.01. The first 25% of the tree samples were discarded as burn-in. The MHC IIβ sequences of albatrosses form a monophyletic clade in the phylogenetic tree (supplementary fig. S15, Supplementary Material online), where the North Pacific albatrosses form a monophyletic clade without D. exulans. The alleles from each species form their own species-specific clades.
To determine the lineage of the MHC IIβ (DAB) genes identified in the albatrosses, DAB exon 3 sequences were extracted from their genome assemblies and then aligned with those from other procellariiform species using MEGA7 (Kumar et al. 2016). The 16 lineage-specific nucleotides used to differentiate DAB1 and DAB2 genes were inferred from Goebel et al. (2017). The duplicated MHC IIβ genes all belong to the DAB2 lineage as described by Goebel et al. (2017) (supplementary fig. S22, Supplementary Material online). No DAB1 lineage genes were found in albatross, in contrast to some other procellariiform seabirds (Dearborn et al. 2016).
Selection Analysis of MHC Genes
MHC IIβ exon 2 sequences from P. nigripes, P. immutabilis, P. irrorata, and D. exulans were analyzed for signs of selection. Recombination analysis was first performed using GARD (Kosakovsky Pond et al. 2006) implemented in HyPhy (Kosakovsky Pond et al. 2019) prior to selection analyses. No recombination breakpoint was detected. We then tested for positive and purifying selection using MEME (Murrell et al. 2012), FEL (Kosakovsky Pond and Frost 2005), FUBAR (Murrell et al. 2013), and SLAC (Kosakovsky Pond and Frost 2005) implemented in HyPhy. In addition, the rates of synonymous (dS) and nonsynonymous (dN) substitutions were calculated separately for peptide-binding region (PBR) and non-PBR using HyPhy implemented in MEGA7 (Kumar et al. 2016), according to the method in Nei and Gojobori (Nei and Gojobori 1986) with Jukes and Cantor (Jukes and Cantor 1969) correction. The prior assignment of PBR and non-PBR were based on human MHC class II HLA molecules (Brown et al. 1993). A ratio ω (nonsynonymous over synonymous substitutions, dN/dS) of larger than 1 indicates positive selection. A global signature of positive selection (ω > 1) was identified in the PBR but not non-PBR (supplementary table S11, Supplementary Material online), although only one PBR residue was found to be under positive selection using site-specific tests of selection (supplementary fig. S16, Supplementary Material online).
Supplementary Material
Supplementary data are available at Molecular Biology and Evolution online.
Acknowledgments
This research was supported by the Croucher Start-up Allowance awarded to S.Y.W.S. We thank Takashi Hiraoka and University of Washington Burke Museum for providing the samples; Whitney Hansen for assistance with laboratory work; and Neil Gemmell, Tim Sackton, and members of the Sin Lab and Edwards Lab for helpful discussion. The computations were performed using research computing facilities offered by the Information Technology Services at the University of Hong Kong, and the Odyssey cluster supported by the FAS Division of Science, Research Computing Group at Harvard University.
Data Availability
All genome assemblies and sequencing data have been archived in the National Center for Biotechnology Information (NCBI) under the BioProject accession number PRJNA965798. All softwares are cited in the methods and are publicly available.
Author Contributions
Conceptualization: S.Y.W.S and S.V.E.; sample collection: S.V.E., K.P.H. and F.S.; methodology: S.Y.W.S. and A.C.; analysis: S.H., A.C., G.C., D.T.C.C., D.K.L., and S.Y.W.S.; writing—original draft: S.Y.W.S. and S.H.; writing—review and editing, all authors; supervision: S.Y.W.S. and S.V.E.
References
Author notes
Present address: Department of Veterinary Microbiology and Pathology, Washington State University, Pullman, WA, USA.
Conflict of interest statement. The authors declare no competing interests.
