


Abstract
The recent evolutionary history of the Y chromosome in Drosophila simulans, a worldwide species of Afrotropical origin, is closely linked to that of X-linked meiotic drivers (Paris system). The spread of the Paris drivers in natural populations has elicited the selection of drive-resistant Y chromosomes. To infer the evolutionary history of the Y chromosome in relation to the Paris drive, we sequenced 21 iso-Y lines, each carrying a Y chromosome from a different location. Among them, 13 lines carry a Y chromosome that is able to counteract the effect of the drivers. Despite their very different geographical origins, all sensitive Y's are highly similar, suggesting that they share a recent common ancestor. The resistant Y chromosomes are more divergent and segregate in four distinct clusters. The phylogeny of the Y chromosome confirms that the resistant lineage predates the emergence of Paris drive. The ancestry of the resistant lineage is further supported by the examination of Y-linked sequences in the sister species of D. simulans, Drosophila sechellia and Drosophila mauritiana. We also characterized the variation in repeat content among Y chromosomes and identified multiple simple satellites associated with resistance. Altogether, the molecular polymorphism allows us to infer the demographic and evolutionary history of the Y chromosome and provides new insights on the genetic basis of resistance.
Introduction
In Drosophila melanogaster and Drosophila simulans, like in most Drosophila species, the Y chromosome is entirely heterochromatic, composed of transposable elements and other repetitive sequences such as satellite DNA (Bachtrog 2013). In both species, the Y chromosome represents 20% of the male genome (around 40 Mb) (Hoskins et al. 2002) but contains only a handful of genes, expressed during spermatogenesis and necessary for male fertility (Kennison 1981; Bernardo Carvalho et al. 2009). Indeed, XO males are usually viable but sterile. Beyond its essential role in male fertility, the Y chromosome of D. melanogaster has been shown to impact male fitness through a variety of phenotypic effects, on behavior or thermotolerance (Huttunen and Aspi 2003; Rohmer et al. 2004). In fact, variation in Y-linked heterochromatin appears able to modulate gene expression across the whole genome by modifying the chromatin landscape (Francisco and Lemos 2014; Lemos et al. 2014; Branco et al. 2017; Brown et al. 2020). Similar effects are likely in D. simulans (Branco et al. 2013).
The large phenotypic variation caused by the Y chromosome of D. melanogaster is in sharp contrast with its very low nucleotide diversity in gene sequence compared with other chromosomes (Zurovcova and Eanes 1999; Larracuente and Clark 2013). In D. simulans, the sibling species of D. melanogaster, the gene nucleotide diversity of the Y chromosome is even lower (Zurovcova and Eanes 1999; Kopp et al 2006; Helleu et al. 2019).
This low variation can be explained by multiple factors. First, the Y chromosome has a reduced effective population size compared with the rest of the genome (one-quarter of that of the autosomes). Second, because of its hemizygous state, the fitness conditions allowing the maintenance of stable, nonneutral polymorphisms are very restrictive (Clark 1987, 1990). Finally, the Y chromosome does not recombine, which causes natural selection on a Y-linked locus to affect the entire chromosome. It follows that beneficial mutation can lead to the fixation of the carrier Y chromosome in the population (Charlesworth et al. 1987), while a deleterious mutation can lead to its loss. Population genetics models thus suggest that neutral variations within populations should be rarely maintained whereas interpopulation differences can rapidly accumulate (Clark 1987). Thus, the Drosophila Y chromosome is expected to be particularly sensitive both to the demographic history of populations and to selection events. Indeed, in D. melanogaster, the ancestral African populations show significantly less Y-linked variation than the cosmopolitan ones, which could be explained by the demographic history of the species and recent natural selection in Africa (Larracuente and Clark 2013).
Y chromosome evolution can also be shaped by intragenomic conflict triggered by X-linked meiotic drivers. These favor the transmission of X chromosomes bearing the driver (hereafter XSR), thus increasing the proportion of females in progeny and inducing a deviation from the balanced—also called Fisherian—sex ratio. Sex Ratio (SR) systems are widespread in the Drosophila genus, with 19 SR systems known in 16 species, among which three systems have been described in D. simulans (Courret et al. 2019). During spermatogenesis, an XSR typically prevents the formation of functional Y-bearing sperm, resulting in a strong female bias in the progeny of carrier males. Thus, the effective size of the Y chromosome is drastically reduced in populations invaded by XSR. Following the spread of XSR, natural selection strongly favors any variant that can counteract the effect of the driver and restore a balanced sex ratio (reviewed in Helleu et al. 2015). Such drive suppressors are expected to evolve at unlinked loci, that is, on autosomes and the Y chromosome. Resistant Y chromosomes have direct and strong selective advantage and thus are expected to quickly reach fixation (Clark 1987; Hall 2004).
Drosophila simulans is particularly well suited to investigate the impact of SR drive on the evolutionary history of the Y chromosome. In this worldwide species, autosomal suppressors and resistant Y chromosomes have evolved in response to the spread of X-linked drivers known as the Paris system (Cazemajor et al. 1997). The Paris system likely emerged less than 500 years ago in East Africa (Bastide et al. 2011; Fouvry et al. 2011). It then spread to islands of the Indian Ocean and in sub-Saharan Africa (Bastide et al. 2013). Drive suppression is complete over its geographic range, and the frequency of XSR was found to decrease in some locations, like in Madagascar, Kenya, or Mayotte (Bastide et al. 2011). During the last decade, the invasion of XSR was observed in North African populations, where sensitive Y chromosomes were then replaced by resistant ones within a few years (Helleu et al. 2019). On the whole, in D. simulans, the Y chromosomes appeared to be highly polymorphic for their resistance ability with a continuum of phenotypes, from complete resistance to high sensitivity (Montchamp-Moreau et al 2001). In contrast, they exhibit a very low level of gene sequence variation, with only three single nucleotide polymorphisms (SNPs) detected along a total of 13 kb of gene fragments; those define three haplotypes—TTA, TTT, and CAA—the latter of which is associated with resistance to Paris SR drive (Helleu et al. 2019).This low number of SNPs strongly suggests that the phenotypic variation results from variation in repeated sequences and/or from structural variations, both of which are extensive on the Y chromosomes of D. simulans (Helleu et al. 2019; Chang et al. 2022). Surprisingly, the CAA haplotype appeared to be ancestral in the simulans clade (Helleu et al. 2019), which suggests that resistant Y chromosomes have long predated the emergence of the Paris driver (Helleu et al. 2019). Consistently with this scenario, the Y chromosome of its sibling, Drosophila sechellia, is resistant to Paris XSR (Tao et al. 2007).
Thanks to the recent advance in long read sequencing, about one-third of the Y chromosomes of D. melanogaster and D. simulans (13 Mb out of 40) are now assembled (Chang and Larracuente 2019; Chang et al. 2022). Here we take advantage of those assemblies to further investigate the molecular variation of the Y chromosome in D. simulans in relation to the evolution of the Paris SR system. We sequenced 21 iso-Y lines (each with a Y chromosome originating from a single male) from different locations around the world; 8 from the sensitive lineage TTA and 13 from the resistant lineage CAA (fig. 1A). Despite their very different geographical origins, all sensitive Y chromosomes appear to be highly similar. The resistant Y chromosomes are more divergent and segregate in four distinct groups. By reconstructing the phylogeny of the Y chromosome, we confirmed that the resistant lineage predates the emergence of the Paris XSR. We also examined the variation in repeat content among Y chromosomes. We observed almost no variations in gene and transposable element copy number, neither of them showing an association with the resistant phenotype. In contrast, extensive variation was found among simple satellites, and we identified a set of satellites which presence and quantity are associated with resistance to the SR system. Altogether, this new approach allowed us to better understand the evolutionary history of the Y chromosome in relation with SR systems and also yielded new insights on the genetic basis of the resistance.
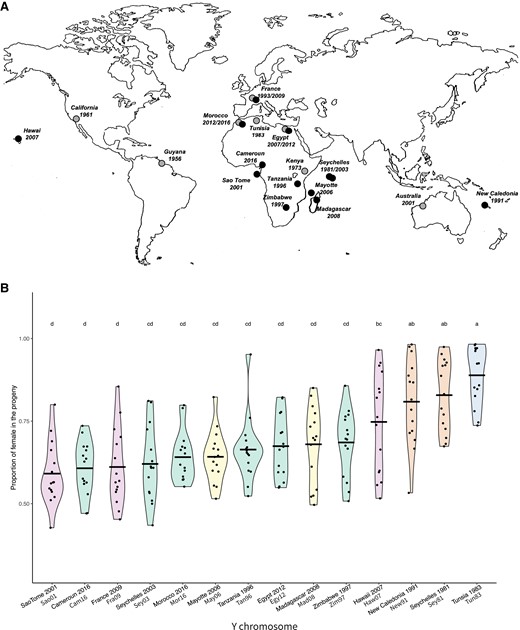
(A) Geographical location and date of collection of the Y chromosomes studied. Black circle: lines carrying a Y chromosome with the CAA haplotype (resistant). Gray circle: lines carrying a Y chromosome with the TTA haplotype (sensitive). (B) Test of the resistance ability of the Y chromosomes. Each violin plot represents the proportion of females in the progeny of males carrying the reference XSR and the Y chromosome from each iso-Y line. Tun83 corresponds to our reference sensitive Y chromosome. Each dot corresponds to the progeny of an individual male. The letters above each violin plot correspond to the group determined by the Tukey HSD post hoc test performed on an ANOVA model. Violin plots are colored according to the clusters identified by PCA (same color code as in fig. 2).
Results
Resistance Ability of the Y Chromosomes From the Resistant CAA Lineage
Among the 21 D. simulans Y chromosomes included in the present study, 13 belong to the resistant CAA lineage and were checked for their resistance ability. To do so, we produced males carrying the Y chromosome to be tested, a reference XSR chromosome, and suppressor-free autosomes from the reference ST8 line (crossing scheme in Montchamp-Moreau et al. 2001). For each Y, the individual progeny of 15 males was examined (fig. 1B).
We observed significant variation in the resistance ability among the CAA Y chromosomes (Analysis Of Variance test, F = 12.36, df = 13, P < 2e−16). The mean sex ratio in the progeny of carrier males ranged from 60% to 83% depending on the Y chromosome, compared with 89% for the sensitive YST8 (fig. 1B and supplementary table S1, Supplementary Material online). Except for Seychelles 1981 (Sey81) and New Caledonia 1991 (New91), which exhibit a low resistance ability with a mean sex ratio of 81% and 83%, respectively, all CAA Y chromosomes appear significantly more resistant compared with YST8, our reference sensitive Y chromosome (fig. 1B and supplementary table S1, Supplementary Material online).
The Molecular Variation Essentially Occurs Among Resistant Y Chromosomes
Using the Y chromosome from the XD1 strain (Chang et al. 2022) as a reference, we identified 8,190 Y-linked polymorphic sites among the 21 iso-Y lines sequenced. The global nucleotide diversity is very low (1.808e−04) and most of this diversity comes from the CAA-resistant Y chromosomes (supplementary fig. S1, Supplementary Material online). On average, these share the same allele at 76.89% of the polymorphic sites, while on average, the sensitive TTA Y chromosomes share the same alleles at 97.77% of the detected polymorphic sites (table 1). Sensitive Y chromosomes are thus highly similar despite originating from geographical regions far away from each other. They all mainly share the same allele as the reference allele (supplementary fig. S1, Supplementary Material online). It follows that the Y chromosome of the XD1 strain (from Winters, CA, 1995) belongs to the sensitive TTA lineage.
Summary of the Number of Shared SNPs per Cluster.
| Groups | Sensitive (Cluster I) | Resistant (all) | Resistant (Cluster II) | Resistant (Cluster III) | Resistant (Cluster IV) | Resistant (Cluster V) |
|---|---|---|---|---|---|---|
| No. of shared SNP | 6,985 | 1,123 | 6,191 | 7,488 | 7,644 | 6,704 |
| Average % of identity | 97.77 | 76.89 | 97.78 | 96.13 | 97.58 | 95.77 |
To examine the population structure of the Y chromosomes, we performed a principal component analysis (PCA) based on the 8,190 SNPs identified. It revealed five different clusters. Unsurprisingly, based on their high percentage of identity, all the sensitive Y chromosomes cluster together (Cluster I, fig. 2). The resistant Y chromosomes segregate in four different clusters. Cluster II is composed of Egy12, Tan96, Zim97, Mor16, Cam16, and Sey03, all originating from continental Africa or nearby islands. Cluster III is composed of Sey81 and New91, from Seychelles and New Caledonia, respectively. Cluster IV consists of May09 and Mad98, respectively sampled in Mayotte and Madagascar, the area from which the D. simulans species is thought to have originated (Dean and Ballard 2004; Lachaise and Silvain 2004). Cluster V is composed of Fra09, Haw07, and Sao01, which are from very far apart geographical areas (France, Hawaii, and Sao Tome, respectively). The first axis of the PCA (29.8%) separates Cluster III from all the other Y chromosomes (fig. 2). This means that the divergence between Sey81/New91 and all the other Ys is higher than between all the other resistant Y chromosomes and the sensitive Y chromosomes. Interestingly, those Y chromosomes from Seychelles and New Caledonia are also very similar in resistance ability (fig. 1B).
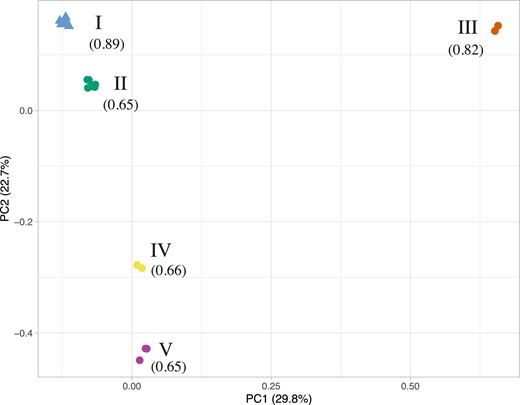
PCA based on nucleotide diversity among the 21 Y chromosomes (8,190 polymorphic sites). The sensitive Y chromosomes are represented by a triangle while the resistant Ys are represented by a circle. Each Y chromosome is colored according to the cluster to which it belongs. Cluster numbers are indicated in roman numerals, with, in parentheses, the average female frequency produced over the Y chromosomes of the corresponding cluster in resistance tests.
None of the pairs of sensitive-resistant Y chromosomes originating from the same geographical area cluster together. This confirms that the resistant chromosomes did not emerge locally but rather arose from migration along with the driver. While the sensitive Y chromosomes (Egy07, Mor12, and Fra93) are older than their resistant counterparts, that is, were present respectively in North Africa and Europe before the arrival of the Paris SR system, they appear to be very similar. Indeed, they group together into Cluster I. In contrast, the resistant chromosomes sampled more recently in those populations are more variable. The resistant Y chromosomes from Morocco (Mor16) and Egypt (Egy12) group together in Cluster II, while the resistant Y chromosome from France (Fra09) belongs to Cluster V. Thus, the resistant Y chromosomes from Morocco (Mor16) and Egypt (Egy12) appear to be closely related, whereas the resistant Y chromosome from France (Fra09) likely originated from a different migration path.
Finally, the two resistant Y chromosomes collected in Seychelles in 1981 (Sey81) and 2003 (Sey03) do not cluster together. They have very different resistance ability (fig. 1B) and each clusters with Y chromosomes showing a similar level of resistance (fig. 2). Because these Y chromosomes were collected more than 20 years apart, we cannot conclude if there was a polymorphism within the Seychelles islands with Y chromosomes from Clusters II and III segregating in the population or if a migration event from continental Africa led to the secondary introduction of a more resistant Y chromosome in Seychelles islands.
Very Little Within-Population Variation of the Y Chromosome
To get an insight into the intrapopulation polymorphism of the Y chromosome, we genotyped by PCR-sequencing 98 additional chromosomes from 22 populations. This first allowed us to validate 11 SNPs detected by our approaches and to look at within-population variation. We reconstructed a haplotype network (supplementary fig. S2, Supplementary Material online). It recapitulates the clusters identified by the PCA (fig. 2), except for Clusters IV and V that grouped together as we do not have SNP distinguishing each cluster. Most of the time all the individuals collected in the same location at the same time carry the same haplotype (supplementary table S2, Supplementary Material online). Only one population from France (collected in 2014 and 2015) seems to be polymorphic, containing Y chromosomes from Clusters I, II, and V. We postulate that recurrent annual migrations occur in Western Europe, in accordance with the observation that D. simulans cannot overwinter in temperate regions (Boulétreau-Merle et al. 2003; Machado et al. 2016). In addition, migration in D. simulans is likely largely human-aided and must have broadly amplified all over the world in the recent past, as suggested by the rapid invasion of the P transposable element within the last decade (Hill et al. 2016).
The Resistant Lineage Predates the Emergence of the Driver
Previous work suggested that resistance to XSR is ancestral to all D. simulans Y chromosomes because the species sister to D. simulans (D. mauritiana and D. sechellia) carry the CAA haplotype, which is associated with resistance in D. simulans (Helleu et al. 2019). We reexamined this hypothesis in the light of our new sequencing data. We sought to identify the corresponding allele carried by D. melanogaster, D. mauritiana, and D. sechellia for the 8,190 SNPs identified as polymorphic within D. simulans. We were able to recover 6,138 SNPs in D. mauritiana, 6,126 SNPs in D. sechellia, and 3,909 SNPs in D. melanogaster. Based on the 8,190 SNPs, we reconstructed the phylogeny of the Y chromosomes using a maximum likelihood approach and D. melanogaster as the outgroup (fig. 3). The phylogeny defines five clades corresponding to the five clusters identified by the PCA (fig. 2). According to this tree, it appears clear that the ancestral Y chromosome belongs to the resistant lineage. Indeed, the first divergent clade is Cluster III, composed of two resistant Y chromosomes Sey81 and New91. Whereas the clade that includes all sensitive Y chromosomes (Cluster I) appears to have a recent common ancestor nested within clusters of resistant Y chromosomes, the sensitive haplotype seems to diverge from the same ancestor as the resistant Y chromosome of cluster II.
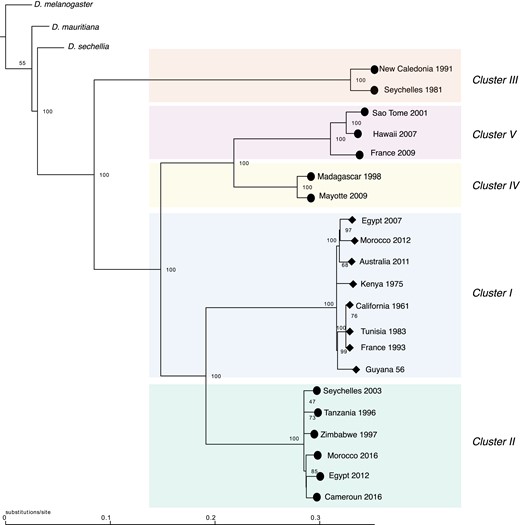
The inferred maximum likelihood phylogeny for the Y chromosome. Drosophila melanogaster was used as the outgroup. Node labels indicate ultrafast bootstrap. The resistant Y chromosomes are indicated by a circle at the tip and sensitive Y chromosomes are indicated by diamond at the tip. Clusters are colored based on the cluster defined by the PCA analysis (fig. 2).
In addition, we focused on the 590 SNPs that correspond to fixed differences between the four clusters of resistant Y's and the cluster of sensitive Y's (Cluster I), to identify the allele carried by the sister species. While we were not able to recover all the SNPs, 97.4% of the recovered ones carry the resistant allele in D. mauritiana, 94.8% in D. sechellia, and 93.7% in D. melanogaster.
Altogether, we conclude that the common ancestor of the melanogaster clade was carrying a Y chromosome closely related to the resistant lineage. Thus, while the sensitive lineage is the most common Y chromosome lineage found worldwide, it is a divergent lineage that seems to have a recent origin. This also means that the resistant Y chromosome lineage predates the emergence of the Paris SR driver in D. simulans.
Gene Copy Numbers Appear Stable Among Y Chromosomes
To assess whether some components of the Y chromosomes are associated with the resistance phenotype, we first estimated the exon copy number for each of the 11 canonical Y-linked genes (fig. 4A). Our estimates are in agreement with the previous estimates from the reference genome (Chang et al. 2022). Most of the canonical genes are in single copy and do not exhibit variation between Y chromosomes (fig. 4A). ARY was previously described as a multicopy gene with four copies on the reference genome; here we estimated between four and six copies of ARY among our 21 Y chromosomes. Similarly, kl2-exons 8–12 are known to be duplicated, with more than 15 copies for exon10 for example. They are also the most variable among the 21 Y chromosomes, with kl2-exon10 showing between 10 and 17 copies. kl3-exon16 shows an interesting variation: while most of the Y chromosomes have three copies, the three Y chromosomes that belong to Cluster V (Haw07, Sao01, and Fra09) show a high duplication rate (between 7 and 11 copies) (fig. 4A).
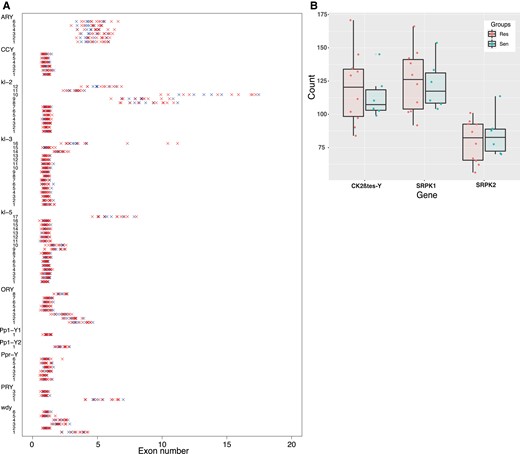
(A) Strip chart representing the exon numbers for each Y-associated gene. Each line corresponds to a specific exon of a specific gene. Red crosses correspond to resistant Y chromosomes and blue crosses to the sensitive Y chromosomes. (B) Box plot representing the exon numbers for the two Y-linked multicopy gene families, CK2βtes-Y and Lhk, among resistant (Res) and sensitive (Sen) Y’s.
In addition to the 11 canonical genes, two ampliconic genes have been described on the Y chromosome of D. simulans: CK2βtes-Y and Lhk (Chang et al. 2022). Accordingly, both exhibit variation in exon copy number among our 21 Y chromosomes. We estimate between 83 and 170 copies of CK2βtes-Y, between 91 and 156 copies of Lhk-exon1, and between 56 and 113 copies of Lhk-exon2, depending on the Y (fig. 4B).
In general, only exons that are multicopy appear to be variable in terms of copy number. Importantly, we did not find any evidence for an association between the exon copy number and the resistance phenotype (fig. 4A and B). It thus appears unlikely that the variation in resistance is due to a variation in exon copy number.
Very Low Y-Linked Variation in Transposable Element Abundance Between Populations
Using the raw Illumina reads, we then estimated the abundance of transposable elements and complex satellites in 16 iso-Y lines (6 sensitive and 10 resistant; see Materials and Methods). Because our Y chromosomes have been isolated in the same genetic background, we assumed that variation in the abundance of repeats between iso-Y lines is associated with the Y chromosome. To investigate whether variation in Y-linked complex repeat abundance shows the same clustering as Y-linked nucleotide polymorphism, we performed a PCA analysis (fig. 5A). Globally, the complex repeat abundance does not replicate the clusters defined by SNPs in figure 2. The sensitive Y chromosomes (Cluster I) show a diffuse distribution that partially overlaps with some resistant Y chromosomes. Similarly, the distributions of resistant Y chromosomes from Clusters III, IV, and V largely overlap. Only the Y-resistant chromosomes from Cluster II fully separate from all the others.
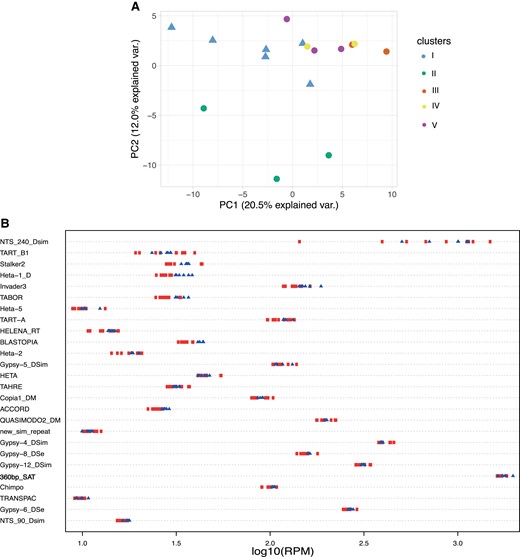
(A) PCA based on the complex satellite abundance. Sensitive Y chromosomes are represented by a triangle while the resistant Ys are represented by a circle. Each Y chromosome is colored based on the clusters defined previously using the nucleotide diversity (fig. 2). (B) Strip chart representing the top 25 most variable complex satellites (based on coefficient of variation), among which the 360-bp satellite (in bold) is indicative of the background noise. To be able to distinguish the differences between strains, RPM counts have been transformed in log10. Each dot corresponds to a Y chromosome. The Y-resistant chromosomes are represented by a red circle while the sensitive Y chromosomes are shown with a blue triangle.
Next, we tested whether the phenotypic variations observed among the Y chromosomes were associated with variations in gross repeat content. We thus performed a Wilcoxon test to assess whether some transposable elements or complex satellites might be differentially enriched between sensitive and resistant Y chromosomes. None of these repeats show significant variation (supplementary table S3, Supplementary Material online), indicating that the abundance in complex repeats is not associated with the resistance phenotype. More generally, it appears that most complex repeats exhibit very low to no variation in abundance between iso-Y lines (supplementary table S3, Supplementary Material online). We calculated the coefficient of variation for each complex repeat and plotted the abundance for the top 25 most variable ones (fig. 5B). The NTS-240 element is the only complex repeat that shows substantial variation, with more than 10-fold variation in abundance between Y lines (fig. 5B). While lower in abundance, the telomeric transposable elements (Het-A, TART, and TAHRE) are also among the most variable repeats (fig. 5B).This is in agreement with the existence of those elements in various regions on the Y chromosome (Agudo et al. 1999). However overall, the majority of these top 25 most variable repeats show relatively low variation between iso-Y lines. It is important to note that the abundance represented here is the whole genome abundance. Thus, complex repeats that are not associated with the Y chromosome are expected to show low to no variation, the level of which could reflect that of background noise. This is the case for the 360-bp satellite, which is a complex satellite in the 1.688 family, highly abundant on chromosomes II and III in D. simulans (de Lima et al. 2020; Sproul et al. 2020) and not associated with the reference Y chromosome (Chang et al. 2022). The 360-bp satellite shows 1.8-fold variation among iso-Y lines, and we therefore assume that repeat variations at or below this threshold likely represent background noise (fig. 5B).
Simple Satellite Enrichment Reveals Candidates for the Resistance
Finally, we compared the simple satellite composition between the same 16 iso-Y lines (6 sensitives and 10 resistants). Simple repeats represent over 5% of D. simulans genome and are a major component of the Y chromosome (Wei et al. 2018). Using the k-seek pipeline (Wei et al. 2014), we identified 177 simple satellites, including the most abundant k-mers previously described to be highly enriched in D. simulans (Wei et al. 2018) (supplementary table S4, Supplementary Material online). Interestingly, we found that simple satellite abundance recapitulates the structure between iso-Y lines defined by the SNP calling (fig. 6A vs. fig. 2).
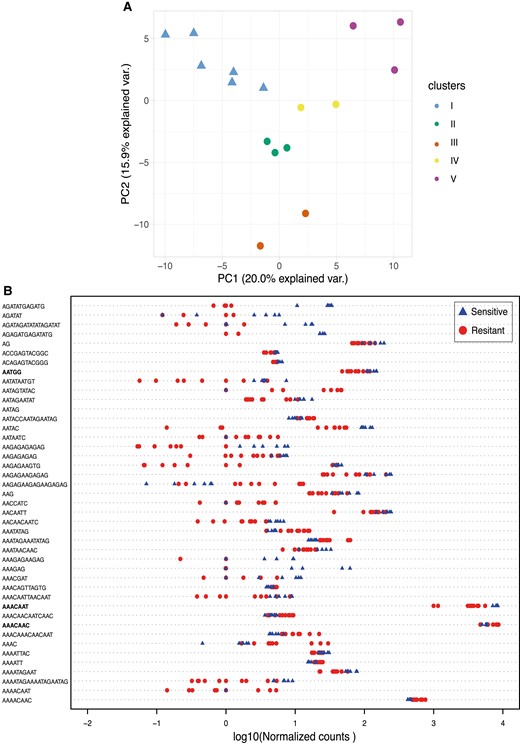
(A) PCA based on the simple satellite abundance. Each Y chromosome is colored according to the cluster to which it belongs (defined by nucleotide diversity, fig. 2B). Sensitive Y chromosomes are represented by triangles while the resistant ones are represented by circles. (B) Strip chart of the 43 simple satellites differentially enriched (P < 0.05) between the resistant Y's (red circles) and the sensitive Y’s (blue triangles). Normalized counts were transformed in log10.
Among the 177 satellites, 43 appear differently enriched on resistant versus sensitive Y chromosomes (Wilcoxon test, P < 0.05) (fig. 6B). About two-thirds of them (28/43) are more enriched among sensitive Y chromosomes (figs. 6B and S3, Supplementary Material online). Because we observed variation in resistance among the former group (fig. 1B), we performed a Spearman correlation test between the abundance of each of the 177 satellites and the sex ratio observed in the resistance tests for the 10 resistant Ys plus the reference sensitive Y (Tunisia 1983) (supplementary fig. S4, Supplementary Material online). Based on their abundance and correlation with the phenotype and on their location (enriched or specific to the Y chromosome), we identified a set of potential candidate satellite that may be involved in the resistance phenotype.
Among the satellites more abundant on sensitive Y chromosomes, four of them, known to be associated to the Y chromosome (Wei et al. 2018), are particularly interesting. The first one, (AAACAAT)n, is among the most abundant satellites and is 2-fold more enriched in the sensitive lineages than in the resistant lineages (fig. 7A, Wilcoxon test P < 2e−04). The other three, (AATGG)n, (AAGAGAAGAGAG)n, and (AACAATT)n, are less abundant, but the sensitive Y chromosomes are also significantly more enriched than the resistant ones (Wilcoxon test, P < 0.05). None of these satellites show significant correlation with the strength of the resistance phenotype (supplementary fig. S4, Supplementary Material online). We performed fluorescence in situ hybridization (FISH) on mitotic chromosomes for a subset of our iso-Y lines from each cluster, with probes for (AAACAAT)n, (AATGG)n (figs. 7B and S5, Supplementary Material online), (AAGAGAAGAGAG)n, and (AACAATT)n (supplementary fig. S6, Supplementary Material online). We confirmed that (AAACAAT)n, (AATGG)n, and (AACAATT)n are specific to the Y chromosomes, at least at the level FISH can detect. With regard to (AAGAGAAGAGAG)n, a signal was observed on the Y chromosomes and also on the X chromosome (originating from the ST8 line, see Materials and Methods) (supplementary fig. S6, Supplementary Material online). We observed a strong signal with AAACAAT for all the Y chromosomes tested, which is consistent with its high copy number. The signal for AATGG was clearly lower as expected from its lower abundance (fig. 7A). While we detected a AATGG signal for all the sensitive Y chromosomes, the signal was low or absent for the resistant Y chromosomes (figs. 7B and S5, Supplementary Material online). Once again, this is consistent with our estimates that there are fewer copies on the resistant Y chromosomes. In addition to quantitative variation, we observed structural variations associated with the four satellites (figs. 7B, S5, and S6, Supplementary material online). In most of the cases, they seem located at or close to the tip of the Y chromosome’s long arm, while they appear closer to the centromere on the resistant chromosomes from Cluster II (figs. 7B, S5, and S6, Supplementary material online).
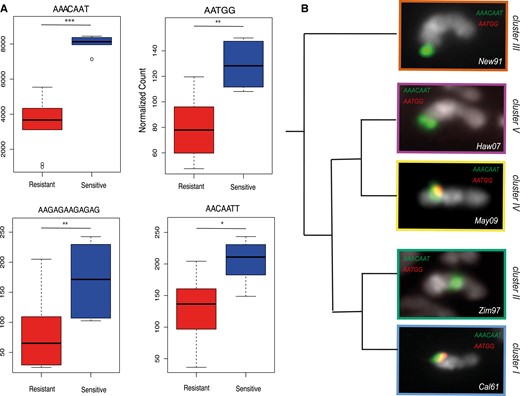
(A) The box plots represent the abundance of (AATGG)n, (AAACAAT)n, (AAGAGAAGAGAG)n, and (AATGG)n among resistant Ys (red) and sensitive Ys (blue) (Wilcoxon test, *P < 0.05; **P < 0.01, ***P < 0.001). (B) FISH on mitotic chromosomes from larval brains using (AACAAT)4 (green) and (AATGG)6 (red) probes. A single Y chromosome from each cluster is displayed. The whole karyotype FISH on the other iso-Y lines is shown in supplementary figure S5, Supplementary Material online.
Finally, two additional satellites showing an opposite pattern came to our attention, (AAACAAC)n and (AACAATC)n. While they show no or low differential enrichment between the sensitive and resistant Y chromosomes (fig. 8A and B), they show a strong positive correlation between abundance and the resistance level (fig. 8C and D, Spearman test, P < 0.01). The most resistant Y chromosomes are also the most enriched for (AAACAAC)n and (AACAATC)n. Both satellites are known to be associated with the Y chromosome (Wei et al 2018); (AACAATC)n is even Y-specific. Using FISH on mitotic chromosomes, we show that the signal of both satellites is specific to the Y chromosome (fig. 8E). And it seems to have a localization similar to the previous candidates (figs. 7B and 8E). (AAACAAC)n and (AACAATC)n are located close to the tip of the long arm of the Y chromosome except for the Y chromosomes from Cluster II, where they appear closer to the centromere (figs. 8E and S7, Supplementary Material online).
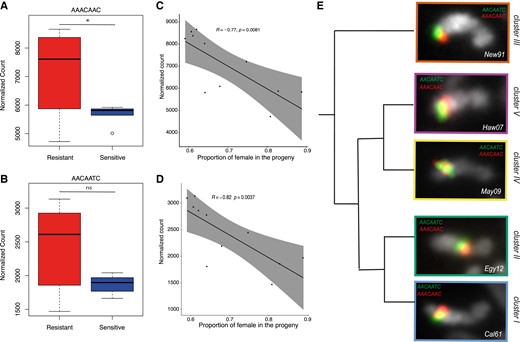
Abundance of (AAACAAC)n (A) and (AACAATC)n (B) satellites. The box plots represent their abundance in each group of Y chromosomes (resistant in red and sensitive in blue) (Wilcoxon test, *P < 0.05; ns, non significant). (C, D) The dot plots show the correlation between the satellite abundance (y-axis) and the proportion of females in the progeny (x-axis), inversely proportional to the resistance. Correlation was calculated based on a Spearman correlation test. (E) FISH on mitotic chromosomes from larval brains using (AACAATC)4 (green) and (AAACAAC)4 (red) probes. A single Y chromosome from each cluster is displayed. The whole karyotype FISH on the other iso-Y lines is shown in supplementary figure S7, Supplementary Material online.
To further validate the accuracy of our abundance estimates by k-seek, we quantified the abundance of AAACAAT, AAACAAC, and AACAATC using slot blot. We found a positive correlation (Pearson correlation test, P < 0.05) between the abundance inferred by k-seek and the blot quantifications (supplementary fig. S8, Supplementary Material online).
Discussion
Y-linked nucleotide diversity in both D. melanogaster and D. simulans is known to be very low compared with the rest of the genome (Larracuente and Clark 2013; Helleu et al. 2019). Those previous estimates were done using genic sequences, which limits the estimation to a very small portion of the Y chromosome. Here, taking into account the assembled part of the chromosome (around 13 Mb), we found that the Y-linked nucleotide diversity in D. simulans is about 15-fold lower than the estimate in D. melanogaster (π was estimated ranging from 0.00266 to 0.01696 in Larracuente and Clark 2013; here π = 0.0001808). While the level of nucleotide variation among the Y chromosomes examined here is very low, it reflects the evolutionary history of the species.
Evolutionary History of the Y Chromosome Related to the Demographic History of D. simulans
The Ancestral Origin of the Resistance
Drosophila simulans is thought to originate from Madagascar or the surrounding area (Dean and Ballard 2004; Lachaise and Silvain 2004). We hypothesize that this ancestral population was carrying a drive-resistant Y chromosome (fig. 6A). Indeed, according to the phylogeny (fig. 3), the sensitive Y chromosomes are derived recently in D. simulans from resistant Y chromosomes, suggesting that the ancestral Y chromosome in D. simulans was of the resistant type. The ancestry of the resistant lineage does not necessarily mean that the resistant phenotype is ancestral. However, based on our phylogeny, it is most parsimonious that the sensitive lineage (Cluster I) corresponds to a secondary loss of resistance to Paris SR. Consistent with this scenario, previous work suggested that the Y chromosome of D. sechellia is resistant to the Paris drivers (Tao et al. 2007; Rice 2014).
Spread of D. simulans in Seychelles and Continental Africa
During a first expansion event, D. simulans is thought to have independently colonized the Seychelles islands and the African continent (Lachaise and Silvain 2004) (fig. 6A). Our data support this scenario. Indeed, most of the Y chromosomes from continental Africa belong to Cluster II while the two chromosomes from Seychelles and New Caledonia belong to Cluster III (fig. 2). The phylogeny agrees with the early divergence of these two chromosomes. Not only do they appear genetically different but they also have a different phenotype. Indeed, the Y chromosomes from Seychelles (Sey81) and New Caledonia (New91) appear less resistant than the other resistant Y chromosomes (fig. 1B).
This scenario for the demographic history of D. simulans was supported by the distribution of the mitochondrial (mt) haplotype. In D. simulans, there are three different mt haplotypes: siI, siII, and siIII (Solignac and Monnerot 1986). The siII haplotype is found worldwide. In Madagascar and La Reunion, populations appear polymorphic for siIII and siII. The last haplotype, siI, is specific to the Indo-Pacific islands (Seychelles, New Caledonia, and Hawaii). We controlled for the mt haplotype of our strain. As expected, most of them carry the siII haplotype with the exception of the strains from Hawaii, New Caledonia, and Seychelles that carry the siI haplotype, and Mayotte that carries the siIII haplotype (supplementary table S5, Supplementary Material online).
Emergence and Spread of the Sensitive Lineage
The phylogeny indicates that the sensitive Y chromosomes (Cluster I) and resistant Y chromosomes from continental Africa (Cluster II) have a recent common ancestor (fig. 3). This suggests that the sensitive lineage emerged in continental Africa and started to replace resistant Y chromosomes (fig. 9B). This hypothesis is supported by the Ken73 Y chromosome that comes from flies collected in Kenya in 1973. The Ken73 Y chromosome belongs to Cluster I and appears similar to the sensitive Y chromosomes found across the world.
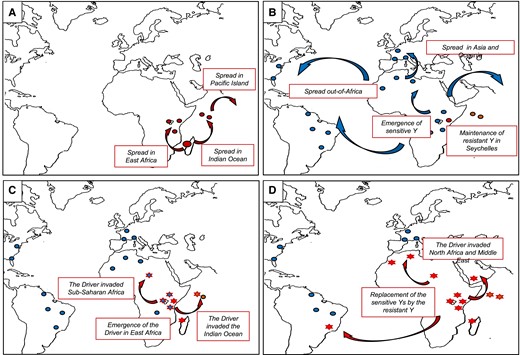
Proposed scenario for the demographic history of D. simulans in relation to the Paris SR system. (A) Expansion of D. simulans out of its area of origin, toward the Seychelles and the African continent (Dean and Ballard 2004; Lachaise and Silvain 2004). The ancestral Y chromosome belongs to the resistant lineage, here represented by a red circle. (B) Emergence of the sensitive lineage in sub-Saharan Africa and diffusion out-of-Africa. Here sensitive Y chromosomes are represented by a blue circle. (C) Emergence of the Paris SR system in East Africa (Bastide et al. 2011). Populations where the system is detected are represented by a star. (D) Spread of the Paris SR system and replacement of the sensitive Y chromosome by resistant Y chromosome (Helleu et al. 2019).
The Y chromosome that has then spread out-of-Africa is the sensitive Y chromosome, which became the major Y chromosome across the species range (Helleu et al. 2019) (figs. 1A and 6C). The low nucleotide diversity (>97% similarity, table 1) within the sensitive Y lineage suggests that this event probably arose very recently. Indeed, it has been shown that the expansion of D. simulans is more recent than that of D. melanogaster, likely 6,500–5,000 years in Eurasia (Lachaise and Silvain 2004) and 500 years in North America (Wall et al 2002).
Why has the sensitive Y chromosome previously superseded the ancestral resistant Y chromosome? Multiple nonexclusive factors could have favored the spread of Y sensitive lineage. First, the emergence of an advantageous mutation may have led to a strong positive selection on sensitive Y chromosomes. A selective advantage associated with a Y chromosome can quickly lead to its fixation into the population (Clark 1987). The Y sensitive chromosomes might improve the fitness of their carrier over the resistant Y chromosome, and they can increase the fertility or favor the adaptation to a new environment. Second, the demographic history of the species could also explain the low level of polymorphism of the sensitive Y chromosomes (Irvin et al. 1998; Hamblin and Veuille 1999). Indeed, effects such as migration and bottlenecks could have facilitated the spread of the sensitive lineage and reduced its effective population size. Finally, the last hypothesis involves recurrent genetic conflict. In D. simulans, there are at least three independent SR systems: Paris, Winters, and Durham. The Winters and Durham SR systems are cryptic and presumably much older than the Paris system (Meiklejohn et al. 2018). Thus, SR systems appear common in this species (Muirhead and Presgraves 2021; Vedanayagam et al. 2021). The intense resulting genetic conflicts between X and Y chromosomes have an important impact on sex chromosome evolution. We hypothesize that the presence of an X-linked driver in D. simulans, before the emergence of the Paris SR system, could have driven the spread of some Y chromosomes belonging to the lineage sensitive to the Paris driver. Some of the Y chromosomes sensitive to the Paris driver could have been resistant to this more ancient driver. A quick replacement of sensitive by resistant Y chromosomes might have occurred in the past but triggered by another driver. This more ancient driver would have favored the spread of the sensitive Y chromosome lineage before becoming cryptic or disappearing. Previous work shows large variation in the resistance ability of the Y chromosomes to the Winters driver (Branco et al. 2013). Testing the same set of Y chromosomes in the three SR systems might help understand the cause of the spread of the sensitive Y chromosomes.
Emergence of the Paris System and Replacement of the Sensitive by the Resistant Y Lineage
The Paris system likely emerged in East Africa less than 500 years ago and quickly spread in the Indian Ocean Island and sub-Saharan Africa (Bastide et al. 2011). During the last two decades, we observed the invasion of the system in North Africa, Europe, and the Middle East (Bastide et al. 2013; Helleu et al. 2019). Due to their transmission advantage, the resistant Y chromosomes were strongly selected and quickly spread along with the driver, replacing the Y sensitive chromosomes (Helleu et al. 2019) (fig. 9D).
Our approach allows us to follow the migration path of the Paris SR system. For example, the resistant Y chromosomes from Egypt, Morocco, and France segregate in different clusters, indicating that the Paris SR system has migrated independently to North Africa and Europe. Similarly, the two resistant Y chromosomes from Seychelles—which have been collected more than 20 years apart—belong to two different clusters. The Y chromosome collected in 2003 (Sey03, Cluster II) likely results from migration from continental Africa to the Seychelles island around that time. In addition, it appears to be more resistant than the one collected in 1981 (Sey81, Cluster V), which could explain this replacement.
Genetic Basis of the Resistance
Beyond the evolutionary history of the Y chromosome, we also provide important insight into the genetic basis of the resistance to Paris XSR. Based on its large phenotypic variation, we hypothesize that the resistance ability might be associated with variation in the repeat content on the Y chromosome. We did not find any association between the resistance and the gene or transposable element abundance on the Y chromosomes, and they even appear quite stable. In contrast, we do find a strong association with the simple satellite composition (fig. 6A) and identified several candidates that could be involved in resistance: (AAACAAT)n, (AATGG)n, (AAGAGAAGAGAG)n, and (AACAATT)n (fig. 7A) or (AAACAAC)n and (AACAATC)n (fig. 8A and B). (AAACAAT)n, (AATGG)n, (AAGAGAAGAGAG)n, and (AACAATT)n are known to be enriched or specific to the Y chromosome in D. simulans (Wei et al. 2018) (supplementary figs. S5 and S6, Supplementary material online) and exhibit a lower copy number on the resistant Y chromosome (fig. 7A). In addition to the copy number variation, (AAACAAT)n and (AATGG)n appear to be associated with structural variation among resistant Y chromosomes (figs. 7B and S5, Supplementary Material online) (Helleu et al. 2019), which may also contribute to variation in the phenotype. The two other candidates, (AAACAAC)n and (AACAATC)n, are also enriched on the Y chromosome (Wei et al 2018) but, on the opposite, their abundance positively correlates with their resistance ability (fig. 8). This would suggest that those satellites could confer the ability to resist to the driver. One of the drivers of the Paris SR system has been identified as HP1D2, a member of the heterochromatin protein gene family, known to be involved in heterochromatin regulation. We have previously shown that HP1D2 is specifically expressed in spermatogonia and is enriched on the Y chromosome (Helleu et al. 2016). In addition, the drive is due to a loss of function of HP1D2. We thus hypothesize that the drive is associated with a misregulation of the heterochromatin region of the Y chromosome. While we do not know the precise target of HP1D2, those simple satellites are possible candidates. Correlations between the target copy number and the strength of the drive have been shown in other meiotic drive systems. For example, in the SD system of D. melanogaster, the Rsp satellite is the target of the driver (Hartl 1974). Variation in Rsp copy number is related to variation in the sensitivity to the driver (Lyttle 1989). Chromosomes with a higher copy number of Rsp are more sensitive to the driver. Similarly, particular repeats may be involved in the resistance to the Paris drivers and possibly be their target. Four of the simple satellite candidates we identified as associated with drive sensitivity of the Y chromosome follow this model (fig. 7A). Three of them, (AATGG)n, (AAACAAT)n, and (AAGAGGAAGAGAG)n, appear absent from the D. sechellia Y chromosome (Wei et al 2018). This is consistent with the finding that the D. sechellia Y chromosome is resistant to the Paris driver. Variation in resistance could be due to variation in their abundance and/or in their localization. Considering that the distortion is due to a misregulation of heterochromatic sequences, the localization of those sequences on the Y chromosome could be more or less critical for chromosome segregation. Also, we cannot exclude that the resistance phenotype is multifactorial, or that the genetic basis of resistance is different between Y chromosome lineages.
To conclude, our study sheds light on the evolutionary history of the Y chromosome in D. simulans. We show that resistant Y chromosomes likely predated the emergence of the Paris SR system and that sensitive Y chromosomes have spread through the world in the recent past. The Paris system is particularly young, at least in its present form, since the segmental duplication which is involved in driving likely emerged less than 500 years ago (Bastide et al. 2013). While its impact on the recent evolutionary history of the Y chromosome is clearly strong, it cannot explain on its own the whole pattern of variation we observed here. More likely, the Y chromosome was recurrently involved in genetic conflicts, which resulted in multiple selective sweeps. Furthermore, we also provide new insights on the genetic basis of Paris drive resistance. Knowing that simple satellites are likely involved should help us to move further in the understanding of the molecular mechanism underlying the Paris SR system.
Materials and Methods
Fly Stocks
Except for Ken73, all iso-Y lines (derived from a single male) carry the same standard genetic background (XST AST) from the ST8 reference strain (Montchamp-Moreau and Cazemajor 2002). The crossing procedure used to isolate the Y chromosomes is presented in Montchamp-Moreau et al. (2001). The fourth chromosome was not controlled. The place and date of collection of the strains from which the Y chromosomes studied originate are given in supplementary table S5, Supplementary Material online.
ST8 is the reference standard strain in the Paris SR system. It has been collected in Tunisia (1983) and is free of driver and suppressor elements (Montchamp-Moreau and Cazemajor 2002).
The ST8/C(1)RM,yw line is derived from the reference standard line ST8. Females carry a compound X chromosome C(1)RM,yw and males carry the XST8 from the ST8 line. The Y chromosome and the autosomes are from the ST8 line.
The ST8;Cy;Delta/Ubx line carries the sex chromosomes from the ST8 line and dominant markers on chromosomes II (Cy) and III (Ubx/Delta).
The XSR3 line is used to test the resistance ability of the Y chromosome. The males carry an XSR from the reference SR strain (collected in Seychelles in 1981; Cazemajor et al. 1997) and the females carry the compound XchromosomeC(1)RM,y,w. The Y chromosome and the autosomes come from the ST8 line.
For simplicity, each iso-Y line name is coded as follows: the three first letters of their location + last two digits of the collection year (for instance, Morocco 2012 is Mor12).
Resistance Test
Each Y chromosome from the CAA lineage and the standard YST8 have been tested for their resistance ability against the same reference XSR3. The crossing procedure is detailed in Montchamp-Moreau et al. (2001). Briefly, males carrying the Y chromosome to be tested (Ypop) were mass-mated with ST8/C(1)RM,yw females. Three F1 females were individually mated with XSR3 males, thus producing F2 males carrying both the XSR3 and Ypop and standard autosomal background. Five males from each F2 progeny were individually mated, each with two ST8 females (so a total of 15 F2 males tested for each Ypop). Only individual F3 progenies consisting of at least 50 flies were considered.
Before statistical analyses, the data were transformed in arcsin(), where q corresponds to the proportion of females in the progeny. To test for within-strain variation in Y resistance, we performed a Kruskal–Wallis test between groups of F2 progenies (from the same F1 cross). All the iso-Y lines appear homogeneous (supplementary table S1, Supplementary Material online). We performed a Wilcoxon test to determine whether those lines were significantly different from ST8. They all appear significantly more resistant than ST8 except Sey81 and New91 (supplementary table S1, Supplementary Material online). Finally, we performed a Tukey HSD post hoc test on the ANOVA model to determine groups (fig. 1B). All statistical analyses were conducted in R base (R Core Team 2022). The R script used can be found on github: Figure 1/resistance.R.
DNA Extraction and Sequencing
DNA extraction and sequencing were performed in two batches. In batch 1, we sequenced Tun83, Egy07, Ken73, Zim97, Egy12, Tan96, and Sey81. In batch 2, we sequenced Tun83, Fra93, Aus11, Mor12, Cal61, Guy56, Sey81, May09, Fra09, Mor16, Sao01, Cam16, New91, Haw07, Mad98, and Sey03. Tun83 was sequenced in both batches to control for potential technical bias. Sey81 was sequenced in the first batch in its original genomic background (from Sey81) and then the Y chromosome was isolated in the same standard genomic background (from ST8 strain) and resequenced in the second batch. DNA was extracted from 50 adult J1 male flies using the Nucleobond AXG20 column from Macherey-Nagel. For whole genome sequencing, libraries were prepared using Illumina PCRfree kit and sequencing was done using Illumina HiSeq3000 technology with paired-end 150-bp reads. The sequencing depth was determined in order to obtain a minimum autosomal coverage of 80x.
Mapping and Variant Calling
Paired-end reads were trimmed using trimgalore (trim_galore --paired --nextera --length 75 --phred33 --no_report_file –fastqc) (Krueger et al. 2021). Read quality was assessed using FASTQC.
Reads were mapped against the reference genome with bwa (v7.4) using the BWA-MEM algorithm (default parameters). We used the heterochromatin-enriched assembly of D. simulans (Chang et al. 2022) that includes 15 Mb of the Y chromosome as reference genome. Resulting sam alignment files were converted into bam files and sorted using respectively samtools (v1.11) view and sort command. PCR duplicates were removed using Markduplicates from Picardtools (v2.12.0) (https://broadinstitute.github.io/picard/). For our SNP calling analyses, we want to keep only the uniquely mapping reads, whereas for the repeat quantification, we need to keep also the multimapping reads. We thus performed two different filtering based on mapping quality using samtools view (Li et al. 2009). To keep multimapping reads, we use the following parameters: -b -h -f 3 -F 4 -F 8 -F 256 -F 2048; to keep only the uniquely mapping reads, we use the following parameters: -b -h -f 3 -F 4 -F 8 -F 256 -F 2048 -q30. Mean coverage was determined using the genomecov tool of bedtools (Quinlan and Hall 2010). The pipeline used (Mapping.sh) can be found on the github repository.
Variant calling was done on the uniquely mapping bam files using mpileup and call commands from bcftools (v1.14) (Li 2011). We then performed different filtering steps. First, we isolate the SNPs associated to the Y chromosome using vcftools. We use vcftools (Danecek et al. 2011) to analyze the quality of the SNP calling on the Y chromosome based on variant mean depth, variant quality, proportion of missing data per site, mean depth per individual, and missing data per individual. This allowed us to determine the threshold for the quality filtering: --remove-indels --max-missing 0.9 --minQ 30 --min-meanDP 10 --max-meanDP 50 --minDP 10 --maxDP 50. Because each iso-Y line originates from a single male and the Y chromosome is supposed to be haploid, heterozygote sites are likely to be duplicated sequences and thus difficult to take into account. We removed the heterozygote sites using the filter command (-e ‘GT=“het”’ option) of bcftools. Note that because Tun83 and Sey81 were sequenced twice, after verification that they were identical, we keep only the data from batch 2 to avoid redundancy in the analyses. The pipeline used (VariantCalling.sh) can be found on the github repository.
We calculate the nucleotide diversity along Y chromosomes per 10-kb windows using the vcftool--window-pi 10000 option.
To investigate the population structure, we performed a PCA on the filtered vcf, using the software plink (v1.9) (Chang et al. 2015). The pairwise distance between strains was calculated using MEGA (Tamura et al. 2021).
All the following analyses on the vcf file were done using R scripts (VariantAnalyses.R on github) using the following libraries: vcfR, SNPrelate, gdsfmt, adegenet, ape, pheatmap, maSigPro, and stringr.
Identification of Corresponding SNPs in the Sister Species and Phylogeny
To identify the corresponding allele in D. melanogaster, D. sechellia, and D. mauritiana, we first needed to identify the corresponding location. To do so, we first created a consensus Y chromosome where SNPs are coding in UPAC code, using bcftools consensus command (with --iupac-codes option). We built a bed file containing the position of each SNP. Using bedtools getfasta command, we extracted 400-bp sequences for each SNP (200 bp on each side of the SNPs) in a fasta file. Then each sequence was blasted against the Y chromosome consensus of D. melanogaster, D. sechellia, and D. mauritiana using blastn (-evalue 1e-20 -qcov_hsp_perc 80 -perc_identity 85 -max_hsps1 -max_target_seqs 1). We output the blast result in a tab delimited format (-outfmt “6 qseqidsseqidevalue length pidentqstartqseqsseq”) and extract the corresponding allele using an R script.
To reconstruct the phylogenetic tree, we first created a fasta sequence with only the SNP for each individual. The SNPs for which we were not able to identify a corresponding allele in the sister species were coded as gaps. We constructed the maximum likelihood tree using the GTR model and ultrafast bootstrap (1,000 replicates) using iqTREE web server (Nguyen et al. 2015). Drosophila melanogaster was used as the outgroup. The scripts used can be found in github: Figure 3/Ancestry.sh and Figure 3/Ancestry.R.
Transposable Element and Complex Satellite Quantification
Due to the batch effect observed, we only used the strain from the second batch for the analysis. To estimate the abundance of transposable elements and complex satellites in each iso-Y line, we first mapped the read against our reference genome. We applied the same pipeline as for the SNP calling, with the exception that we kept multimapping reads (pipeline Mappingt.sh on github). The reference genome was annotated using a custom repeat library (SupFile1.fasta) using repeatmasker (options -no_is -a -inv -pa 20 -div 20) (Smit et al. 2013). Using htseq-count (Putri et al. 2022), we counted the number of reads that map against each repeats and normalize the reads’ count in reads per million (RPM). We removed repeats for none of the strain has an RPM greater than 10. All the subsequent analyses were done using Rstudio. We performed a Wilcoxon test, followed by an “fdr” correction, to determine which repeats have a different enrichment between sensitive and resistant. We calculated the coefficient of variation for each repeat to determine which element should be the most variable; the top 25 is presented in figure 4D. The scripts used can be found in github: TEcount.sh and Figure 4D/TE.R.
k-mer Quantification
Due to the batch effect observed, we only used the strain from the second batch for the analysis. Barring the fourth chromosome (not controlled), only the Y chromosome differs; we thus consider that variations observed between lines are due to the Y chromosome. To estimate the abundance of simple satellites in each strain, we used an assembly-free approach based on k-mer quantification. We used the software k-seek which quantified the simple satellite tandemly repeated using unassembled Illumina reads. We normalized the k-mer count in using the total mapping reads. We removed the k-mers for which none of the strain has a normalized count greater than 5. All the subsequent analyses were done using Rstudio. We performed a Wilcoxon test to determine which k-mers have a different enrichment between sensitive and resistant. Then we performed a correlation test between the k-mer count and the resistance ability for the 11 strains that have been phenotype (fig. 1B and supplementary table S1, Supplementary Material online). The scripts used can be found in github: kmers.sh and Figure 5/Kmers.R.
Gene Copy Number Analysis
Due to the batch effect observed, we only used the strain from the second batch for the analysis.
To estimate the exon copy number in each iso-Y line, we first mapped the reads against our reference genome. We applied the same pipeline as for the SNP calling, with the exception that we kept multimapping reads (pipeline Mappingt.sh on github). We estimated the reads’ coverage on each exon using samtools depth. For the 11 canonical genes, we used a bed file containing the coordinate of each exon on the reference genome based on Chang et al. (2022). For the two ampliconic genes, we blasted the consensus sequences against the reference genome (option -perc_identity 80) to determine the coordinate of each insertion. For each iso-Y line, we calculated the mean coverage of all single copy exons and used it as a normalization factor. To estimate the exon copy number, we calculated the exon mean coverage divided by the normalization factor and multiplied by the number of corresponding exons annotated on the reference genome. The script used can be found in github: Figure 4A/Gene_count.R.
Genotyping and Haplotype Tree
We designed primers around SNPs located on regions annotated as coding regions (Chang et al 2022), as they are the most likely to be unique. For each of them, we performed a PCR with DreamTaq Hot Start Green PCR (Thermo Fisher Scientific, ref K9021) following manufacturer's instructions (hybridization temperature: 58 °C). Each PCR product was sequenced using the Sanger method on a SeqStudio Genetic Analyzer (Thermo Scientific). Only five primer pairs were able to deliver a unique sequence (supplementary table S6, Supplementary Material online), containing 11 SNPs in total (supplementary table S2, Supplementary Material online). We genotyped the sequenced iso-Y lines, to validate our SNP calling, and 86 additional iso-Y lines from 22 populations. Similarly, we genotyped the mt haplotype of the 21 iso-Y lines using two pairs of primers in supplementary table S6, Supplementary Material online.
We concatenated the 11 SNPs for each iso-Y strain in a nexus format and built the haplotype tree by the median joining method using POPart (Leigh and Bryant 2015).
Fluorescence In Situ Hybridization
The FISH was performed using primary probe for (AATGG)n and (AAACAAT)n coupled with sec6 and sec5 adaptors. The sequences for each probe are in supplementary table S7, Supplementary Material online. Sec5 is coupled with Cy5 while sec6 is coupled with Cy3. We dissected brains from third instar larvae in phosphate buffered saline and incubated 8 min in 0.5% sodium citrate. We fixed for 6 min in 4% formaldehyde and 45% acetic acid before squashing. The brains were put between the slide and coverslip and squashed hard before being immersed in liquid nitrogen. After 10 min in 100% ethanol, slides were air dried for at least 1 h before proceeding to the hybridization. For the hybridization, we use 20 pmol of primary probes and 80 pmol of the secondary probes in 50 µl of hybridization buffer (50% formamide, 10% dextran sulfate, and 2X SSC). Slides were heated for 5 min at 95 °C for denaturation and incubated overnight at 37 °C in humid chamber. Slides were then washed three times 5 min with 4X SSCT and three times 5 min with 0.1 SSC before being mounted in SlowFade DAPI. We imaged using LEICA DM5500 microscope and edited the image using Fiji.
Slot Blot
We performed the slot blot for 14 iso-Y strains. We extracted the DNA from 30 adult males using the QIAGEN DNeasy tissue and blood kit. We use 200 ng of DNA for the slot blot. First, the DNA was incubated 10 min in denaturing buffer (0.4 NaOH and 25 mm EDTA) at room temperature then cooled down in ice-cold loading buffer (0.1X SSC and 0.125 N NaOH). The blot was performed using the slot blotter apparatus from BioRad. The membrane was UV crosslinked for 3 min. Hybridization was performed overnight at 42 °C using 15 ml of hybridization buffer (ULTRAhyb, Thermo Scientific) and 100 pmol of primary probes and 200 pmol of secondary fluorescent probes (supplementary table S7, Supplementary Material online). The next day, we washed the membrane three times 15 min using the wash buffer (North2South Hybridization Stringency Wash Buffer, Thermo Scientific). We imaged the membrane using Odyssey XL. For each strain, we made three replicates that were randomly placed on the blot. The intensity of the simple satellite signals was normalized by the intensity of our control gene, rp49.
Supplementary Material
Supplementary data are available at Molecular Biology and Evolution online.
Acknowledgments
This research has been supported by the Centre National de la Recherche Scientifique (UMR9191) and by grants from the Agence Nationale de la Recherche (RESIST ANR-21-CE02-0004-02) and by the National Institutes of Health (NIH) R35GM119515 to A.M.L.
Data Availability
All sequences are available from NCBI SRA under BioProject accession PRJNA905841. All the BASH pipelines and R scripts used in this study are available on github (https://github.com/CourretC/YchromosomesCourret2023.git).
References
