


Abstract
Determining the functional consequences of karyotypic changes is invariably challenging because evolution tends to obscure many of its own footprints, such as accumulated mutations, recombination events, and demographic perturbations. Here, we describe the assembly of a chromosome-level reference genome of the gayal (Bos frontalis) thereby revealing the structure, at base-pair-level resolution, of a telo/acrocentric-to-telo/acrocentric Robertsonian translocation (2;28) (T/A-to-T/A rob[2;28]). The absence of any reduction in the recombination rate or genetic introgression within the fusion region of gayal served to challenge the long-standing view of a role for fusion-induced meiotic dysfunction in speciation. The disproportionate increase noted in the distant interactions across pro-chr2 and pro-chr28, and the change in open-chromatin accessibility following rob(2;28), may, however, have led to the various gene expression irregularities observed in the gayal. Indeed, we found that many muscle-related genes, located synthetically on pro-chr2 and pro-chr28, exhibited significant changes in expression. This, combined with genome-scale structural variants and expression alterations in genes involved in myofibril composition, may have driven the rapid sarcomere adaptation of gayal to its rugged mountain habitat. Our findings not only suggest that large-scale chromosomal changes can lead to alterations in genome-level expression, thereby promoting both adaptation and speciation, but also illuminate novel avenues for studying the relationship between karyotype evolution and speciation.
Introduction
Most species, even closely related species, exhibit differences in terms of their karyotypes (White 1978). This phenomenon, combined with the observation that chromosomal rearrangements can lead to a reduction in the fertility of heterozygous hybrids, suggests that chromosomal changes have the potential to drive speciation (White 1978; King 1993). However, it is difficult to assess the precise influence of karyotypic changes on a genomic scale due to the multitude of evolutionary changes that invariably accompany speciation, such as the accumulation of mutations, recombination events, and demographic perturbations.
Robertsonian translocations (Rb), a primary driver of karyotype evolution, generate metacentric chromosomes by joining two telo/acrocentric molecules at their centromeres (King 1993). Such dramatic karyotypic changes can interfere with genomic stability through synapsis failure or extended recombination suppression with linked isolation-promoting genes. These perturbations could subsequently lead to reproductive isolation (RI) and speciation (for review see Rieseberg [2001] and Garagna et al. [2014]). Recent studies on the muntjac (Yin et al. 2021) and parrot (Huang et al. 2022) have indicated that Rb-induced karyotype evolution frequently accompanies speciation. Yet, different karyotypes generated by Rb can exist within the same species with very little impact on fertility (Rieseberg 2001), a finding that has stimulated a lively debate as to the role of Rb in RI and speciation. It has been postulated that the role that Rb plays in disrupting genomic stability is, to some extent, mediated through gene expression irregularities (Rieseberg 2001). This postulate has received support from the observation that X-autosome translocations may induce sterility via the perturbation of gene expression by impacting the allocyclic behavior of sex chromosomes (involving alterations in the condensation cycle) during spermatogenesis (Ashley 2002). Rb between a sex chromosome and an autosome in the context of the ZW sex-determining system has also provided evidence for disrupted gene expression (Huang et al. 2022). However, this hypothesis is not applicable to autosome–autosome fusions. Moreover, chromosomal rearrangements in muntjac species did not alter A/B compartment structure and topologically associated domains (TADs) near the fusion sites (Yin et al. 2021), bringing into question the importance of Rb in relation to alterations in gene expression.
Rb are pervasive within the Bos species complex with various fusion types being found in different populations, such as rob(1;29), rob(2;28), rob(15;25), rob(16;20), among others, with varying frequencies. Of particular note is rob(2;28), which involved pro-chr2 and pro-chr28, and remains polymorphic among taurine breeds (Tanaka et al. 2000), although it became fixed in gayal (Bos frontalis; fig. 1A; supplementary note SI, Supplementary Material online; Gallagher and Womack 1992; Chi et al. 2005; Ropiquet et al. 2008) on a million-year timescale (fig. 1B; Wu et al. 2018). As an endangered semidomesticated bovine, gayal is distributed specifically in mountainous areas of China, India, Bangladesh, Myanmar, and Bhutan (Simoons 1984). It is characterized by longer and thinner myofibrils and lower lipid content than other plains bovines (Tian et al. 1998). The karyotypic differences between and among the closely related bovine species and breeds provide an ideal model in which to assess the association between Rb and gene expression alterations, as well as the onset of speciation, although previously published gayal draft genomes failed to uncover such an association, probably due to the incompleteness of the assembled genome and the lack of information on architectural features (Wang et al. 2017; Chen et al. 2022).
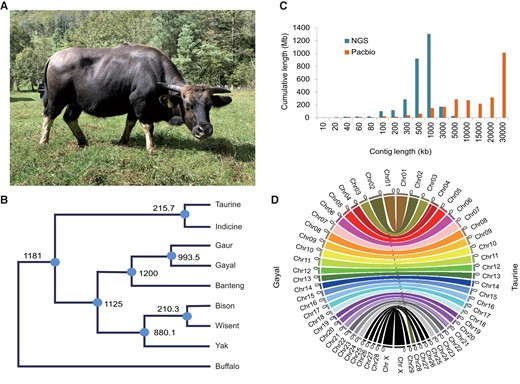
Genome assembly of gayal. (A) Gayal from Gaoligong Mountain, Yunnan, China. (B) Divergence time of bovine complex (in thousands of years, 95% confidence interval included) taken from our previous work (Wu et al. 2018). CI model: complete isolation model; IM model: isolation with migration model. (C) Sequence contig length distribution for genomes assembled from PacBio sequencing data and previous next-generation sequencing (NGS). (D) High-throughput Hi-C to anchor contigs to the 29 pseudochromosomes. Gene synteny between gayal and taurine genomes reveals a Robertsonian translocation, rob (2;28) in gayal.
Herein, we report a chromosome-level genome for gayal assembled from long-read single-molecule real-time (SMRT) sequencing complemented by chromosome conformation capture (Hi-C) technology and transposase-accessible chromatin with high-throughput sequencing (ATAC-seq). This 3D genome sequence provides base-pair-level resolution of the T/A-to-T/A rob(2;28) translocation and reveals a disproportionate increase in the intrachromosomal interactions between pro-chr2 and pro-chr28. Differentially expressed genes (DEGs) on the newly derived chr2, together with genome-level alterations in gene expression, appear to be closely associated with the unique muscle traits of the gayal, an adaptation to the rugged mountainous environment that they inhabit. These findings provide new insights into how Rb can drive phenotypic adaptation that may in turn promote speciation, as well as new information on B. frontalis relevant both to its conservation and the economic improvement of meat quality through breeding programs.
Results
Genome Assembly by SMRT Sequencing and Hi-C
To obtain high-quality DNA, we collected a fresh blood sample from a male gayal from Gaoligong, Yunnan, China (fig. 1A). SMRT sequencing technology (PacBio RSII) yielded approximately 151 gigabases (Gb) of genome sequence data with an estimated depth of 58X. These data were assembled de novo using Canu (Koren et al. 2017) into 2,103 contigs, with a contig N50 of 27.2 megabases (Mb) to obtain the draft genome (supplementary tables S1–S6, Supplementary Material online). We generated approximately 70X Illumina-based short reads to correct sequence errors and to improve single base accuracy to >99.99%. The assembly exhibited much better continuity with much longer contig lengths than the previous version constructed by shotgun genome sequencing (Wang et al. 2017; fig. 1C). We tested for the presence of 9,226 conserved mammalian Benchmarking Universal Single-Copy Orthologs (BUSCO) genes, of which 8,989 (97.5%) were annotated in our assembly, including 8,917 intact genes (96.7%) (supplementary tables S6, Supplementary Material online). These results confirmed the high accuracy and integrity of this genome sequence. To construct chromosome-scale scaffolds, we used approximately 186 Gb of high-throughput clean Hi-C data derived from the same individual’s blood both to order and connect the contigs (supplementary table S7, Supplementary Material online). The final assembly included 29 super-scaffolds representing all chromosomes and occupied 97.54% (958) of the genome with a total length of 2.57 Gb (supplementary table S7, Supplementary Material online). We performed genome annotation by using de novo and homology-based methods. The nonredundant reference gene set identified 24,835 protein-coding genes (supplementary tables S8–S11, Supplementary Material online). We retrieved gene families for the MHC (major histocompatibility complex) and olfactory receptors (ORs), the size of which is commonly underestimated using whole-genome shotgun strategies (Wang et al. 2016). Comparable gene numbers in gayal, taurine (Bos taurus) and buffalo (Bubalus bubalis) further supported the high quality of the current gayal genome assembly (supplementary note SII and figs. S1 and S2, Supplementary Material online).
Characteristics of the Robertsonian Translocation
The chromosome-scale genome assembly enabled a chromosome-to-chromosome collinearity assessment of gayal against both taurine (2n = 60) and yak (2n = 60). This yielded base-pair level resolution of rob(2;28) (the longest chromosome) in the lineage leading to gayal (figs. 1D and 2A; supplementary fig. S3, Supplementary Material online), a distinct species (2n = 58) rather than a hybrid of gaur (Bos gaurus; 2n = 56) and taurine (B. taurus; 2n = 60) (supplementary note SI, Supplementary Material online). A significantly elevated proportion of long repetitive fragments (>1 kb) occurred at the telomeres (supplementary fig. S4, Supplementary Material online), constituting a telo/acrocentric-rich karyotypic background (fig. 2B). This was therefore comparable to the ancestral karyotypes of the common shrew and house mouse, where T/A-to-T/A fusion events frequently occurred (fig. 2C; Kalitsis et al. 2006; White et al. 2010; Garagna et al. 2014). Abundant bovine-specific heterochromatin marker satellite DNA 1.715 (Sat-1.715) occurred in the fusion region of gayal chr2 (fig. 2D) and in one telomere of both taurine chr2 and chr28, and yak chr2 and chr26, which were orthologous to pro-chr2 and pro-chr28, respectively (fig. 2E). The Sat-1.715 DNA distribution in yak was clearly indicative of a T/A-to-T/A fusion, whereas the corresponding data appeared to be conflicting in the taurine. To address whether this conflict could have been due to centromere repositioning, we assessed the Sat-1.715 DNA distribution in other chromosome-level bovine genomes. As illustrated in figure 2E and supplementary figures S5 and S6, Supplementary Material online, the Sat-1.715 DNA distribution of chr28 varied between different individuals. It was demonstrated to be a T/A-to-T/A fusion in a Hereford (UCD1.2), an African N’Dama, and a Brahman indicine, whereas it was disproven in a Hereford (UMD3.1) and an African Ankole. Taken together, in spite of the centromere polymorphism in taurines, the distribution of Sat-1.715 DNA in equivalent pro-chr2 and chr28 of both indicine and yak supported a “T/A-to-T/A” fusion by comparison with the ancestral state.
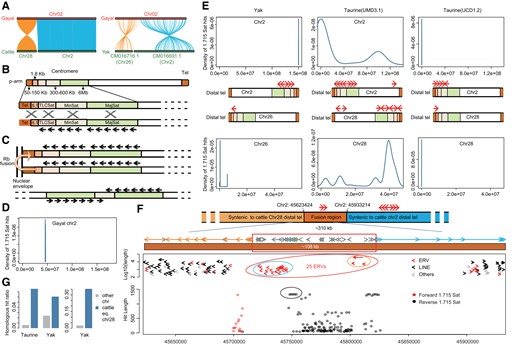
Base-pair-level resolution of gayal rob(2;28). (A) Collinearity relationship of gayal chr2 against taurine and yak. (B) Sequence composition and organization of the telo/acrocentric chromosome (exemplified by M. musculus domesticus) with homogenization through illegitimate recombination between nonhomologous chromosomes. (C) Assumed formation of an Rb fusion metacentric chromosome with symmetrical contribution of minor satellite sequences from each of the involved chromosomes as illustrated by M. m. domesticus. (D) Metacentric chr2 of gayal indicated by Sat I. (E) Potential centromeric region of chromosomes corresponding to rob(2;28) in taurine and yak. The region is indicated by Sat-1.715 DNA, a useful marker of centromeric heterochromatin blocks in bovine chromosomes. The red arrow indicates the orientation of Sat-1.715 DNA with high-quality blast (>1.3 kb); counts were proportional to blast hits. (F) Compositional characteristics within the fusion regions and surrounding areas. Red arrow indicates the orientation of Sat-1.715 DNA with high-quality blast (>1.3 kb); counts were proportional to blast hits. In the amplified approximately 310 kb fusion region, the dark orange, sky blue, and grey arrows cover fragments syntenic to taurine chr28, chr2, and other chromosomes with 1-kb window sizes, respectively. The lower rectangle represents the fusion region, whereas the upper panel shows the location of the repetitive fragments. The red ellipse encloses the 25 ERVs located in the core fusion region (∼108 kb). The lower panel shows all blasted Sat-1.715 DNA with different matched lengths denoted by the y-axis and the opposite orientations denoted by red (reverse) and black (forward). The black ellipse encloses the five intact copies of Sat-1.715 DNA that are distributed tandemly and overlap with taurine chr2 and chr28 in the opposite orientation. (G) Ratio of the number of homologous hits within fusion-syntenic regions to the total number of hits within 10 Mb telo/acrocentromeric regions (left). The positional information corresponding to the fusion-syntenic region is presented in supplementary table S12, Supplementary Material online. Considering the potential influence caused by the assembly quality of yak, the fusion-syntenic region of taurine equivalent chr2 was extensively scanned (the whole 10 Mb of the telo/acrocentromere) (right).
Collinearity analysis employing a 10-kb window size against the taurine revealed an approximately 310 kb-long fusion region (fig. 2G), with an overrepresentation of large endogenous retrovirus (ERV) repeats (fusion 31.45% compared with chr2 15.67%, and genome 15.43%; χ2 test P = 1.7×10⁻⁴, and 1.2×10⁻⁴, respectively) and underrepresentation of long interspersed nuclear elements (LINEs; fusion 48.39% vs. chr2 56.55%, and genome 56.36%). The proportions of LINEs were slightly higher within 1 Mb flanking regions (left: 58.01%, right: 64.41%; χ2 test P = 8.1×10⁻³). Based on a shorter 1-kb window size, this fusion was narrowed down to an approximately 108-kb region that contained no repetitive elements apart from 25 ERVs (fig. 2G; χ2 test P = 2.4×10⁻¹³). These ERVs formed two clusters that were homologous to ERVs from pro-chr2 and pro-chr28, respectively (fig. 2G and supplementary fig. S7, Supplementary Material online). They were interspersed in two opposite 1.715-Sat DNA clusters, where a 5.8-kb fragment, comprising five intact tandemly repeated copies of 1.715-Sat DNA, overlapped considerably with taurine chr2 and chr28 in the opposite orientation (fig. 2G). It has been predicted that Rb could occur through a nonallelic recombination event resulting from sequence homogenization between telo/acrocentric centromeres on different chromosomes (Garagna et al. 2014). We further assessed the sequence similarity between different chromosomes in the taurine and yak. By scanning the distal end within the first 10 Mb region, the approximately 2.5–3 Mb fragment of taurine chr28 (syntenic to the left side of the fusion region) was found to exhibit significantly more nonallelic homogenization with the approximately 0–1 Mb fragment of chr2 (syntenic to the right side of the fusion region), compared with the other autosomes (χ2 test P = 2.2×10⁻¹³; fig. 2F; supplementary table S12, Supplementary Material online). Parallel homogenization also consistently occurred in the telo/acrocentric region of yak chr26 relative to yak chr2 (χ2 test P = 3.2×10⁻⁵; supplementary note SII, Supplementary Material online). These features provided strong support for the postulate that rob(2;28) was mediated by a nonallelic recombination event.
Although no discrepancies appeared in terms of the size, strand, and GC content, a high gene density was apparent at the distal telomere (10-Mb region) of taurine chr28 (chr28:78 out of 355 genes, 21.97%; other autosomes: 2,327 out of 24,204 genes, 9.61%; χ2 test P = 1.5×10⁻¹⁴), which was consistent with the previous demonstration that evolutionary breakpoint regions are gene rich in rodents (Capilla et al. 2016). In similar vein, significant gene enrichment occurred in yak chr26 telomere (chr26: 83 out of 352 genes, 23.58%; other autosomes: 2,428 out of 22,047 genes, 11.01%; χ2 test P = 2.3×10⁻¹³).
Legacies of Selection on the Newly Derived chr2
It has been widely assumed that fusion regions form large nonhomologous fragments that result in reduced recombination and hindered gene flow, leading eventually to speciation (Rieseberg 2001). Thus, we integrated 39 gayal individuals (Yunnan, China: n = 13; Tibet, China: n = 7; India: n = 5; Bangladesh: n = 14; fig. 3A; supplementary table S13, Supplementary Material online) to scan for footprints of selection from other bovids in homologous regions. The inconsistency noted between phylogenies derived from autosome and mitochondrial data were indicative of pervasive introgression (fig. 3BandC). For example, some gayal mitochondrial genomes clustered with taurine (B. taurus), indicine (Bos indicus), or yak (Bos grunniens), whereas their nuclear genomes displayed closer relationships with conspecific individuals from different regions (fig. 3B). This pattern is likely due to mitochondrial introgression. ADMIXTURE analyses predicted that nearly half of the Tibetan gayal genome and some Yunnan gayal individuals harbored ancestral polymorphism from local domestic taurine/indicine breeds (fig. 3D, supplementary figs. S8–S10, Supplementary Material online). We further inferred local ancestry using RFMix (Maples et al. 2013). Perhaps surprisingly, the fusion region showed no resistance to genetic introgression (mean introgression proportion: 0.204; fig. 3E), which is inconsistent with the notion of an introgression barrier. Furthermore, the fusion region did not contribute to a reduced recombination rate in gayal, whereas the indicine exhibited a slightly decreased recombination rate in homologous regions. This could be due to the presence of recombination cold spots in both subtelomeric regions (Barton et al. 2008; fig. 3FandG). Thus, these observations failed to provide support for a role for Rb in speciation that was specifically mediated through defects in meiosis or suppression of recombination.
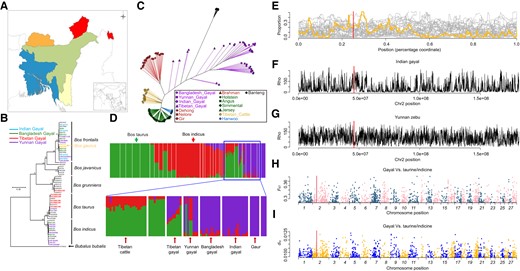
Population genomic analysis. (A) Geographical distribution of the gayal. (B) Phylogenetic tree constructed using mitochondrial genomes. (C) Neighbor-joining network built from an IBS distance matrix using autosomal SNPs. (D) ADMIXTURE analysis has best K = 3. Details are given in supplementary figure S9, Supplementary Material online. (E) Genetic introgression between gayal and taurine cattle; (F) recombination rate within zebu (indicine) of Yunnan, China; (G) recombination rate within Indian gayal; (H) FST distribution across the gayal/taurine genomes; and (I) dxy distribution across the gayal genomes. The red line denotes the core region of Rb.
Despite moderate introgression in the fusion region, the entire chr2 exhibited significantly less introgression than other parts of the genome from taurine and indicine species (mean introgression proportion of chr2: 0.112, genome: 0.148, Kolmogorov–Smirnov test P < 2.2×10⁻¹⁶; fig. 3E), indicating an ongoing accumulation of reproductive barriers. Permutation tests confirmed this on the newly derived chr2 compared with the genomic background (supplementary fig. S12, Supplementary Material online). This reduction was particularly evident on pro-chr2, where extremely low levels of genetic introgression occurred (mean introgression proportion of pro-chr28: 0.138, pro-chr2: 0.103, Kolmogorov–Smirnov test P < 2.2×10⁻¹⁶), compared with other chromosomes (fig. 3E).
Consistent with its relative resistance to genetic introgression, the entire chr2 displayed significantly higher FST values (gayal vs. taurine/indicine) than the genome as a whole (0.1894 ± 0.0398 vs. 0.1803 ± 0.0406, Wilcoxon test, P < 2.2×10⁻¹⁶; fig. 3H). This was especially true for pro-chr2 (pro-chr28: 0.1866 ± 0.0388, pro-chr2: 0.1904 ± 0.0400; Wilcoxon test, P = 4.2×10⁻⁴). When we focused on windows with extreme differentiation (FST > 99% quartile), chr2 also harbored a significantly higher proportion of these (chr2: 1.29% windows, genome: 0.98% windows; χ2 test, P = 5.9×10⁻³). Because a higher FST could arise from reduced pairwise nucleotide diversity within a population, the significance of the higher differentiation of chr2 was confirmed by interspecific pairwise comparisons of nucleotide divergence (dxy) (gayal diverged from both taurine and indicine) (0.0075 ± 0.0012 vs. 0.0072 ± 0.0014, Wilcoxon test, P < 2.2×10⁻¹⁶; fig. 3I). For windows with extreme divergence (dxy >99% quantiles), chr2 harbored a disproportionate abundance of windows with the highest dxy values (chr2: 1.70% windows, genome: 0.96% windows; χ2 test P = 2.4×10⁻⁹). Thus, divergence was more uniformly distributed along chr2, a phenomenon commonly seen in sex chromosomes (Ellegren et al. 2012), implying a potential role for this chromosome in speciation.
Evolutionary Changes in Gayal Influenced by Robertsonian Translocation
Since the fusion region exhibited neither reduced recombination nor hindered gene flow that could have contributed to speciation, we investigated various other factors that might have the potential to account for the high diversity evident in gayal chr2. Theoretically, rob(2;28) would markedly shorten the physical distance between pro-chr2 and pro-chr28. This would significantly increase interactions on gayal chr2, as the number of intrachromosomal interactions (within translocated chr2) has been reported to be several orders of magnitude greater than interchromosomal interactions (between pro-chr2 and pro-chr28; Lieberman-Aiden et al. 2009). To investigate the interaction discrepancy associated with the karyotypic variation, we compared our gayal (2n = 58) blood Hi-C data with taurine (2n = 60) ear skin Hi-C data (accession number GSM5110924), since there were no available taurine blood Hi-C data. To avoid potential interference caused by differences in tissue type and data resolution, we estimated the ratio of intrachromosomal interactions over the entire genome for both gayal and taurine, using the gayal genome as a reference. Linear regression between gayal and taurine indicated no discrepancy for most chromosomes, with chr2 standing out as the sole outlier (fig. 4A; Bonferroni adjusted P value = 0.002), with a significantly higher ratio in gayal (gayal: 0.076; taurine: 0.068). This discrepancy on chr2 was also confirmed by comparison with the rest of the genome for both gayal and taurine (χ2 test; P = 5.4×10⁻⁶).
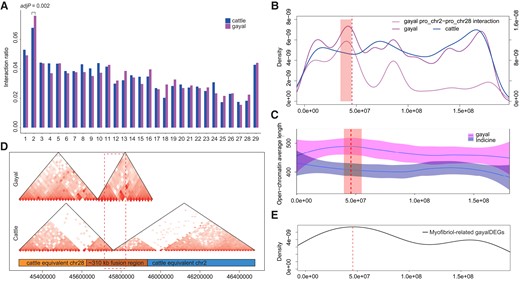
Architectural comparisons between gayal and taurine. (A) The ratio of intrachromosomal interactions over the entire gayal and taurine genomes, using the gayal genome as a reference. (B) Interaction density along gayal chr2. The right-hand axis represents the density of interactions crossing pro-chr2 and pro-chr28. The red dashed line denotes the fusion site. The light red rectangle denotes the 15 windows with top P value for studentized residuals. (C) Average length of open-chromatin state along gayal chr2. The red dashed line denotes the fusion site. The light red rectangle denotes the 5 windows with top P value for studentized residuals. (D) TAD spanning the fusion region. (E) Distribution of myofibril-associated gayal DEGs on gayal chr2.
We next scanned the interaction density of gayal and taurine separately along chr2, to ascertain whether or not the interaction discrepancy was evenly distributed. By regressing the window-sized density curve in a linear model, regions upstream of the fusion site were found to exhibit the greatest abundance in gayal, spanning windows with the top 15 P values for studentized residuals (ranging from 0.0239 to 0.0278; fig. 4B), although they did not remain significant after Bonferroni correction. To further investigate whether the interaction abundance near the fusion site was ancestral in pro-chr28 or newly derived after rob(2;28), we paid special attention to the interactions that crossed between pro-chr2 and pro-chr28. In gayal, 11.5% of chr2 interactions occurred across pro-chr2 and pro-chr28, whereas only two such interactions (0.1%) were detected in the taurine. The distribution of these interactions between pro-chr2 and pro-chr28 paralleled that of all gayal chr2 interactions, with a density peak upstream of the fusion site (fig. 4B). It is well recognized that chromatin interactions serve to establish long-range enhancer–promoter or boundary element interactions. Therefore, the abundant interactions observed in gayal are very likely to have increased enhancer–promoter interactions, thereby influencing the open-chromatin state. We then obtained ATAC-seq data for the longissimus dorsi muscle from each of three male adults for gayal and Gaofeng indicine, and determined the average length of the open-chromatin region along gayal chr2, with a nonoverlapping 5-Mb window. Similarly, regions near the fusion site showed the greatest discrepancy calculated in a linear regression model, although this was not significant (fig. 4C).
Since the newly derived chr2 exhibited special architectural features in the 2n = 58 karyotype compared with that of the 2n = 60 karyotype, especially in regions around the fusion site, it was of interest to investigate the remodeling of functional epigenetic domains within the fusion region that occurred after rob(2;28). With a normal resolution of 40 kb, we identified a TADs spanning chr2:45680000–45960000, which covered the approximately 108 kb core fusion region (chr2:45715007-45823168). Meanwhile, we identified two domains in taurine, which served to separate this region into two parts. The first spanned chr2:45280000–45760000, whereas the other spanned chr2:45760000–46480000 (fig. 4D). We also determined the TAD of gayal with a more precise resolution of 10 kb; again a domain spanning the core fusion region was identified (chr2:45710000–45890000). Taken together, these results suggested an altered chromatin state for the derived 2n = 58 karyotype by comparison with the ancestral 2n = 60 karyotype.
The combination of this altered chromatin state with increased intrachromosomal interactions might have influenced the expression of genes located within pro-chr2 and pro-chr28, although the precise nature of the regulatory mechanisms that could serve as a link between genome topology and gene expression remains controversial (Ghavi-Helm et al. 2019). Taurine equivalents to chr2 and chr28 were found to contain a disproportionate number of myofibril-associated genes (χ2 test P = 0.33, P = 6.6×10⁻⁵, respectively). Considering that muscle traits would be largely influenced by age, sex, and muscle type, we obtained data on the gene expression landscape of available longissimus dorsi muscle (matched ATAC-seq data) from four gayals, three Simmental taurines, three Aberdeen-Angus taurines, and three cattle–yak hybrids, all aged 18–20 months. By separately comparing gayal with Simmental, Aberdeen-Angus, and cattle-yak hybrids, we identified differentially expressed orthologous genes specific to gayal (gayal DEGs).
Compared with the gayal DEGs on the other chromosomes, gayal DEGs on taurine equivalents chr2 and chr28 were disproportionately likely to be upregulated in gayal (χ2 test P = 0.020, P = 2.2×10⁻⁴, respectively). The top-50 expressed orthologs on taurine chr2 were mostly enriched in pathways associated with myofibril components (supplementary table S14, Supplementary Material online), for example “myofibril” (adj P = 1.4×10⁻³), “contractile fiber” (adj P = 1.7×10⁻³), and “axial muscle weakness” (adj P = 1.3×10⁻⁴). The top-50 expressed orthologs on taurine chr28 had very similar enrichment profiles viz. “myofibril” (adj P = 1.6×10⁻⁶), “contractile fiber” (adj P = 2.2×10⁻⁶), and “striated muscle cell development” (adj P = 5.0×10⁻⁵) (supplementary table S14, Supplementary Material online). Therefore, it was reasoned that gayal DEGs on gayal chr2 were enriched in myofibril-associated pathway-associated genes (χ2 test P = 1.5×10⁻⁴), with corresponding overrepresentation of categories such as “muscle structure development” (adj P = 3.6×10⁻⁴) and “sarcomere” (adj P = 3.9×10⁻⁴) (supplementary table S14, Supplementary Material online). Interestingly, the distribution of these myofibril-associated gayal DEGs on chr2 showed a peak near the fusion region (fig. 4E), precisely where the greatest discrepancy of interaction density and open-chromatin length had been observed (fig. 4BandC). Among these myofibril-associated gayal DEGs, TTN and NEB were of particular note as they encode, respectively, the giant muscle proteins titin and nebulin, major components of the sarcomeric cytoskeleton (Schiaffino and Reggiani 2011). TTN was covered by dense interactions (28 interactions) in the gayal but none in the taurine. TTN exhibited >10-fold higher expression than the taurine (supplementary table S15, Supplementary Material online), but a 50% reduction in expression when compared with cattle–yak hybrids. Although NEB was covered by the same single interaction fragment in both gayal and taurine, it exhibited consistently higher expression in gayal (supplementary table S15, Supplementary Material online).
Structural Variants and Gayal Myofibril Evolution
The significantly increased expression of TTN and NEB in gayal strongly suggests that the rob(2;28) has contributed to the evolution of gayal myofibrils by modulating gene expression. Assuming the rapid evolution of muscle traits in gayal, many genes involved in muscle components and muscle development are likely to have accumulated variants by genome hitchhiking (Nosil and Feder 2012). Structural variants (SV) represent the least well-characterized type of genetic variation but are much more likely to affect gene function than single nucleotide variants (Kronenberg et al. 2018). Therefore, we also compared the SVs between gayal and taurine, and assessed their influence on the evolution of muscle traits in gayal.
Analyses using smartie-sv (Kronenberg et al. 2018) on our whole-genome alignment identified 56,315 insertions and 40,664 deletions (indel size >50 bp) that occurred since the divergence of gayal and taurine (fig. 5A). Genes with upstream indels were disproportionately likely to be gayal DEGs compared with other genes (χ2 test, P = 3.5×10⁻⁴) and showed significant expressional differences that were specific to gayal (fig. 5B). We retrieved 702 gayal DEGs with upstream indels and focused on the top-50 genes with the largest expressional changes specific to gayal. Interestingly, these genes exhibited significant enrichment in those categories associated with muscle traits, such as “muscle system process” (adj P = 4.7×10⁻⁴; fig. 5C), “muscle contraction” (adj P = 0.014), and “myofibril” (adj P = 0.037; supplementary table S16, Supplementary Material online). To illustrate more precisely how genetic variation likely underpinned the evolution of the gayal longissimus dorsi muscle, we partitioned the gene components expressed in skeletal muscle into two different compartments: 1) the sarcomere components that form the myofibrils and 2) the components fulfilling contractile functions, which might serve to reduce muscle fatigue.
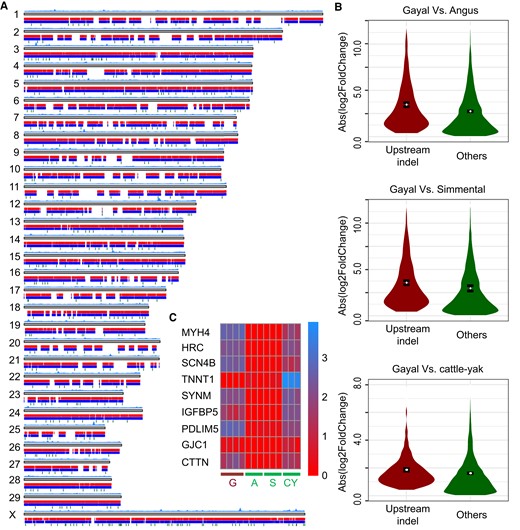
Analysis of SV. (A) Landscape of SV identified by comparing the gayal and taurine genomes. (B) Genes harboring upstream indels and exhibiting significantly greater expression differences in each comparison. (C) Heatmap of expression values of nine gayal DEGs with enrichment in muscle-associated categories, and harboring upstream indels. Expression values were transformed by log10(FPKM + 1). Capitals “G,” “A,” “S,” and “CY” represent gayal, Angus, Simmental, and cattle–yak hybrid, respectively.
Sarcomere Components
We checked myosin heavy-chain isoforms that comprise fiber types for SV and expression discrepancies. Many indel variants were interspersed in the myosin heavy-chain gene cluster (supplementary fig. S16, Supplementary Material online), which includes MYH1, MYH2, MYH3, MYH4, MYH8, and MYH13. Fast-type myosin heavy-chain isoforms were encoded by MYH1, MYH2, and MYH4. Of these, MYH1, which encodes the MyHC-2X isoform, exhibited the highest expression level of all myosin heavy-chain coding genes in gayal; indeed, it was consistently higher than in Aberdeen-Angus, Simmental, and cattle–yak hybrids (adj P = 1.2×10−83, 4.3×10−83, and 1.6×10⁻³, respectively). A similar pattern was observed for MYH4, which encodes the MyHC-2B isoform (having the highest kinetics of stretch activation), with abundant expression in gayal, almost no expression in Aberdeen-Angus and Simmental (adj P = 1.3×10−61 and 1.4×10−61), and moderate expression in cattle–yak hybrids (adj P = 3.1×10⁻¹³; fig. 6). In contrast, MYH2 (MyHC-IIA) showed no differences that were specific to gayal. MYH3 and MYH8, whose combined expression is required for the synthesis of fast fibers, also exhibited consistently higher expression in gayal. This coincides with the consistently higher level of expression of MYL1 and MYL11 in gayal, both of which encode fast-type myosin light-chain isoforms. In stark contrast, genes encoding either slow-type myosin heavy-chain isoforms or slow-type myosin light-chain isoforms, displayed no expression differences that were specific to gayal (fig. 6).
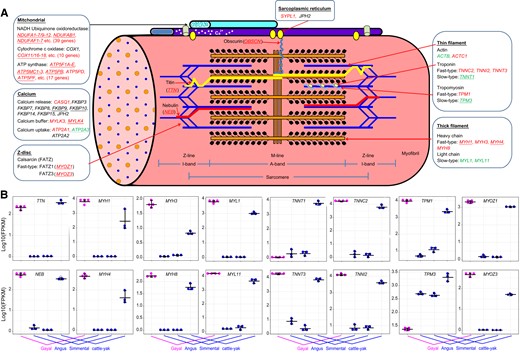
Evolution of genes associated with muscle fibers in the gayal. (A) Illustration of striated muscle sarcomeres. Molecular components that exist in multiple isoforms with differential distribution in fast- and slow-type fibers. Genes displaying higher expression specific in gayal muscle are marked in red; genes marked in green exhibit a lower expression level in the gayal. Underlined genes harbor SV. (B) Significant differential expression of genes in the longissimus dorsi muscle of gayal and other bovids.
Many other functional compartments of the myofibril displayed fast-type preference in gayal. For example, troponin and tropomyosin, the major components that regulate contraction by controlling the interaction of myosin and actin, exhibited a diverse range of SV. Indels occurred in TNNT1, which encodes slow-type troponin-T, and which was decreased significantly in gayal (fig. 6). Meanwhile, TNNC2, TNNI2, and TNNT3 that encode fast-type troponin-C, -I, and -T, respectively, exhibited consistently increased expression levels in gayal (fig. 6). In parallel, the gene encoding slow-type tropomyosin-α, TPM3, displayed lower expression in gayal, whereas TPM1, the gene encoding fast-type tropomyosin-α, was consistently upregulated (fig. 6). Moreover, a preference for fast-type components was apparent with the sarcomere Z-line, such as the upregulation of MYOZ1 and MYOZ3, which encode fast-type FATZ1 (calsarcin-2) and FATZ3 (calsarcin-3); both genes had indel variants. A third calsarcin-encoding gene, MYOZ2, showed no differences that were specific to gayal. Paralleling the accumulation of fast-type fibers, a panel of genes associated with mitochondrial energy metabolism tended to exhibit higher levels of expression specific to gayal (fig. 6A; supplementary table S17, Supplementary Material online).
Muscle Fatigue Resistance
Because fast-type fibers are prone to fatigue (Schiaffino and Reggiani 2011), we investigated genes involved in calcium transients to examine the molecular basis of resistance to fatigue in gayal.
With respect to calcium release, no difference was observed for the calcium release channel (RyR) encoding genes, but CASQ1, which influences RyR channel activity, was dramatically increased in the gayal; this was in accord with the common pattern of an increased amount of calcium released in fast rather than in slow fibers (Schiaffino and Reggiani 2011; supplementary table S17, Supplementary Material online). We also noted significant expressional variation of the FKBP (FK506-binding protein) genes (including FKBP3/7/8/9/10/14/15) that bind directly to RyR and modulate calcium channel activity, and JPH2 that encodes junctophilin 2, a subunit of membrane junctional complexes, which plays a role in conferring resistance to muscle fatigue (Schiaffino and Reggiani 2011).
For calcium buffering, a significant increase in the expression of both MYLK4 (10 indels) encoding myosin light-chain kinase family member 4 and MYLK3 encoding myosin light-chain kinase 3 (supplementary table S17, Supplementary Material online) are suggestive of enhanced muscle force generated by increased myosin phosphorylation, which represents a useful mechanism for counteracting the rapid reduction in force caused by fatigue.
For calcium uptake, we detected significant expressional variation of SERCA pump-encoding genes (including ATP2A1/2/3). A consistent upregulation of ATP2A1 and a consistent downregulation of ATP2A3 (1 indel), combined with the varied expressional direction of ATP2A2 (1 indel), indicated pronounced diversity in terms of calcium leakage that would be relevant to muscle fatigue (Schiaffino and Reggiani 2011). We also detected a consistent upregulation of the gene encoding mitochondrial calcium uniporter, MCU (2 indels), which would be expected to influence cytosolic calcium homeostasis.
Discussion
Our base-pair-level resolution of rob(2;28) revealed several characteristics that may confer susceptibility to Rb. First, the fusion region encompasses clusters of ERV and 1.715-Sat DNA, although LINEs are absent (fig. 2G). This pattern could not be readily explained in terms of the disappearance of telo/acrocentric sequences following Rb, as short repetitive fragments are preferentially lost (Garagna et al. 2014). ERVs were evenly distributed along the entire lengths of pro-chr2 and pro-chr28 but were found to be specifically clustered in the fusion region implying their possible involvement in promoting Rb. The loss of 1.715-Sat DNA on pro-chr28 tended to be more dramatic than on pro-chr2 (supplementary note SII, Supplementary Material online), indicative of the nonsymmetric maintenance of telo/acrocentric sequences after Rb. Second, homogenization occurred in the nonallelic telomeric regions of taurine chr28 versus chr2, and yak chr26 versus chr2, including a 5.8-kb fragment that overlaps between the telomeres of taurine chr2 and chr28 (fig. 2FandG; supplementary fig. S6, Supplementary Material online). This may have induced rob(2;28) through a nonallelic recombination event. Third, significant gene enrichment was found to have occurred at the distal telomere of taurine chr28. It has long been known that high transcriptional activity with open-chromatin conformation can facilitate chromosome rearrangement (Farré et al. 2015). However, we did not observe any enrichment of open chromatin at the distal telomere of taurine chr28. This could be due in part to the tissue-specific expression pattern. Taken together, we conclude that nonallelic homogenization in telo/acrocentric regions harboring massive repetitive clusters may have facilitated Rb during the prophase of the first meiotic division via aberrant recombination, when the telo/acrocentric regions associate closely with each other on the nuclear envelope. One caveat, which may have influenced our conclusions about Rb characteristics, is the completeness of the fusion region assembly. Indeed, there was one gap (chr2:45755762–45755861) along the approximately 310 kb fusion region. This notwithstanding, we detected a TAD spanning from 45,680,000 ± 40,000 to 45,960,000 ± 40,000, which covered the approximately 108 kb core fusion region (chr2:45715007–45823168) and this gap. We assessed the TAD of gayal with more precise (10 kb) resolution and again a domain spanning this gap was identified (from 45,710,000 ± 10,000 to 45,890,000 ± 10,000). In contrast, we identified two domains in the taurine, which separated this fusion region into two parts, one spanning 45,280,000 ± 40,000 to 45,760,000 ± 40,000, the other from 45,760,000 ± 40,000 to 46,480,000 ± 40,000. This gap was located precisely at the boundary of these two domains. Additionally, a window covering this gap exhibited a moderate recombination rate (Rho = 15.8) and introgression level (nongayal proportion = 0.2). Therefore, this gap was not overly long and hence should not have impacted our conclusions. This notwithstanding, further telocentric-to-telocentric genome sequence data are likely to provide additional insights into the local DNA sequence architecture that could have induced/facilitated Rb.
Rb-induced karyotype variance is frequently observed among relatively diverged species (Yin et al. 2021; Huang et al. 2022). This has provided support for the hypothesis that Rb can lead to RI through meiotic failure such as delayed synapsis/absence of synapsis prior to the initiation of speciation (Garagna et al. 2014). Yet Rb remain polymorphic in the taurine (Tanaka et al. 2000; Chaves et al. 2003) and house mouse (Garagna et al. 2014), which weakens the case for their involvement in RI. Rieseberg (2001) put forward an alternative hypothesis whereby rearrangements reduced gene flow by suppressing recombination and extending the effects of linked isolation-promoting genes rather than by reducing fitness. This postulate has received some support from the observation of increased suppression of recombination around the centromeres of Rb heterozygotes in mice (Davisson and Akeson 1993; Giménez et al. 2013). Pervasive introgression occurred in gayal, consistent with the observation that female interspecific hybrids possessing a variable number of chromosomes (2n = 58 or 59) are fertile (Qu et al. 2012). This ongoing RI provided an ideal model with which to test the role of Rb. However, we observed no reduction in the recombination rate or introgression within the fusion region of gayal (fig. 3EandF), let alone extension to linked isolation-promoting genes as would be expected if Rb were to promote speciation through recombination suppression. Therefore, other changes that accompanied the Rb deserve closer attention, for example, Rb-induced architecture variation and the corresponding gene expression changes.
So far, the potential link between Rb-induced architecture variation and gene expression changes remains largely unknown. Here, we have shown that a disproportionate increase in the number of long-distance interactions occurred on the derived chr2 (fig. 4AandB). In line with this enrichment of interactions, open-chromatin status varied considerably across the newly derived chr2 (fig. 4C). This may have contributed, at least in part, to the irregularity of the impact of chromosome architectural changes on gene expression. Actually, gayal DEGs on chr2 tended to be upregulated. Intriguingly, myofibril-related genes are overrepresented on both taurine chr28 and gayal chr2. Furthermore, we detected pervasive changes in gayal chr2 associated with myofibrils, with a tendency to accumulate fast-type fibers. Significantly, two of the genes that encode the three giant proteins of the sarcomere scaffold (TTN and NEB, but not OBSCN) are located on gayal chr2 and showed increased expression, which may be associated with the longer sarcomere length characteristic of gayal (Tian et al. 1998). Similarly, the banteng (Bos javanicus), another bovine species with fixed rob(2;28), also showed distinctive muscle traits with thin fibers (personal communications).
The gayal diverged from yak about 1.125 Ma (Wu et al. 2018), coinciding with one of the two Pleistocene uplift events in the East Himalayan syntaxis (1.10 ± 0.24 Ma) (Lei et al. 2008). A Rob(2;28)-induced expression alteration that promoted a slow-to-fast muscle switch may thus have enabled an increase in climbing ability in the gayal’s rugged mountain habitat and hence could have been a key environmental adaptation for this species. In this setting, these alterations in muscle gene expression would have been driven by selection. The right arm of the newly derived chr2 exhibits a low recombination rate, a low extent of introgression, and a high degree of DNA sequence differentiation (fig. 3E–I), a chromosome-scale discrepancy commonly seen in sex chromosomes (Coyne 1992). This large but incomplete region exhibiting differentiation accords with the genic view of speciation, as gene flow is gradually reduced owing to expanded linkage with differentially adapted loci following the onset of speciation (Wu and Ting 2004). Following rob(2;28), the gayal genome appears to have gradually accumulated sequence changes that served to increase gene expression in fast-muscle fibers and reduce it in slow-muscle fibers, leading to increased resistance to muscle fatigue (fig. 6), following the notion of genomic hitchhiking (Nosil and Feder 2012). Therefore, we hypothesize that rob(2;28) drove the expressional alterations that gave rise to the muscle fiber changes that allowed the gayal to become well adapted to its montane environment, where the Himalayan syntaxis led to the separation and isolation of gayal from other species of Bos. This may also explain the polymorphism of rob(2;28) in the European taurine breeds, owing to the absence of geographic segregation.
Taken together, our results indicate that an influence of Rb on either meiotic dysfunction or recombination suppression does not provide a convincing explanation for the RI that leads to speciation. Rather, it would appear that Rb serves to alter the expression of genes located on translocated chromosomes through chromatin remodeling, impacting long-distance interactions, and open-chromatin status. If the altered gene expression then drives functional differentiation that in turn facilitates adaptation to a geographically newly isolated habitat, then the corresponding Rb should become rapidly fixed through positive selection, which appears to have been the case in gayal.
Materials and Methods
Genome Sequencing
Genomic DNA was extracted using DNeasy Blood & Tissue Kit (Qiagen) and sheared using a g-TUBE device (Covaris) with 20 kb settings. Sheared DNA was purified and concentrated with AmpureXP beads (Agencourt) and used for SMRT bell preparation according to the manufacturer’s protocol [Pacific Biosciences; 20-kb template preparation using BluePippin size selection (Sagescience)]. Size-selected and isolated SMRT bell fractions were purified using AmpureXP beads (Beckman Coulter, Inc.). Finally, purified SMRT bells were used for primer (V3)-and polymerase (2.0) binding according to the manufacturer’s binding calculator (Pacific Biosciences). Single-molecule sequencing was performed on a PacBio Sequel system yielding a total of 16,978,079 filtered subreads with average lengths of 8,912 bp for gayal. Finally, only PacBio subreads ≥500 bp were used for genome assembly. Five 270 bp paired-end libraries were constructed using Illumina’s paired-end kits according to the manufacturer’s instructions. The libraries were sequenced on Illumina HiSeq 2500 platforms, and 195.34 Gb short read (150 bp) data were generated. Raw reads were filtered by the removal of sequencing adaptors and contaminated reads.
De Novo Assembly
Prior to genome assembly, we used the error correction module of Canu v1.5 (Koren et al. 2017) to select longer subreads with the settings “genomeSize = 3,500,000,000” and “corOutCoverage = 80.” We then detected overlapping raw reads using MHAP v2.12 (“corMhapSensitivity = low/normal/high”; Berlin et al. 2015). Error correction employed falcon_sense (“correctedErrorRate = 0.025”; http://bit.ly/pbfcasm). Next, these fragments were assembled using Canu. Finally, iterative polishing employed Pilon v1.22 (Walker et al. 2014) by aligning the adaptor-trimmed paired-end Illumina reads to the assembly with the parameters “–mindepth 10 –changes –threads 4 –fix bases.” The resulting draft assembly was 2.64 Gb with a contig N50 of 27.2 Mb.
Evaluation of the Genome Assembly
Illumina reads mapped to the assembly using BWA v0.7.13 (Li and Durbin 2009) contained 96.47% of the PE reads with acceptable insertion intervals. The assembled sequences were also supported by paired-end reads with high consensus. Assessments of the genome assembly with the Core Eukaryotic Genes Mapping Approach (CEGMA; Parra et al. 2007) and BUSCOs [using lineage dataset mammalia_odb10 (eukaryota, 2021-02-19); Simão et al. 2015] found 455 (99.34%) of the conserved Core Eukaryotic Genes (CGEs) and 248 (100%) of the highest CGEs in the gayal genome assembly, as well as 8,917 (96.7%) of the mammalian lineage-specific complete BUSCOs, of which 8,808 were in single copies, 109 were duplicates, 72 were fragmented, and 237 were missing.
Hi-C Sequencing Data
For Hi-C sequencing, nuclear DNA from blood of the same individual was cross-linked, then cut with a restriction enzyme, leaving pairs of distantly located but physically interacting DNA molecules attached to one another (Lieberman-Aiden et al. 2009). The sticky ends of these digested fragments were biotinylated and then ligated to each other to form chimeric circles. Biotinylated circles, which were chimeras of the physically associated DNA molecules from the original cross-linking, were enriched, sheared, and sequenced (Burton et al. 2013). We obtained a total of 621.28 million clean Hi-C read pairs (186 Gb) with approximately 71-fold coverage of the gayal genome. Of these reads, 91.88% mapped onto the gayal genome, and 73.72% exhibited unique alignments. After filtering, we obtained 119.68 M valid interaction pairs for the chromosome-level assembly. Subsequently, the contigs were broken into fragments with a length of 500 kb and then clustered by LACHESIS (Burton et al. 2013) with validated interaction read-pairs. Contigs with low coverage of Hi-C interaction signals (sites with less than 0.5-fold average sequencing depth) in the draft assembly by Canu (Koren et al. 2017) were corrected. Finally, 958 contigs with a total length of 2.57 Gb were assigned, ordered, and oriented to the 29 chromosome-level groups.
We retrieved taurine Hi-C data from ear skin through the accession number GSM5110924 for a 3D architecture comparison between the 2n = 58 karyotype and the 2n = 60 karyotype, since there were no taurine blood Hi-C data available. TADs were identified at 40-kb resolution with TopDom (Shin et al. 2016), using our assembled gayal genome as a reference. For the detection of interactions, we analyzed the Hi-C dataset following the Juicer pipeline (Durand et al. 2016), aligning a HindIII-digested restriction fragment list generated by Juicer to our assembled gayal genome. After resolution estimation, we built contact maps with 10-kb resolution and normalized with Knight–Ruiz matrix balancing algorithm with bias, which was implemented in Fit-Hi-C v2.0.5 (Kaul et al. 2020). Significant intrachromosomal interactions were determined with parameter “–r 10000.” Enrichment analysis for gene ontology was conducted by g:Profiler (Raudvere et al. 2019).
ATAC Sequencing Data
Dorsal muscle from three adult gayal individuals and three adult indicine individuals were collected. We performed ATAC sequencing following a previous protocol (Buenrostro et al. 2015). The prealignment QC was first checked by FastQC (v0.11.8) (https://www.bioinformatics.babraham.ac.uk/projects/fastqc/). Low-quality bases and adapters were subsequently removed by Trimmomatic (Bolger et al. 2014). After read trimming, FastQC was again implemented to check for the successful removal of adapter and low-quality bases. Trimmed reads were then mapped to a reference genome using Bowtie2, and the mapped reads were further filtered by SAMtools for nonunique and unmapped reads and by using the Picard package for duplicated reads. Next, we identified accessible regions (also referred to as peak calling) of ATAC-seq data using MACS2, and the peak distribution was visualized by IGV. After obtaining peak sets, we used ChIPseeker to assign peaks to the nearest or overlapping genes, exons, introns, promoters, 5′UTRs, 3′UTRs, and other genomic features and to visualize the annotation results, such as through a pie chart of annotated genomic features.
Genomic Collinearity
The genomic collinearity analysis between taurine (GCF_000003055.6), buffalo (GCF_003121395.1), and gayal genomes was completed using NUCMER from MUMmer package v3.23 (Delcher et al. 2003) with default parameters combined with the delta-filter parameters -1 -l 10000 –u 90. Collinearity was visualized using Circos v0.69 (http://circos.ca/; Krzywinski et al. 2009).
Genome Annotation
Repetitive Sequences
Repetitive components of the genome assembly were ascertained by building a repeat library employing LTR-FINDER (Xu and Wang 2007), MITE-Hunter (Han and Wessler 2010), RepeatScout (Price et al. 2005), and PILER-DF (Edgar and Myers 2005). The de novo database was classified using PASTEClassifier (Wicker et al. 2007) and was then combined with the Repbase database (Bao et al. 2015) to create the final repeat library. Repetitive sequences in the gayal genome were identified and classified using RepeatMasker (Tarailo-Graovac and Chen 2009) based on the final repeat library. The LTR family classification criterion was that 5′LTR sequences of the same family were required to share at least 80% identity over at least 80% of their length.
Protein-Coding Genes
Protein-coding genes were predicted using de novo and protein homology approaches. Genscan (Burge and Karlin 1997), Augustus (Stanke and Waack 2003), GlimmerHMM (Majoros et al. 2004), GeneID (Alioto et al. 2018), and SNAP (Keilwagen et al. 2016) were performed for de novo gene prediction. Analyses were based on homologs from alignment with assemblies of Homo sapiens (hg38), Mus musculus (mm9), Bos mutus (GCF_000298355.1), and B. taurus (GCF_000003055.6). Homologous genes were identified using GeMoMa v1.4.2 (Keilwagen et al. 2019). Final consensus gene models were generated by integrating the de novo predictions and protein alignments using EVidenceModeler (Haas et al. 2008). Functional annotation of the protein-coding genes was performed by blasting their sequences against a suite of various nucleotide and protein sequence databases, including COG/KOG (Tatusov et al. 2003), KEGG (Kanehisa and Goto 2000), NCBI-NR, and TrEMBL (Boeckmann et al. 2003) and with an E-value cutoff of 1e−5. Gene ontology (GO) for each gene was assigned by Blast2GO (Conesa et al. 2005) based on NCBI databases.
Noncoding RNAs
The rRNA fragments were identified by aligning the rRNA template sequences (Pfam database v31) using BLAST (Altschul et al. 1990) with E values set at 1e−10 and identity cutoff at 95%. The tRNAScan-SE algorithms (Lowe and Eddy 1997) with default parameters were applied to the prediction of tRNA genes. The miRNA genes were predicted against the Rfam database (Griffiths-Jones et al. 2003) by using INFERNAL v1.1 software (Nawrocki and Eddy 2013) with a cutoff score of ≥ 30. The results are summarized in supplementary table S11, Supplementary Material online.
MHC and Olfactory Receptor Genes
Genomic Organization of MHC Region
The structure of the MHC gene region is relatively highly conserved between mammalian species (Amills et al. 1998). It may be divided into MHC class I, class II, and class III regions; the first two contain genes that control specific immune responses, whilst class III encodes proteins that have been implicated in innate immunity (Marsh et al. 2000). In the taurine, the regions mapped to chr23 (van Eijk et al. 1995), and the class II gene cluster had subregions class IIa and class IIb separated by about 15 cM (Andersson et al. 1988). The evolutionary features of the MHC structure for gayal were ascertained first by mapping its region to taurine on chr23 and gayal and buffalo on chr2 via genomic collinearity. Next, chr27 references for MHC gene sequences from H. sapiens and B. taurus were used to determine the structure of each MHC gene by leveraging the GeMoMa Annotation Filter from GeMoMa. Finally, the predicted MHC genes were manually checked to obtain a single high-confidence transcript per locus. The gene designation per locus was assigned according to previously published studies.
OR Genes
Each high-confidence transcript per OR locus was obtained using GeMoMa and only those transcripts including key domains PF00001 and PF13853 were considered to be genuine OR genes. After masking the candidate OR loci, we then used 1,204 taurine OR homologs to obtain high-scoring pairs and assembled them into OR-homologous regions. OR-homologous relics were identified using GeneWise v2.4.1 (Birney et al. 2004) by the presence of premature stops or frameshifts within codons. These were deemed to be OR pseudogenes.
Structural Variants
SVs in the gayal genome compared with taurine (B. taurus UMD 3.1.1; Zimin et al. 2009) were called using smartie-sv (Kronenberg et al. 2018), a BLASR-based (Chaisson and Tesler 2012) computational framework. Analyses using invcheck (https://github.com/mchaisso/invcheck) identified deletions, insertions, and inversions. The distributions of SVs were counted and plotted using nonoverlapping sliding windows (window size: 500 kbp) in the R package karyoploteR (Gel and Serra 2017).
Differential RNA-Seq Analysis
We downloaded RNA-seq data from longissimus dorsi muscle (matched ATAC-seq data) from four gayals, three Chinese Simmental taurine, three Aberdeen-Angus taurine, and three cattle–yak hybrids, all aged 18–20 months, from NCBI SRA (project ID SRP314437, SRP396833, and SRP068086). To directly compare gene expression patterns across species and breeds, gene orthologs were retrieved from Ensembl Biomart database (http://asia.ensembl.org/biomart/) and our gayal annotation by querying official gene symbols. FastQC (v0.11.8) was employed to check the sequencing quality of the raw RNA-seq data (https://www.bioinformatics.babraham.ac.uk/projects/fastqc/). Btrim64 (Kong 2011) was then used to trim reads to obtain high-quality data. After obtaining clean reads, we used two transcriptome analysis processes: 1) Tophat2 (Kim et al. 2013) and Cufflinks (Trapnell et al. 2012) and 2) Hisat2 (Kim et al. 2015) and StringTie (Pertea et al. 2015). Cleaned data were then aligned against the taurine (UMD3.1) and gayal genomes using Tophat2 (v2.1.1; Kim et al. 2013), and bowtie2 (v2.3.1) (Langmead and Salzberg 2012). Cufflinks were used to assemble the transcripts and quantify expression levels (Trapnell et al. 2012). We used featureCounts (v1.6.2; Liao et al. 2014) to count reads that aligned to the genes. The false discovery rate (FDR) P values were adjusted using the Benjamini–Hochberg procedure. We also used HISAT2 (v2.2.0; Kim et al. 2015) with default parameters to align the clean reads to the reference genomes. StringTie (Pertea et al. 2015) was used to assemble the RNA-seq alignments into potential transcripts and to quantify the transcripts. Then, featureCounts (Liao et al. 2014) was performed to count reads, which aligned to the genes. The taurine reference genome was downloaded from the Ensembl database (http://www.ensembl.org/Bos_taurus/Info/Index/). Differentially expressed genes were detected using the package DESeq2 v1.16.1 (Love et al. 2014) implemented in R, with a nominal significance threshold set as P < 0.05. The FDR P value was adjusted using the Benjamini–Hochberg procedure. We identified differentially expressed orthologous genes specific to gayal (gayal DEGs), according to three pairwise comparisons: gayal versus Aberdeen-Angus, gayal versus Simmental, and gayal versus cattle–yak hybrid. Because both processes yielded similar patterns with no change in our conclusion, we presented the results from the second process only. To avoid potential incompleteness of the bovine annotation, we downloaded 391 myofibril-associated annotations (GO:0030016) in human (associated with 229 genes) and assessed the enrichment in the gayal DEGs by a χ2 test of orthologues.
Genome Resequencing
To perform a comprehensive population analysis, we selected samples of gayal without bias in relation to age, sex, or location for resequencing (supplementary table S15, Supplementary Material online). All procedures were approved by the Institutional Ethics Committee (School of Medicine, Yunnan University, China) according to the Regulations for the Administration of Affairs Concerning Experimental Animals (Ministry of Science and Technology, China, 2004). After a veterinarian had carefully restrained each healthy animal, about 5-ml blood was collected from the jugular vein using an ethylenediaminetetraacetic acid vacuum tube. Genomic DNA was extracted from the whole blood stored with blood DNA reagent using the traditional phenol-chloroform method, which was then purified with DNeasy Blood and Tissue Kit (Qiagen) according to the manufacturer’s instructions.
Mapping Resequencing Reads and SNP Calling
We combined our sequenced samples with a further 185 genomic sequences from the NCBI SRA database. This combined dataset contained data from a total of 199 Bos individuals, including 106 taurine, 32 indicine, 39 gayal, 10 banteng, and 12 wisent (European bison, Bison bonasus; supplementary table S1, Supplementary Material online). All clean reads were mapped to the assembled gayal reference genome using BWA-MEM v0.7.12 (Li 2013). PCR duplicate reads were sorted and removed using samtools v1.3.1 (Li 2011). Next, RealignerTargetCreator and IndelRealigner in the Genome Analysis Toolkit (GATK) v3.7.0 (DePristo et al. 2011) were employed for local realignment around indels. SNPs were identified using UnifiedGenotyper from GATK package with default parameters. Finally, we applied the following hard filtering criteria to all SNPs: 1) QUAL < 30; 2) QualByDepth < 2.0; 3) RMSMappingQuality < 40.0; 4) MappingQualityRankSumTest < −12.5; 5) ReadPosRankSumTest < −8.0; and 6) HaplotypeScore > 13.0. Genotypes were imputed and phased with BEAGLE v4.1 (Browning and Browning 2007).
Population Genetic Analysis
We first constructed a neighbor-joining tree using pairwise identical-by-state (IBS) distance matrix calculated from PLINK 1.9 (Chang et al. 2015) based on the autosomal SNPs. Migration events between the populations were then inferred by TreeMix (Pickrell and Pritchard 2012) allowing 0–3 migration events, rooted by wisent samples. After pruning the SNPs by PLINK with the setting “–indep-pairwise 100 50 0.3,” we assessed the maximum likelihood estimates of individual ancestries from autosomal SNPs using ADMIXTURE (Alexander et al. 2009) and principal component analysis using smartpca in the EIGENSOFT (Price et al. 2006) package. We used FastEPRR (http://www.picb.ac.cn/evolgen/), an R package, to estimate the population recombination rate (Gao et al. 2016). We filtered the raw vcf files and extracted every chromosome from the filtered vcf files with PLINK v1.90b6.10 (Chang et al. 2015). Then, we phased the vcf files by using BEAGLE v5.1 (Browning and Browning 2007). FastEPRR involved three steps for analyzing VCF files and each step was represented by one function. FastEPRR was performed using default parameters. We applied RFMix program (Maples et al. 2013) to detect signals of introgression from taurine/indicine across gayal genomes. Pairwise per-SNP genetic differentiation values (FST) and dxy were calculated as described by Akey et al. (2002, 2010) to evaluate population differentiation between taurine, indicine, and gayal.
Mitochondrial Genome Analysis
We independently assembled the mitogenomes from paired-end sequencing reads for each sample using NOVOplasty v2.72 (Dierckxsens et al. 2017). The gayal mitochondrial reference genome (NCBI accession number: NC_036020.1) was selected as the seed and the reference sequence. The k-mer parameter was reduced to 23–31 in case of assembly failure under the default k-mer of 35. Only complete circularized mitogenomes were kept for downstream analysis. By integrating with other representative bovine mitochondrial sequences in GenBank, we applied the Clustal Omega v1.2.0 (Sievers et al. 2011) for multiple sequence alignment after rotating the mitochondrial sequences using Cyclic DNA Sequence Aligner (Fernandes et al. 2009). Finally, the maximum likelihood tree based on Tamura–Nei model (Tamura and Nei 1993) was constructed using MEGA7 (Kumar et al. 2016).
Supplementary Material
Supplementary data are available at Molecular Biology and Evolution online.
Acknowledgments
This work was supported by the Second Tibetan Plateau Scientific Expedition and Research (STEP) Program (2019QZKK05010703); the National Key R&D Program of China (2021YFD1200904); the Strategic Priority Research Program of the Chinese Academy of Sciences (XDA2004010302); the National Natural Science Foundation of China (31860305, 32070600); and the High-level Talent Promotion and Training Project of Kunming (2022SCP001). Y.L. was supported by the Young Academic and Technical Leader Raising Foundation of Yunnan Province. Samples used in this study were provided by the Animal Branch of the Germplasm Bank of Wild Species, Chinese Academy of Sciences (Large Research Infrastructure Funding). Computational resources were provided by the Advanced Computing Center of Yunnan University.
Author’s Contributions
Y.L., D.-D.W., and Y.-P.Z. conceived the project and designed the research. Y.L. and D.-D.W. supervised the data analysis. S.-F.W., Z.-J.Z., Jin.L., G.L.L, F.M.H., L.-L.W., and Jie.L. performed the analysis. W.-D.D, S.-F.W. S.H., and H.-Q.L. prepared the DNA samples. Y.L., S.W., and D.-D.W. drafted the manuscript. All authors read and helped to improve the manuscript.
Conflict of interest
The authors declare no competing financial interests.
Data Availability
All the sequences are deposited in the Sequence Read Archive (https://www.ncbi.nlm.nih.gov/sra) with the accession ID PRJNA612712.
References
Author notes
Yan Li, Sheng Wang, Zhe Zhang, Jing Luo, Guo Liang Lin, Wei-Dong Deng and Zhifan Guo contributed equally to this work.
