


Abstract
It is largely unknown how mammalian genomes evolve under rapid speciation and environmental adaptation. An excellent model for understanding fast evolution is provided by the genus Sus, which diverged relatively recently and lacks postzygotic isolation. Here, we present a high-quality reference genome of the Visayan warty pig, which is specialized to a tropical island environment. Comparing the genome sequences and chromatin contact maps of the Visayan warty pig (Sus cebifrons) and domestic pig (Sus scrofa), we characterized the dynamics of chromosomal structure evolution during Sus speciation, revealing the similar chromosome conformation as the potential biological mechanism of frequent postdivergence hybridization among Suidae. We further investigated the different signatures of adaptive selection and domestication in Visayan warty pig and domestic pig with specific emphasize on the evolution of olfactory and gustatory genes, elucidating higher olfactory diversity in Visayan warty pig and positive and relaxed evolution of bitter and fat taste receptors, respectively, in domestic pig. Our comprehensive evolutionary and comparative genome analyses provide insight into the dynamics of genomes and how these change over relative short evolutionary times, as well as how these genomic differences encode for differences in the phenotypes.
Introduction
Changes in the environment can initiate the process of speciation, where exposure to new environmental selective forces directs populations toward new evolutionary trajectories (Templeton 2008; Coyne and Orr 2009). To respond to altered conditions there must be sufficient genetic variation for the population to reach adaptation through natural selection. Revealing the genotype–phenotype relationships of adaptive traits deepen our understanding of aspects like anatomy, metabolism, behavior, and ecology.
Ever since Darwin’s time, pairs of closed related insular and continental species have often been used to study adaptive trajectories. The genus Sus, pigs and hogs, comprises at least seven morphologically and genetically well-defined species. Except for S. scrofa, which inhabit the Eurasian continent, all other Sus species are restricted to Islands of Southeast Asia (ISEA). Recent findings showed that these species diverged during the late Pliocene (4–2.5 Ma), as a result of isolation on different islands of ISEA due to climate fluctuations accompanied by sea-level changes (Liu et al. 1992; Frantz et al. 2013). One of the representative species of ISEA Sus is the Visayan warty pig (Sus cebifrons), which is named after the islands it lives on, and the three pairs of fleshy warts on the face of boars. The species lives in social groups in dense tropical island forested areas and has an omnivorous diet of wide variety (Clauss et al. 2008; Melletti and Meijaard 2017). Contrary to the endemic occurrence of S. cebifrons, the wild boar and domesticated pig (S. scrofa) have a widespread geographical distribution throughout Eurasia, with domesticated pigs found on all continents, except polar regions. The widespread distribution has recently been suggested to have been facilitated by admixture events with local pig species during the natural expansion of the species from Southeast Asia to Europe (Liu et al. 1992; Frantz et al. 2013). In addition, S. scrofa has also been interacting with humans during the process of domestication. Having been domesticated 10,000–9,000 years ago independently in East Anatolia and in China (Larson et al. 2005; Larson et al. 2010; Frantz et al. 2015), pigs have experienced long-term artificial selection for various traits including production, fertility, and disease resistance. The phenotypic and ecological differences between these two sister species in the genus Sus provide an excellent opportunity to study the molecular mechanism of speciation and adaptation by comparative evolutionary genomics.
Since publication of the reference genome of domesticated pig in 2012 (Groenen et al. 2012), the number of S. scrofa genomes available has increased dramatically during the last couple of years (Fang et al. 2012; Li et al. 2013, 2017; Vamathevan et al. 2013). However, to date, no high-quality reference genome has been reported for other species in the Suidae family. Here we provide a high-quality genome assembly for the Visayan warty pig. By comparative genome analysis, various evolutionary events and mechanisms were studied. Specifically, we investigated genomic changes that provide insight into the evolution of reproductive barriers. Furthermore, we investigated genome differences related to species-specific traits, such as the adaptive evolution of smell and taste.
Results
Genome Sequencing, Assembly, and Quality Evaluation
For the Visayan warty pig genome assembly, 10× genomics, Hi-C, and mate-pair sequences were employed. From k-mer analyses, the size of the Visayan warty pig genome was estimated to be around 2.25 Gb (supplementary fig. S1, Supplementary Material online). The genome sequence was constructed by a hybrid assembly approach (see Material and Methods), which yielded a genome assembly showing a contig N50 of 159.6 Kb, a scaffold N50 of 141.8 Mb, an assembled genome size of 2.48 Gb, and comprised of 1585 scaffolds (table 1, supplementary fig. 2 and table 1, Supplementary Material online). The assembly of the mitochondrial genome sequence resulted in a 16.56 kb, circular, assembly (supplementary fig. 3, Supplementary Material online). Features of the genome assembly are shown in fig. 1a.
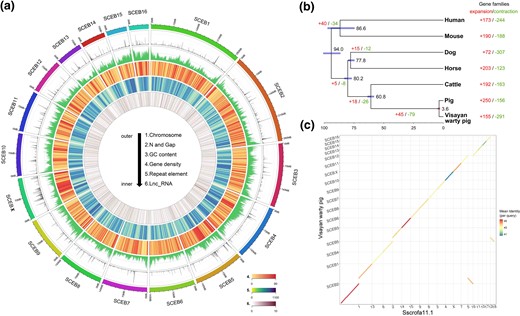
Overview of the assembly characteristics of the Visayan warty pig genome. (a) Circular diagram depicting the characteristics of the Visayan warty pig genome. The tracks from outer to inner circles are indicated in the legend (density of coding gene are shown in track 4). (b) Divergence times and history of orthologous gene families. Numbers on the nodes represent divergence times, with the error range shown in blue bar. The numbers of gene families that expanded (red) or contracted (green) in each lineage after speciation are shown on the corresponding branch. (c) Whole-genome alignment between Visayan warty pig and Duroc pig (Sscrofa11.1).
Assembly and Annotation Statistics of the Draft Genome of Visayan Warty Pig.
| Assembly features | |
| Total length (bp) | 2,459,328,531 |
| Scaffold count | 1,585 |
| Longest scaffold (bp) | 289,860,557 |
| N50 of scaffold (bp) | 141,782,568 |
| N50 of contig (bp) | 159,795 |
| GC ratio (%) | 41.78 |
| Genome annotation | |
| Number of putative coding genes | 21,153 |
| Average gene model length (bp) | 2554.18 |
| Average CDS length (bp) | 1,640.66 |
| Average gene exon length (bp) | 220.89 |
| Average exon number per gene | 11.56 |
| Average gene intron length (bp) | 4,565.05 |
| Total size of Tes (bp) | 1,079,874,097 |
| TEs in genome (%) | 43.91 |
We mapped the previously published Illumina short reads sequences from the same individual to the assembled genome. A total of 99.73% of the short sequence reads covered 99.41% of the genome assembly. The low percentage of homozygous single nucleotide polymorphisms (0.008% of the whole genome) reflects the sequence accuracy of the genome assembly. The Visayan warty pig assembly was also assessed for completeness using Benchmarking Universal Single-Copy Orthologs (BUSCO) (Simão et al. 2015). The BUSCO analysis, based on a mammal-specific gene set, indicated 95.7% of the genes to be complete, suggesting a high completeness of the assembly (supplementary table 2, Supplementary Material online).
Repetitive Sequences, Telomeres, and Centromeres
The number of different repeat classes and the divergence distribution of these repetitive elements were identified in the Visayan warty pig genome (supplementary table 3 and fig. 4, Supplementary Material online, respectively). In total, 43.9% of the Visayan warty pig genome consists of repetitive elements (43.8% in domesticated pig and 52.6% in human). The main repetitive transposable elements (TEs) were long interspersed nuclear elements (LINEs) (∼511 Mb, covering 20.8% of genome).
Putative telomeres were identified at the proximal ends of Visayan warty pig chromosome assemblies of SCEB1–4, SCEB6, SCEB8, SCEB9, and SCEB10–15 (supplementary fig. 5 and table 4, Supplementary Material online) and putative centromeres were identified in the Visayan warty pig chromosome for SCEB1–10, SCEB12, SCEB13, and SCEB15 (supplementary fig. 5 and table 5, Supplementary Material online), by searching for concentrations of signature repeats. Both chromosomes SCEB7 and SCEB13 harbored two centromeric repeat regions, which consist with observations for the Duroc genome (S. scrofa chromosomes [SSC]8 and SSC11) (Warr et al. 2020). However, on SCEB6 we only identified one centromeric region, whereas there are two in the homologous SSC15. Chromosomes SCEB1–10, SCEB12, and SCEB13 are metacentric, while chromosome SCEB15 is acrocentric, which are consistent with homologous chromosomes in Duroc genome.
Genome Comparison of Structural Variations Between S. cebifrons and S. scrofa
Genome structural variations, such as insertions, deletions, inversions, and duplications, are important sources of the genetic diversity that shapes phenotypic variations. We identified 52,827 deletions and 59,299 insertions (INDELs) with a length >100 bp compared with the S. scrofa (Duroc) assembly. The average lengths of the deletions (374 bp) and insertions (342 bp) are very similar (supplementary fig. 6, Supplementary Material online), and 54.2% of the INDELs are associated with TEs (more than 10 bp overlapping). The TE distribution patterns for insertions and deletions are distinct. Short interspersed nuclear elements have the highest proportion associated with INDELs (38.3% for insertion, 30.6% for deletion). LINEs have the second-highest proportion of deletions accounting for 27.0%, whereas simple sequence repeats have the largest number of insertions representing ∼23.9% (supplementary fig. 7 and table 6, Supplementary Material online).
Genome Annotation of the Visayan Warty Pig
RNA-seq data from the Visayan warty pig and the proteomes of six additional mammalian species were used for the structural and functional gene annotations. By using an integrative annotation approach (see Material and Methods), we identified 21,153 protein-coding genes (supplementary table 7, Supplementary Material online). Among the 21,153 protein-coding genes, 20,750 (99%) are functionally annotated with Gene Ontology (GO) terms. Gene annotation of mitochondria was performed using MitoZ (Meng et al. 2019) and 13 protein-coding genes as well as 21 tRNA genes are annotated (supplementary table 8, Supplementary Material online).
Of the predicted protein-coding genes in Visayan warty pig genome, 17,175 genes (81.2%) have clear one-to-one orthologs in the Duroc pig genome, and 14,643 genes (69.2%) in the human genome. We compared the gene models of Visayan warty pig with other mammalian species. The structural feature of genes, such as CDS, exon, and intron lengths and exon numbers, is highly conserved within the mammalian linages, and Visayan warty pig has very similar gene features as the Duroc pig (supplementary fig. 8 and table 7, Supplementary Material online).
In the Visayan warty pig genome, we predicted 21,467 noncoding RNA transcripts, including 11,767 long noncoding RNAs (lncRNAs). Based on miRBase (http://www.mirbase.org), hairpin sequence alignments, 1037 miRNA loci were identified. Based on alignment evidence from Ensembl noncoding RNA sequences (release 100), ∼20,515 noncoding RNA genes in Visayan warty pig had a reciprocal best hit (RBH) or second-best hit against the Duroc pig (supplementary table 9, Supplementary Material online).
We estimated the number of expanded and contracted gene families among the six mammalian genomes (fig. 1b, supplementary tables 10–12, Supplementary Material online). In the Visayan warty pig, Duroc pig and the ancestral Sus genus branch, the most prominent gene family involved in gene expansion is related to olfaction.
Phylogenetic and Divergence Time Analysis
We obtained a high-confidence orthologous gene set of Visayan warty pig together with pig, cattle, horse, dog, mouse, and human. From 18,586 gene family clusters we obtained 10,057 high-confidence single-copy gene families which were used for phylogenetics analysis (supplementary figs. 9–10, Supplementary Material online). The phylogenetic tree displays high support values for all nodes and the time of divergence estimates for the different nonpig outgroups are in line with previous studies (fig. 1b, supplementary fig. 11, Supplementary Material online) (Frantz et al. 2013, 2014). The time tree indicates that Visayan warty pig and the Duroc pig diverged ∼3.6 Ma and that the evolutionary rate in Visayan warty pig was ∼4.1 × 10⁻¹⁰ mutations per generation, which was significantly lower than that of the Duroc pig (4.78 × 10⁻¹⁰, Student’s t-test, P < 0.01) (supplementary fig. 12, Supplementary Material online).
Contiguity and Chromosomal Rearrangements
The chromosome-level Visayan warty pig genome assembly allows a detailed comparison to the assembled domesticated pig genome (Sscrofa11.1; Warr et al. 2020) derived from a Duroc sow, to assess the evolutionary dynamics between these closely related species. We assessed the scaffold orderings of these two genomes through whole-genome sequence alignments (fig. 1c). Our Visayan warty pig assembly reveals a high degree of colinearity with the Duroc pig assembly which is based on PacBio sequencing. Besides the strong overall collinear relationship between the two genomes, previously described chromosomal rearrangements between the two species were confirmed (O’Brien et al. 2007; Musilova et al. 2010) (supplementary fig. 13, Supplementary Material online). The karyotype of Visayan warty pig (2n = 34) reveals centric fusions of pig chromosomes SSC13/16 and SSC14/18. In the Visayan warty pig assembly, these fused chromosomes are the largest and third largest chromosomes, respectively. Chromosome contact maps of Visayan warty pig and domesticated pig each were assessed from Hi-C data. The comparison of Hi-C interaction maps for homologous chromosome pairs shows obvious similarities (supplementary fig. 14, Supplementary Material online) and the fused chromosomes in Visayan warty pig retained the same chromosome interaction patterns as the corresponding Duroc pig homologous chromosomes (fig. 2). The interchromosomal interactions in the fused chromosome SCEB1 (SSC13/16) are mainly restricted to within the two chromosome arms, whereas SCEB3 (SSC14/18) shows more interactions between the fused chromosomes. We further quantified the similarity of interaction matrixes between Visayan warty pig and Duroc pig using Phylo-HMRF (Yang et al. 2019). Around 23.5% of the total interactions are categorized as highly or medium conserved (fig. 2, supplementary fig. 15, Supplementary Material online, see Materials and Methods).
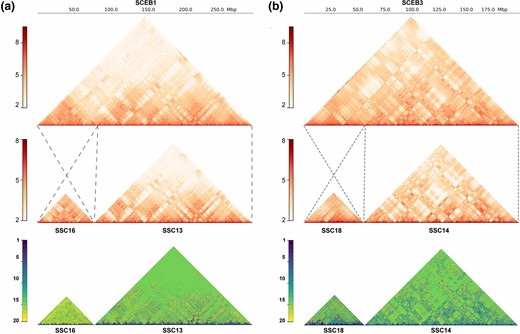
Chromosome interactions in homologous chromosome pairs. Hi-C contact map of (a) SCEB1 and (b) SCEB3, with signal scale displayed at the left. The units are the chromosomal interaction number on a Log10 scale. Dash lines highlight the homologous region between Visayan warty pig (top panel) and Duroc pig (middle panel). The darker color in the Hi-C contact map represents higher contact frequency. Bottom panel shows cross-species Hi-C contact frequency states identified by Phylo-HMRF. The darker color represents less conserve state between two species.
Evolution of Functional Elements and Genes
Conservation of DNA sequences across distantly related species reflects functional constraints. We first generated a multiple genome alignment from Visayan warty pig, Duroc pig, cattle, horse, dog, mouse, and human genomes. Among the aligned mammalian genomes, we predicted 16.6 million highly conserved elements (HCEs) at a resolution of 20 bp or greater, spanning 7.5% of the Visayan warty pig genome. Functional annotations revealed that ∼3.5% of these HCEs is associated with protein-coding genes, whereas the majority of the remaining HCEs are located in intron and intergenic regions (supplementary fig. 16, Supplementary Material online). We further subset the Sus genus-specific HCEs (SHCEs). Noncoding HCEs may play important roles in the regulation of gene expression. We compared the transcription factor binding sites (TFBSes) found in the ENCODE project with these SHCEs. In total, 37.9% (49,846) of the SHCEs contain known TFBSes (supplementary table 13, Supplementary Material online). To investigate evolutionary rate on genes, we identified positively selected genes (PSGs) and rapidly evolving genes (REGs) for the 10,057 one-to-one orthologs. Functional enrichment analyses of the PSGs and REGs in Duroc pig and the ancestral Sus genus branch both exhibit enrichment in immune response and energy metabolism functions (supplementary tables 14–21, Supplementary Material online). Specifically, we observed a series of PSGs and REGs in Visayan warty pig involved in the regulation of growth, adaptive thermogenesis, and chromatin organization (supplementary fig. 17 and tables 22–25, Supplementary Material online). In addition, we also compared the identified PSGs in Duroc pig with those reported in previous studies (Groenen et al. 2012; Li et al. 2013) and found very few overlapping. This discordance will be further discussed below.
Genome Differences Related to Species and Genus Characteristics
In mammals, the chemosensory system mediates many behaviors such as locating food, mating, and shelter. Suidae species do not have particularly good vision. Thus, they heavily utilize their olfactory and gustatory sensation (Sutherland-Smith 2015). For example, olfactory receptor (OR) gene duplications are evident in the genomes of domesticated pig, which potentially enhances the adaptations to novel habitats (Truong Nguyen et al. 2012; Paudel et al. 2015). Having distinct evolutionary history, habitat, and diet, a comparison of Visayan warty pig and Duroc pig can provide insight in the selection of genomes leading to species-specific traits. In the meantime, comparing two Sus genomes with other mammalian genomes will elucidate the sensory characteristics in the Sus genus.
Evolution of Olfaction
In the Visayan warty pig genome, we identified 1,163 OR genes of which 921 are functional ORs. This number of functional ORs is approximately equivalent to the number found in the Duroc pig (1,213 ORs; 1,089 functional ORs) and is more than seen in most other mammals (fig. 3a, supplementary table 26, Supplementary Material online). Based on the OR families we estimated the dynamics of ORs and found evidence for OR expansion at the ancestral branch of the Sus genus, leading to Visayan warty pig and Duroc pig (supplementary fig. 18, Supplementary Material online). This suggests that an expanded OR repertoire became important already in the ancestral Sus species. The diversity of the OR gene repertoire in the Visayan warty pig is represented by different families. Similar to Duroc pig (Truong Nguyen et al. 2012), the identified Visayan warty pig OR genes could be clustered into 2 classes and 17 families, and further grouped into 428 subfamilies, based on phylogenetic analyses and their sequence similarity (fig. 3b).
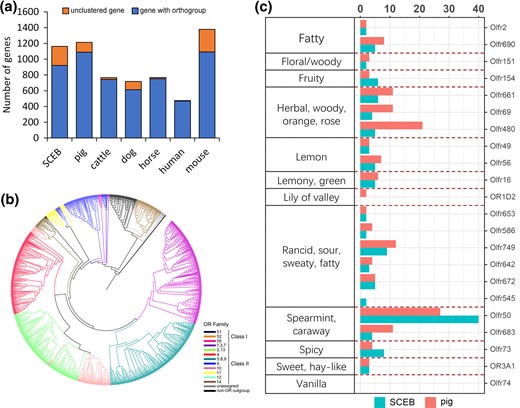
Evolution of Olfactory gene family. (a) Shared and specific OR genes in Visayan warty pig and six other mammalian species. (b) Phylogenetic tree constructed with OR protein sequences of Visayan warty pig showing classification of ORs in Visayan warty pig. The different family members are colored according to the colors shown in the legend of b. (c) Potential association between olfactory receptor gene and odorant recognition.
To identify the potential target specificity of the OR genes in the two pig species, the amino acid sequences of translated Visayan warty pig OR genes and Duroc pig OR genes were compared with those of other species with annotated information on odorant specificity. Using Nguyen et al.’s methods (Truong Nguyen et al. 2012), two sequences were considered to have the same odorant recognition if their identity reached more than 60%. Of the 921 Visayan warty pig functional OR genes, 121 ORs matched to an OR with a known odorant target (fig. 3c). We found that expanded ORs in Visayan warty pig are mainly involved in spearmint, caraway, spicy, and fruit odor detection, whereas Duroc pig is more enriched in herbal, woody, orange, rose, and fatty odor detection. Additionally, we calculated the amino acid diversity of each OR gene family. In general, OR genes in Duroc pig show higher diversity than those in Visayan warty pig (supplementary table 27, Supplementary Material online).
Evolution of Taste
Taste perception affects diet preference and consequently food/feed intake. The mammalian gustatory system usually discriminates five major basic taste classes: salty, sour, sweet, umami, and bitter. In addition, as fat is an essential ingredient in feed, fat taste is one of the taste types with high potential implications relevant to the swine industry. We did a systematic study on taste transduction-related genes in the two pig species (fig. 4a).
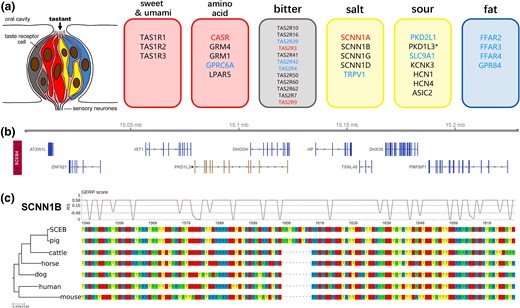
Genomic features related to taste transduction. (a) Diagram of the taste bud cell and related taste receptor genes. The red font indicates higher selection pressure present in Duroc pig than Visayan warty pig. The blue font indicates higher selection pressure present in Visayan warty pig than Duroc pig. Black Asterisk indicates a putative pseudogene. (b) Genome track for Visayan warty pig. PKD1L3 is nested with DHODH. Functional genes are shown in blue, whereas the putative pseudogene is shown in brown. (c) Multispecies DNA alignment of SCNN1B, showing the region with Sus genus-specific insertion. GERP scores are shown on top of the alignment. Dashed lines represent upper quartile, average, and lower quartile, respectively.
For the 35 well-characterized gustatory genes (Danilova et al. 1999; Glaser et al. 2001; Huang et al. 2006; Ishimaru et al. 2006; Bachmanov and Beauchamp 2007; Horio et al. 2011; Roura et al. 2013; Li and Zhang 2014), we carried out a comprehensive evolutionary analysis (supplementary tables 28 and 29, Supplementary Material online). Among all the bitter taste receptor genes, only TAS2R42 and TAS2R39 had significantly elevated dN/dS ratios in the Visayan warty pig, whereas relaxed constrain is found in human and positive selection is found in mouse (supplementary table 28, Supplementary Material online). The cluster of genes sensing amino acids showed a high proportion of members under relaxed selection in Visayan warty pig, Duroc pig, horse, and cattle (supplementary table 29, Supplementary Material online). All fatty acid sensors in the Duroc pig are under relaxed selection, whereas none of them shows the same pattern in other mammalian species.
Of the six identified sour taste receptor genes in mammals, PKD1L3 and PKD2L1 are crucial in the reception of H+. In the Visayan warty pig genome, the annotated PKD1L3 gene is pseudogenized which is similar to the Duroc pig where the homologous PKD1L3 gene is also pseudogenized and identified as a lncRNA (LOC102158108, as annotated by NCBI) overlapping DHODH (fig. 4b).
Pigs have a limited ability to taste salt (sodium chloride [NaCl]) (Danilova et al. 1999; Hellekant and Danilova 1999). Na+ taste reception involves the selective epithelial amiloride-sensitive sodium channel, ENaC. In most mammals, there are four ENaC channel subunits, α, β, γ, and δ. By comparing the ENaC genes among mammals, we found a specific insertion (S420_Y421insNYG) in the ENaC channel subunit β (SCNN1B) in both Visayan warty pig and in Duroc pig (fig. 4c). In a second candidate NaCl receptor, vanilloid receptor subtype 1 (TRPV1), we also found specific deletions in Visayan warty pig and in Duroc pig, respectively (T662del in Visayan warty pig and S661_R665del in Duroc pig, using human TRPV1 as reference, supplementary fig. 19, Supplementary material online). These two amino acid variants are located in hydrophobic regions on the protein surface and are likely to affect function (supplementary fig. 20, Supplementary material online).
Discussion
Recent developments in DNA sequencing have put chromosome-level, high-quality genome assemblies of nonmodel, endangered species, within reach. Such high-quality genomes of ecological and evolutionary distinct species provide opportunities to study speciation at the genome level. In this study, we have produced a hybrid assembly approach for the Visayan warty pig genome using 10× Chromium linked-reads to generate long contigs. These contigs were scaffolded using Hi-C chromatin contact map and jump reads. This approach enabled us to produce a highly contiguous genome, with all chromosomes reconstructed as single scaffolds.
Evolution of Suidae Genomes
On the basis of a comparison of the genome assembly of Visayan warty pig with that of the Duroc pig (Sscrofa11.1), it was confirmed that the Visayan warty pig genome is of comparable continuity and essentially chromosome level. Short read sequencing technology limits resolving low-complexity repeats (Minoche et al. 2011). This explains the relatively low contig N50 (159.6 kb) and incomplete telomeres and centromeres observed in the Visayan warty pig genome assembly. However, the contig N50 is less likely to affect Hi-C-based genome scaffolding (Zhang et al. 2019; Peart et al. 2021). Thus, the clustering, ordering, and orientation of the final assembly are reliable. We also compared basic genome structural features, including gene lengths, coding regions, and noncoding regions of the Visayan warty pig genome with the Duroc pig, all of which show a high level of similarity.
Using fossil calibrations, we estimated the divergence between Visayan warty pig and Duroc pig between 4.57 and 2.71 Ma (Pliocene), which is reflected in the high genomic collinearity between them. The chromosome number for the Visayan warty pig has been reported as 2n = 35 in contrast to the domestic pig (S. scrofa) where in most instances 2n = 38 (O’Brien et al. 2007). A systematic survey of the karyotype of members of the Suidae family indicated that the centric fusion in the Visayan warty pig genome, homologous to SSC 13/16, is more likely to be the ancestral karyotype of Suidae (supplementary fig. 21, Supplementary Material online). In the ancestral linages, Babyrousa and Sub-Saharan Suids (Melander and Hansen-Melander 1980; Bosma et al. 1996; Thomsen et al. 1996; Musilova et al. 2010), SSC13/SSC16 are fused. After the diversification of Suinae species in Eurasia, Pygmy hog (Porcula salvania) and other Sus species are all carrying separated SSC13/SSC16 homologous chromosome (Bosma et al. 1983; Bosma et al. 1991; Rothschild and Ruvinsky 2011). We hypothesize that the ancestral chromosomes SSC13/SSC16 split in the common ancestor of Porcula and Sus, whereas the centric fusion independently occurred in Visayan warty pig. The other centric fusion, homologous to SSC14/18, is only found in Visayan warty pig. Notably, chromosome fusion/fission seems to happen quite frequently among the Suidae linage. For example, the karyotype of Sub-Saharan suids (2n = 34) differs from that of the domestic pig by the presence of two fusion chromosomes homologous to SSC13/16 and SSC15/17 (Musilova et al. 2010), and some wild boars living in Western Europe carry a single Robertsonian translocation (centric fusion) between SSC15 and SSC17 (Raudsepp and Chowdhary 2011). It is known that recent Robertsonian translocations do not impede producing fertile offspring, for example, in the case of the European wild boar (McFee et al. 1966). Similarly, fertile hybrid offspring between S. scrofa and Visayan warty pig, as well as other ISEA Sus (Blouch and Groves 1990; IUCN 1993; Ruvinsky et al. 2011), has been reported. Genome analyses also reveal that S. scrofa exhibited extensive gene flow with other Sus species, and even with its sister genus Porcula (Pygmy hog) during range expansion (Liu et al. 1992; Frantz et al. 2013; Frantz et al. 2014). This indicates limited postzygotic reproductive isolation despite frequent Robertsonian translocation. In meiotic prophase, homologous chromosomes must be organized into compacted loop arrays in order to identify one another, pair along their length and physically link to ensure their accurate recombination and segregation in the meiosis I division (Keeney et al. 2014; Patel et al. 2019). The comparison of chromosome interaction maps suggests that, in the short divergence time between Visayan warty pig and Duroc pig (∼3 Ma), the chromosome structure remains the same after chromosome fusion. Moreover, we did not observe excess chromosomal inversions or recurrent deletions or insertions of TEs, which may form genomic islands and contribute to reproductive isolation (Chan et al. 2010; Schwander et al. 2014; Lamichhaney et al. 2015; Saenko et al. 2015; Kirubakaran et al. 2016). This may explain the absence of a postzygotic species barrier. Even with different chromosome numbers, the synapsis during meiosis is probably not interrupted, leading to the absence of postzygotic reproductive isolation.
Selective Constraints on Functional Elements and Genes
With the newly generated Visayan warty pig genome assembly, an evolutionary genome analysis was conducted aimed at revealing correlations with specific traits in the Sus genus.
Functional enrichment analyses of the PSGs and REGs in the ancestral Sus genus branch both exhibit enrichment in immune response and energy metabolism. Although fossil evidence cannot unambiguously resolve the origin and dispersion route of Sus species, colonization of most of the Eurasian continent and ISEA during the Pliocene is well supported (Azzaroli 1992; van der Made et al. 2006; Frantz et al. 2013; Pickford 2013). The genomic changes associated with olfaction, the immune system, and metabolism may relate to the wide distribution and local adaptation of the ancestral Sus population.
Comparing the genome of Visayan warty pig with domestic pigs further showed species-specific traits and the impact of domestication. In the genome of the Visayan warty pig, we observed a series of PSGs and REGs involved in the regulation of growth and thermoregulation. Like many island species, the Visayan warty pig is relatively small in size with an adult weight of 20–40 kg (Rabor 1977; Oliver et al. 1993; Clauss et al. 2008). Reducing body size might be more favorable to maximize energy allocation to growth and reproduction. In contrast, the adult weight of a Duroc pig shows an up to 10-fold difference (250–300 kg) to that of the Visayan warty pig, whereas Eurasian wild boar shows a 5-fold difference (75–100 kg) (Evans et al. 1946; Comission 2010). We also identified REGs in Visayan warty pig related to thermoregulation. The geographical distribution of Visayan warty pig has always been restricted to the Visayan islands in the Philippine archipelago, which have a tropical rainforest climate. The genomic changes associated with body temperature regulation may trigger adaptation to high annual mean temperature and absence of significant seasonality (Villafuerte et al. 2020). Moreover, based on Bergmann's rule, a smaller body size can also have a collective effect on adapting to a high-temperature condition (Ashton et al. 2015). These results reflect the evolutionary trajectory of the Visayan warty pig toward adaptation of tropical island environment.
Domestication and subsequent long-term selective breeding have profoundly changed the anatomical, physiological, and behavioral characteristics of livestock and left clear genomic signatures consistent with selection. We found functional enrichment of the PSGs and REGs in Duroc pig exhibiting enrichment in neural functions, immune response, energy metabolism functions, growth, and muscle development, consistent with previous reports of pathways related to pig domestication (Li et al. 2013; Bosse et al. 2014; Leno-Colorado et al. 2017; Zhu et al. 2017). We also compared the PSGs identified in our study with previous reports (Groenen et al. 2012; Li et al. 2013) (supplementary fig. 22, Supplementary Material online). Unexpectedly, there is very little intersection between different studies. The branch-site model used to detect positive selection is based on a likelihood ratio test for a predetermined branch of a phylogenetic tree (Yang 2007). We hypothesized that the different selection of taxa will result in different estimation of evolutionary rate in the background branches. Thus, each of them represents a specific evolutionary history, associating with ecological diversification and genomic adaptation. Nonetheless, we would like to note that without the genome information of the wild boar, we cannot pinpoint when these selection constraints occurred. Future studies, where the genome assembly of wild boar and, ideally, the genomes of early domesticated pigs are available, will probably further reveal the genetic basis underlying the evolution of the pig (S. scrofa).
Evolution of Olfaction and Taste
As two of the basic senses of mammals, olfaction, and taste play a very important role in daily life. The two types of chemical sensors involved, are important for recognizing environmental conditions, and have a positive coactivation (integration) in flavor perception (Murphy and Cain 1980; Veldhuizen et al. 2009).
ORs are largely responsible for odor perception and detection of chemical cues, facilitating the differentiation of tens of thousands of unique odorants. This makes olfaction an important physiological function in recognizing food, mates, offspring, territories, and predators. We identified 921 and 1089 functional ORs in Visayan warty pig and Duroc pig, respectively, more than found in most mammals, but lower than, for example, in mouse (1135 ORs). A large number of OR genes found in the mouse probably reflects its nocturnal lifestyle, urban living conditions, and the ability to identify various odors from complex environments (Restrepo et al. 2004). Olfactory gene families expanded in the ancestral Sus branch, and have further, independently, expanded in the two Sus linages. Functional categories of expanded ORs in Visayan warty pig are different from Duroc pig, which suggests that environmental adaptation of the two species is driven by the olfactory system. For example, we found expanded ORs involved in the identification of fatty odor in Duroc pig. Wild Suiformes are foraging animals with a diet consisting roughly 90% of plant-derived foods such as fruits, roots, leaves, and grasses. The relative amount of dietary fat is usually low (<10%; Leus 1994; Ballari and Barrios-García 2014; Souron et al. 2015), whereas in the swine industry additional fat is added to feed for a better performance (Lewis and Southern 2000). Fat-related OR duplications could be the consequence of adaptation to a high-fat diet. Another explanation is that forest nuts, which are rich in fats, form an important component of wildboar diet (Schley and Roper 2003; Baubet et al. 2004). Increasing fat-related OR genes may boost the ability of tracing nuts in the ancestral wildboar. Lastly, diversification of genes within each OR subfamily in Visayan warty pig is lower than in Duroc pig. Visayan warty pig is specialized to the tropical island habitat in Southeast Asia. In contrast, the source population of the domesticated pigs, the wild boar (S. scrofa), has a vast distribution range across most of the Eurasian continent (also including ISEA). This may have resulted in wild boar having a broader range of olfactory genes to be able to cope with more diverse environmental factors.
Taste receptors play a fundamental role in survival through the identification of dietary nutrients or potentially toxic compounds. Thus, dietary adaptation through selection on taste sensing is likely a major evolutionary force. TAS2R42 and TAS2R39 in Visayan warty pig are under positive selection. Similarly, several TAS2R genes are under positive selection in mouse, which is also under free-living conditions. TAS2Rs are part of the sensory mechanism to identify potentially toxic compounds by bitter taste (Bachmanov and Beauchamp 2007). This positive selection can be explained by adaptation to avoid undesirable substances, for example, plant and insect toxins. Accordingly, relaxed selection constraints can lead to trait reduction or loss (Lahti et al. 2009; Bely 2010; Wicke et al. 2016). Relaxed selection of fat sensory genes in Duroc pig indicated a weakened fatty taste sensibility, which may be due to captive breeding.
Pigs have a limited ability to taste NaCl (Danilova et al. 1999; Hellekant and Danilova 1999). By comparing the pig genomes to other mammalian species, two INDELs in SCNN1B and TRPV1 were identified in Visayan warty pig and Duroc pig (fig 4c, supplementary fig. 19, Supplementary Material online). Since those INDELs are located in an evolutionary conserved region, and, by modeling the proteins, their existence will change the conformation of the hydrophobic surface (supplementary fig. 20, Supplementary Material online). The observed changes, therefore, could potentially influence transport of ions, resulting in reduced nerve response to salty gustatory stimulation in Sus species. Moreover, we observed pseudogenization of an acid taste receptor PKD1L3, overlapping with DHODH, which is private to Visayan warty pig and Duroc pig. PKD1L3 is present in most mammalian species and does not overlap with DHODH. Nerve pulse recordings during taste stimulation indicate that acids give a distinct taste to the pig (Hellekant and Danilova 1999; Glaser et al. 2001). Further research is needed to validate the association between the absence of PKD1L3 and the sour preference of pigs.
Conclusions
Our comprehensive evolutionary and comparative genome analyses provided insight into the genomics of recent species divergence. Comparing the chromosome-level assembly of Visayan warty pig with domestic Duroc pig revealed genome evolution and reproductive division among Suidae. We identified numerous genetic differences correlated with natural selection for local adaptation and artificial selection during domestication, especially on olfaction and taste, shedding new light on the origin of species-specific characteristics. This study provides valuable genomic resources as well as insights into not only the evolution and diversification of Suiform but also our understanding of mammalian genome biology.
Materials and Methods
Sample Collection and Sequencing
DNA of a female Visayan warty pig was obtained from tissue samples at the Rotterdam Zoo. Tissues for RNA-seq were dissected from seven organs (liver, spleen, lymph, muscle, lung, frontal lobe, olfactory bulb).
10× Genomics Library
Visayan warty pig’s genomic DNA was size selected for fragments >40 kb on a BluePippin instrument (Sage Sciences, Beverly, MA, USA) and Illumina sequencing libraries were constructed using the 10× Genomics Chromium Controller instrument with the Genome Reagents Kit v2 chemistry (10× Genomics, Pleasanton, CA, USA) according to the manufacturer’s recommendations. The resulting Illumina library was sequenced on a NextSeq500 using a High Output Kit v2 for paired-end, 2 × 151 bp run (Illumina, San Diego, CA, USA).
Hi-C Library
The Hi-C library was generated by Dovetail Genomics as described by Lieberman-Aiden et al. (2009). Briefly, for each library, chromatin was fixed in place with formaldehyde in the nucleus and then extracted. Fixed chromatin was digested with DpnII, the 5′ overhangs filled in with biotinylated nucleotides, and then free blunt ends were ligated. After ligation, crosslinks were reversed, and the DNA purified from protein. Purified DNA was treated to remove biotin that was not linked to ligated fragments. The DNA was then sheared to a mean fragment size of ∼350 bp, and sequencing libraries were generated using NEBNext Ultra enzymes and Illumina-compatible adapters. Biotin-containing fragments were isolated using streptavidin beads before PCR enrichment of each library. The libraries were sequenced on an Illumina Hi-seq 4000 sequencing platform (2 × 151 bp).
Long Jumping Libraries
Briefly, DNA was extracted from the same Visayan warty pig tissues, and used to create two mate-pair libraries, with insert sizes of 10 and 20 kb, respectively. The mate-pair libraries were prepared with Illumina's “Nextera Mate-Pairs Sample Prep kit” followed by the “TruSeq DNA Sample Prep kit” and sequenced on Illumina HiSeq 2500 platform.
RNA-seq
High-quality RNA (1 μg) was used to generate TruSeq Stranded RNA-seq libraries (TruSeq Stranded RNA Sample Preparation Kit, Illumina, San Diego, CA, USA) by the HTS Lab (University of Illinois, Urbana, IL, USA) following standard protocols and sequenced on an Illumina HiSeq 2000 platform.
Genome Assembly
Based on linked reads that were sequenced with a standard Illumina system, we used the Supernova assembler (version 1.2.2, 10× Genomics Inc., Pleasanton, CA, USA) with the parameters (run –maxreads = 1,500,000,000; mkoutput –style = pseudohap2 –minsize = 500) to construct contigs and scaffolds of the Visayan warty pig.
Chromosome Assembly Using Hi-C
For the intermediary de novo assembly, Chicago library reads, and Dovetail Hi-C library reads were used as input data for HiRise (https://github.com/DovetailGenomics/HiRise_July2015_GR), a software pipeline designed specifically for using proximity ligation data to scaffold genome assemblies (Putnam et al. 2016). An iterative analysis was conducted. First, Shotgun and Chicago library sequences were aligned to the draft input assembly using a modified SNAP read mapper. The separations of Chicago read pairs mapped within draft scaffolds were analyzed by HiRise to produce a likelihood model for genomic distance between read pairs, and the model was used to identify and break putative misjoins, to score prospective joins, and make joins above a default threshold. After aligning and scaffolding Chicago data, Dovetail Hi-C library sequences were aligned and scaffolded following the same method. After scaffolding, shotgun sequences were used to close gaps between contigs.
Reference Guided and Long Jumping Reads Scaffolding
Since Visayan warty pig and Duroc pig (S. scrofa) (Frantz et al. 2013) are closely related, the HiRise assembly was subjected to a secondary assembly with AlignGraph (Bao et al. 2014) using the Sus scrofa11.1 reference genome (Warr et al. 2019) as guidance. Briefly, in the guided secondary assembly with AlignGraph the de novo generated scaffolds are aligned to the reference and the long jumping reads (10 and 20 kb insert size) are mapped to the assembled scaffolds and to the reference. This results in a paired-end multi-positional de Bruijn graph from which the scaffolds are extended if possible. The orientation of the chromosomes in S. cebifrons assembly is manually adjusted to match the orientation of the orthologous chromosomes in the pig reference genome.
Mitochondrial Genome Assembly
We randomly selected 4 Gb paired-end reads from resequencing libraries to assemble the mitochondrial genome sequence using MitoZ v2.3, resulting in a 16.52 kb circular assembly (supplementary fig. 3, Supplementary Material online).
Evaluation of Genome Assembly
The Illumina short reads from the 10× libraries were used for k-mer frequency analyses of genomes. A k-mer count analysis was done using Jellyfish v2.3.0 (Marçais and Kingsford 2011) on the Illumina data. From the paired-end reads, only the first read was truncated to 100 bp to avoid the lower quality part of the read. The second read was omitted from this analysis to avoid counting overlapping k-mers. A k-mer size of k = 21 was used. After converting the k-mer counts into a histogram format, this file was analyzed using Genomescope (Vurture et al. 2017). We used Perl script (https://github.com/calacademy-research/ccgutils/tree/master/asmstats) to summarize the statistics of genome assemblies with default options. Any more than ten consecutive N should split the scaffolds into contigs.
Evaluation of Genome Completeness with BUSCO
BUSCO v3.1.0 (Simão et al. 2015) was used to assess the genome completeness by estimating the percentage of expected single-copy conserved orthologs captured in the Visayan warty pig assembly, applying the mammalia_odb9 BUSCO set.
Cross-Species Hi-C Processing
Hi-C data for domesticated pig (large white) were downloaded from FR-AgENCODE (http://www.fragencode.org/results.html)86. The Hi-C reads from domesticated pig were mapped to the pig genome Sscrofa11.1 and the Visayan warty pig Hi-C was mapped to the Visayan warty pig assembly separately, using bwa mem 0.7.5a (Li and Durbin 2009) with parameters “-E50 -L0.” We mapped ∼7.31E+07 and 2.26E+07 Hi-C contact pairs for the Visayan warty pig and Duroc pig genomes, respectively. Next, we aligned the Hi-C contact pairs of Visayan warty pig to the pig genome. We mapped the aligned loci of the two ends of a contact pair in the Hi-C data of the Visayan warty pig from the original genome assembly to the pig genome with reciprocal mapping using the tool liftOver (Hinrichs 2006) based on the whole-genome alignment. We used HiCExplorer v3.0 (Ramírez et al. 2018) to create the contact matrices and extract the Hi-C contact maps of each species at the resolution of 50kb. Normalization was performed using Knight–Ruiz matrix balancing (Knight and Ruiz 2013). We applied Phylo-HMRF (Yang et al. 2019) to the multispecies Hi-C data to predict 20 hidden states. For all the autosomes and chromosome X in the Duroc pig genome, we run Phylo-HMRF jointly on the multiple synteny blocks of the chromosomes and identified possible different evolutionary patterns of the Hi-C contact frequencies across species in a genome-wide manner. We further categorized the 20 estimated hidden states based on their conservation status.
Identification of Repetitive Elements
We identified repetitive elements by a combination of homology alignment and de novo searches, as follows. We used RepeatMasker (Tarailo-Graovac and Chen 2009) with Repbase (v.16.10) (Jurka et al. 2005) to scan for sequences homologous to annotated repeat sequences in published databases and then used RepeatModeler (Jurka et al. 2005) with the default parameters to predict de novo TEs. We combined the repeat sequences identified by both methods as the final annotated repeat set. We integrated the overlapping TEs and removed those with scores <200. Subsequently, tandem repeats were annotated using Tandem Repeat Finder (Benson 1999) (version 4.07b; with the following settings: 2 7 7 80 10 50 2000 -d -h).
Gene Prediction
Gene prediction was conducted with the BRAKER v2.1.2 (Hoff et al. 2019) pipeline by integrating ab initio, transcriptome-based, and protein homology-based evidence. Ab initio gene predictions were performed with Augustus v3.3.2 (Stanke et al. 2006) and GeneMark-ET v4.33 (Lomsadze et al. 2014). Before starting the annotation process, we used the mammalia_odb9 BUSCO set to train Augustus. For prediction based on the RNA-seq data, all RNA reads were aligned to the Visayan warty pig genome by HISAT v2.1.0 (Kim et al. 2019). The results were used to identify candidate exon regions, donor, and acceptor sites. Protein sequences of all mammalian species were downloaded from UniProt (UniProt Consortium et al. 2015) as protein homology-based evidence.
Single exon genes (SEG) were identified as mono-exonic genes containing full-length open reading frames, as specified by the gene prediction pipeline. The same approach was applied to the human, mouse, dog, horse, cattle, and pig genomes. Lists of nonredundant SEG from all six genomes were obtained and aligned to the Visayan warty pig genome using TBLASTN (Camacho et al. 2009) (E-value cutoff: 1E−5). We aligned homologous genomic sequences against matching proteins to define gene models using GeneWise v2.4.1 (Birney and Durbin 2000). The function of the predicted OR genes was determined as described in Truong Nguyen et al. (2012). Gene annotation of mitochondria was performed using MitoZ software. EVidenceModeler v1.1.1 (Haas et al. 2008) was used to integrate the genes predicted by BRAKER and SEG approaches and generate a consensus gene set.
Functional Annotation
We annotated the functions of the protein-coding genes using BLASTP (E-value cutoff: 1E−5) (Camacho et al. 2009) based on entries in the Swiss-Prot and TrEMBL databases (UniProt Consortium et al. 2015). The motifs and domains were annotated using InterProScan v5.35 (Jones et al. 2014) by searching against publicly available databases, including ProDom, PRINTS, Pfam, SMRT, PANTHER, and PROSITE. The GO IDs for each gene were assigned according to the corresponding InterPro entry.
Noncoding Gene Element Prediction
We also predicted gene structures of tRNAs, rRNAs, and other noncoding RNAs. A total of 37,019 tRNAs were predicted using t-RNAscan-SE v2.0 (Lowe and Eddy 1996). Because rRNA genes are highly evolutionarily conserved, we choose human rRNA sequence as references and then predicted rRNA genes using Blast tool with default parameters. Small nuclear and nucleolar RNAs were annotated using the Infernal v1.1.2 (Nawrocki and Eddy 2013). lncRNAs were detected using FEELnc v.0.1.1 (Wucher et al. 2017) with default parameters and the output transcripts of the HISAT alignments.
Whole-Genome Alignments and Structural Variation
The Nucmer program from Mummer v3.23 (Haas et al. 2008) was used with -maxgap 50 and -breaklen 400 for comparing the genomes between Visayan warty pig to Duroc pig to obtain the synteny blocks. Structural variations between Visayan warty pig and Duroc pig were called using svmu as described by Chakraborty et al. (2019).
For multiple genome alignments from Visayan warty pig, Duroc pig, cattle, horse, dog, mouse, and human, we first aligned all genomes to the human genome using LAST v980 (Kiełbasa et al. 2011). Then, we used MULTIZ v11.2 (Blanchette et al. 2004) to merge the pairwise alignments into multiple genome alignments using the human genome as the reference. Approximately 241 Mb syntenic sequence is shared by the seven mammalian species.
Gene Family, Phylogenetic Analyses, and Divergence Time Calibration
We used the Orthofinder v2.3.3 to identify gene families/clusters (Emms and Kelly 2019). Genome sequences and annotations for Duroc pig, cattle, horse, dog, mouse, and human were downloaded from Ensembl 100 (https://www.ensembl.org). The longest proteins of each gene were aligned to one and another. The species-specific gene families were determined according to the presence or absence of genes for a given species. The shared family expansion and contraction analysis were conducted with CAFÉ v3.1 (De Bie et al. 2006).
Phylogenetic relationships were resolved based on the maximum-likelihood (ML) method as implemented in RAxML v8.2.3 (Stamatakis 2014) using the best-fitting model of substitutions, identified by jModelTest2 (Darriba et al. 2012). 10,057 high-quality 1:1 single-copy orthologous genes were used.
We estimated divergence times using an approximate likelihood method as implemented in MCMCtree (Yang 2007), with an independent relaxed clock and birth–death sampling. We used a float prior and a maximum bound age, with a scale parameter of c = 2. For the root divergence, we set the before (tU = 2 [100 Ma], P = 0.1, c = 2). For MRCA of Sus, we used the same fossil calibration as in Frantz et al. (2013) (tL = 0.2 [2 Ma], P = 0.1, c = 0.5).
DNA evolutionary rates in each species, the common ancestor of Sus and Artiodactyla was calculated using r8s (Sanderson 2003) based on the whole-genome alignments.
Identification of HCEs
PHAST v1.5 (Hubisz et al. 2011) was used to identify HCEs based on the multiple-genome sequence alignments. Firstly, we extracted the 4-fold degenerate sites from the multiple-genome alignments generated above and used phyloFit (in PHAST v1.5 package) to estimate a neutral phylogenetic model (also considered as the nonconserved model in PhastCons). Then we ran PhastCons (in PHAST v1.5 package) to estimate conserved and nonconserved models and predicted conserved elements and conservation scores based on the conserved and nonconserved models. We identified 1,162,748 HCEs, covering 137.2 Mb of the human genome. Further, we identified SHCEs, which are conserved in Sus species, but not in other mammalian species. We used phyloP (in PHAST v1.5 package, with the parameters: phyloP –method LRT –mode CONACC) under the nonconserved model. Finally, we identified 49,846 SHCEs, covering 13.9 Mb.
Noncoding conserved regions usually contain regulatory elements, that is, TFBSes. We downloaded the human TFBS data from the UCSC data set generated by the ENCODE project (ftp://hgdownload.cse.ucsc.edu/goldenPath/hg38/encRegTfbsClustered/encRegTfbsClusteredWithCells.hg38.bed.gz) to compare the conservation degrees of SHCEs. We found that of 4,379,357 human TFBSes used in the analysis, 71,908 (1.6%) were conserved in Sus.
Identification of Selective Constraint in Genes
Positively Selected Genes
The strength of positive selection on each codon of each orthologous gene along a specific targeted lineage of a phylogenetic tree was estimated with the branch-site model using the Codeml program of the PAML package v4.9. To determine to what degree these codon sequences, along the targeted lineage fit the branch-site model (including positive selection) better than the one containing neutral selection or negative selection. An alternative branch-site model (Model = 2, NSsites = 2, and Fix = 0) and a null branch-site model (Model = 2, NSsites = 2, Fix = 1, and Fix ω = 1) were combined to calculate log-likelihood values for each model using likelihood ratio tests. The log-likelihood values generated were used to assess the model fit, using the χ2 test with one degree of freedom. Genes with a P-value < 0.05 were treated as candidates under positive selection.
Rapidly Evolved Genes
Branch model in Codeml was used to identify evolutionary rate among orthologous genes. To determine whether these codon sequences, along the targeted lineage, are evolving under a different evolutionary rate than other lineages, an alternative branch-site model (Model = 2) and a null branch-site model (Model = 0) were combined to calculate log-likelihood values for each model using likelihood ratio tests. Genes with a P-value < 0.05 and a higher ω value for the foreground than the background branches were considered as evolving at a faster rate.
Relaxed Selected Genes
RELAX (Wertheim et al. 2015) analyses were also performed to evaluate whether selective constraints are stronger in foreground branches compared with background branches. An input file that contains the codon sequence alignment and the RAxML tree was provided, and the foreground branches (test branches) and background branches (reference branches) were then indicated before running the analysis. A likelihood ratio test was also performed to evaluate if selection varied between test and reference branches. A significant result (P-value < 0.05) indicates a stronger level of selection if K is >1 or a weaker selection or relaxed constraint if K is <1.
Functional, Pathway, and Interaction Enrichment Analysis
KOBAS (version 3.0) (Wu et al. 2006) was applied to perform GO analyses (including cellular composition, molecular function, and biological process terms), Reactome pathway analyses, and Kyoto Encyclopedia of Genes and Genomes pathway enrichment analyses. False discovery rate was performed to adjust P-values using the Benjamini and Hochberg method. An adjusted P-value of <0.05 was used as the cutoff criterion.
Interspecies Conservation of Taste Receptor Genes
We used genomic evolutionary rate profiling (GERP++) (Davydov et al. 2010) to estimate the interspecies conservation of taste receptor genes. GERP++ provides conservation scores through the quantification of position-specific constraint in multiple-species alignments. We calculated and attributed the GERP scores for each nucleotide site.
Protein Structure Modeling
The three-dimensional homology models of proteins were obtained using Swiss-Model (https://swissmodel.expasy.org/) (Waterhouse et al. 2018) to search for templates and build the models. The predicted protein structures were estimated based on target–template alignment using ProMod3 on SWISS-MODEL server (https://swissmodel.expasy.org/). Models were built based on the target–template alignment using ProMod3. The global and per-residue model quality was assessed using the QMEAN scoring function.
Supplementary Material
Supplementary data are available at Molecular Biology and Evolution online.
Acknowledgements
The authors thank Willem Schaftenaar (diergaarde blijdorp) for technical assistance. L.L. was financially supported by the China Scholarship Council (Grant No. 201707720055). M.B. was financially supported by NWO grant 016.Veni.181.050. This project was financially supported by a European Research Council grant (ERC-2009-AdG: 249894). Genetic martial of Visayan warty pig (medical euthanasia) was obtained from tissue samples collected by veterinarians at the Rotterdam Zoo, The Netherlands, together with researcher from Wageningen University, according to national legislation. Tissue samples obtained are derived from animals culled within the wildlife management program of the Rotterdam Zoo.
Author Contributions
M.A.M.G., O.M., and L.L. designed the scope of the study. L.L. analyzed the data; L.L. and Q.H. performed the Hi-C analyses; L.L., H.-J.M., M.B., M.A.M.G., and O.M. discussed the results; L.L. wrote the manuscript; H.-J.M., M.B., M.A.M.G., and O.M. provided valuable suggestion and comments to improve the manuscript. The author(s) read and approved the final manuscript.
Data Availability
The sequencing data have been deposited in the ENA database as Bioproject PRJEB38928, as well as in Open Science Framework project page (https://osf.io/6yznw). Scripts and code used for data generation and analyses are archived on Github (https://github.com/llq0325/Sus_cebifrons_genome).
