


Abstract
Recombination is beneficial over the long term, allowing more effective selection. Despite long-term advantages of recombination, local recombination suppression can evolve and lead to genomic degeneration, in particular on sex chromosomes. Here, we investigated the tempo of degeneration in nonrecombining regions, that is, the function curve for the accumulation of deleterious mutations over time, leveraging on 22 independent events of recombination suppression identified on mating-type chromosomes of anther-smut fungi, including newly identified ones. Using previously available and newly generated high-quality genome assemblies of alternative mating types of 13 Microbotryum species, we estimated degeneration levels in terms of accumulation of nonoptimal codons and nonsynonymous substitutions in nonrecombining regions. We found a reduced frequency of optimal codons in the nonrecombining regions compared with autosomes, that was not due to less frequent GC-biased gene conversion or lower ancestral expression levels compared with recombining regions. The frequency of optimal codons rapidly decreased following recombination suppression and reached an asymptote after ca. 3 Ma. The strength of purifying selection remained virtually constant at dN/dS = 0.55, that is, at an intermediate level between purifying selection and neutral evolution. Accordingly, nonsynonymous differences between mating-type chromosomes increased linearly with stratum age, at a rate of 0.015 per My. We thus develop a method for disentangling effects of reduced selection efficacy from GC-biased gene conversion in the evolution of codon usage and we quantify the tempo of degeneration in nonrecombining regions, which is important for our knowledge on genomic evolution and on the maintenance of regions without recombination.
Introduction
Recombination is beneficial over the long term in most situations, allowing higher selection efficacy and therefore more rapid adaptation. Meiotic recombination, through crossing-over resulting in the reciprocal exchange of DNA segments between two homologous chromosomes, shuffles allelic combinations, such that more beneficial combinations might be formed (Fisher 1930; Muller 1932) and selection at different loci can be decoupled (Bernstein et al. 1981; Otto and Lenormand 2002). Over long-time scales, crossover events indeed occur along chromosomes and selection can apply at each locus independently. Recombination prevents selection interference between loci (Hill and Robertson 1966), thereby facilitating the purge of deleterious mutations. In the absence of recombination, selection on strongly beneficial alleles can increase the frequency of linked deleterious alleles through genetic hitchhiking (Maynard Smith and Haigh 1974). Recombination also prevents the accumulation of deleterious mutations by generating chromosomes with fewer deleterious mutations than parental ones, thus avoiding the increase in the frequency of genotypes with a higher number of harmful mutations, known as Muller’s ratchet (Fisher 1930; Muller 1932).
Despite these long-term advantages of recombination, local recombination suppression can be selected for, thereby maintaining beneficial allelic combinations and leading to a genetic structure known as a supergene with multiple linked genes that are transmitted as a single locus (Schwander et al. 2014; Gutiérrez-Valencia et al. 2021). Examples of complex phenotypes controlled by supergenes include wing patterns in Heliconius butterflies (Nadeau 2016; Saenko et al. 2019), social systems in ants (Wang et al. 2013), and mating compatibility systems, such as sex chromosomes or mating-type loci (Westergaard 1958; Ohno 1967; Charlesworth and Charlesworth 1978; Hartmann et al. 2021). The suppression of recombination can thus arise and be maintained by selection, but the corresponding genomic regions then accumulate deleterious mutations through interferences between loci and Muller’s ratchet (Charlesworth and Charlesworth 2000; Bachtrog 2013; Stolle et al. 2019; Gutiérrez-Valencia et al. 2021; Jay, Chouteau, et al. 2021). Typical deleterious mutations include nonsynonymous substitutions (Nicolas et al. 2004; Berlin and Ellegren 2006; Whittle et al. 2011; Hough et al. 2014; Papadopulos et al. 2015; Brion et al. 2020) which alter the amino-acid sequence of a protein and may result in protein dysfunction. Deleterious mutations also include frameshift mutations, gene losses, and substitutions leading to suboptimal gene expression level (Steinemann and Steinemann 1992; Bachtrog 2005; Bartolomé and Charlesworth 2006). Such deleterious mutations in sex chromosomes may be responsible for genetic diseases (Bianchi 2009; Lee et al. 2016). Genomic rearrangements (Badouin et al. 2015), epigenetic modifications (Yan et al. 2005), and transposable elements (Steinemann and Steinemann 1992; Stolle et al. 2019) also accumulate in nonrecombining regions; they are not per se deleterious mutations but may disrupt gene function or expression and impose strong energetic costs (Hollister and Gaut 2009; Li et al. 2016).
A less studied type of deleterious mutation concerns some synonymous substitutions. Synonymous substitutions are usually considered neutral because they do not alter the amino-acid sequences of proteins. However, synonymous codons are often not used randomly (Sharp et al. 1995; Duret 2002), some codons being preferentially used over their synonymous alternative codons. This preference is thought to result from selection on either the rate or the accuracy of translation (Machado et al. 2020), with the preferred codons called optimal codons. Optimal codons tend to correspond to the most abundant tRNAs (Post et al. 1979; Ikemura 1981), and are most frequent in highly expressed genes for which it is most important to avoid limitations in tRNAs (Novoa and Ribas de Pouplana 2012; Zhou et al. 2016; Wint et al. 2022).
The existence of preferred codons among synonymous alternatives leads to a codon usage bias, which is directly proportional to the recombination rate along genomes (Kliman and Hey 1993). Such deviations from preferred codon usage is thought to result from low selection efficacy in regions with low or no recombination (Bartolomé and Charlesworth 2006). Compared with recombining regions, lower frequencies of optimal codons have been reported in the nonrecombining region of the mating-type chromosomes in the fungus Neurospora tetrasperma (Whittle et al. 2011), in the nonrecombining dot chromosomes in Drosophila americana (Betancourt et al. 2009), and in 12 other Drosophila species (Vicario et al. 2007). However, codon biases could also result from the biased mutational pattern caused by GC-biased gene conversion. Occurring in regions of frequent recombination, gene conversion results from the resolution of base-pair mismatches in the heteroduplex of the recombination process (Duret and Galtier 2009). GC-biased gene conversion occurs in bacteria (Lassalle et al. 2015) and eukaryotes (Marais 2003; Duret and Galtier 2009; Pessia et al. 2012; Weber et al. 2014). Thus, reduced codon bias in nonrecombining regions would be consistent with either fewer GC-biased gene conversion events or less efficient selection, and the respective effects of these two processes may be difficult to disentangle. Few studies have tried to distinguish the roles of relaxed selection versus GC-biased gene conversion (Kostka et al. 2012) and no study to our knowledge specifically attempted to control for the effect of GC-biased gene conversion in assessing the effect of the lack of recombination on the frequency of optimal codons.
While the accumulation of deleterious mutations in nonrecombining regions has been reported in numerous systems, only a few studies with limited data have addressed the question of the tempo of degeneration that is, the rate at which deleterious mutations accumulate over time (Charlesworth 2021). Theoretical works based on the mammalian Y-chromosome predict that degeneration through gene losses should occur rapidly in young nonrecombining regions, mainly due to Muller’s ratchet and background selection, and more slowly in older nonrecombining regions in which genetic hitchhiking is a major driving force (Bachtrog 2008, 2013). Such patterns of slower gene loss rate with increasing age of recombination suppression have been observed not only in mammals (Hughes and Rozen 2012; Bellott et al. 2014) but also in the plant Silene latifolia, where the sex chromosomes underwent two successive recombination suppression events, that is, evolutionary strata (Lahn and Page 1999). These have been losing genes at estimated rates of 4.64% and 6.92% per My for the older and younger evolutionary strata, respectively (Krasovec et al. 2018). However, a formal study of the tempo of degeneration requires data from a large number of independent events of recombination suppression of varying ages, which has not been available so far (Charlesworth 2021). Recombination suppression has however evolved numerous times in a wide range of organisms, even sometimes multiple independent times within the same genus (Mrackova et al. 2008; Ma and Veltsos 2021). Moreover, the evolutionary strata present in some sex chromosomes represent stepwise extension events of recombination suppression that occurred at different time points; for example, the four successive steps of recombination suppression on the mammalian Y chromosome (Lahn and Page 1999; Skaletsky et al. 2003; Ross et al. 2005).
In the fungal genus Microbotryum, recombination suppression has evolved independently in several species, leading to mating-type chromosomes of different ages, some showing stepwise extension of recombination suppression and thereby the formation of evolutionary strata (Branco et al. 2017, 2018; Carpentier et al. 2019; Duhamel et al. 2022). In these pathogenic anther-smut fungi, mating occurs mostly between haploid cells resulting from the same meiosis event (i.e., intratetrad mating or automixis [Hood and Antonovics 2000]) and between cells bearing distinct alleles at the two mating-type loci, that is, the pheromone receptor (PR) locus (carrying pheromone and PR genes controlling gamete fusion) and the HD locus (carrying homeodomain genes whose proteins undergo dimerization to induce postmating growth). Recombination suppression linking a few genes within each of the two mating-type loci is required for ensuring correct mating-type functions, and is the ancestral condition in the basidiomycete fungi (Coelho et al. 2017; Hartmann et al. 2021). In Microbotryum and some other selfing basidiomycetes, the linkage of the two mating-type loci to each other or the linkage of each mating-type locus to its respective centromere has been favored by selection (Branco et al. 2017, 2018; Carpentier et al. 2019; Hartmann et al. 2021). Indeed, under intratetrad mating these linkage relationships increase the odds of gamete compatibility (producing only two intercompatible mating-type phenotypes among haploid meiotic products) compared with independent segregation (producing up to four different mating types among gametes following a meiosis). Across the Microbotryum genus, five independent recombination suppression events have been shown to link the PR and HD loci to each other (Branco et al. 2017, 2018). The two mating-type loci were ancestrally located on different chromosomes, and multiple PR–HD linkage events across lineages involved distinct rearrangements (fusion and/or fission) of the ancestral PR and HD chromosomes (Branco et al. 2018). Two additional recombination suppression events in other Microbotryum species independently linked each of the PR and HD loci to its respective centromere (Carpentier et al. 2019). Furthermore, extensions of recombination suppression have occurred stepwise and independently in several Microbotryum species, forming evolutionary strata of different ages (Branco et al. 2017, 2018). The evolutionary strata linking HD and PR loci to each other or to centromeres were all called “black evolutionary strata”, though they corresponded to several independent events, often trapping different sets of genes. In some cases, the full recombination cessation linking the HD and PR loci occurred in several steps and the corresponding strata were distinguished as grey and black (Duhamel et al. 2022). Extensions of recombination suppression to nonmating-type genes were called colored evolutionary strata (Branco et al. 2017, 2018). The oldest evolutionary strata extending recombination suppression to nonmating-type genes occurred around each of the PR and HD loci; these strata likely evolved before the radiation of the Microbotryum genus because they are shared by all species studied so far. Other species-specific strata arose more recently and distal to the fused PR–HD loci. All species retain a recombining region at least at one extremity of their mating-type chromosome, called the pseudoautosomal region (PAR).
The nonrecombining regions in the Microbotryum mating-type chromosomes seem to have accumulated multiple footprints of degeneration, in the form of higher rate of nonsynonymous substitutions, transposable element accumulation, gene losses and reduced gene expression (Fontanillas et al. 2015). However, our understanding of the mating-type chromosome content and evolution has changed since, with improved assembly quality and the discovery of the independent origins of the nonrecombining regions across species as well as multiple evolutionary strata within species. High-quality assemblies permitted us to detect independent recombination suppression in five Microbotryum species, with accompanying degeneration including gene gain/loss and transposable element accumulation (Branco et al. 2018). Regions with older recombination suppression appeared more degenerated (Branco et al. 2018), but the tempo of degeneration was not studied. Degeneration in terms of gene expression level was also found based on the high-quality assembly of Microbotryum lychnidis-dioicae, with reduced expression being associated with different types of degenerative mutations (Ma et al. 2020).
Here, we investigated the tempo of degeneration in nonrecombining regions, that is, the relationship between deleterious mutation accumulation and time since recombination cessation, taking advantage of the multiple independent linkage events and of evolutionary strata of different ages in the anther-smut fungi. We first identified three additional independent events of recombination suppression that arose from linking the PR and HD loci on the mating-type chromosomes, using the genome assemblies reported here for the first time of Microbotryum violaceum tatarinowii, Microbotryum violaceum melanantha, and Microbotryum coronariae. We also identified two additional old strata in the large nonrecombining mating-type chromosome of Microbotryum violaceum paradoxa. Using high-quality genome assemblies of alternative mating types of 13 Microbotryum species we estimated the degeneration levels in terms of the accumulation of nonoptimal codons and nonsynonymous substitutions in 22 independent evolutionary strata of different ages. We identified optimal codons as those enriched in highly expressed autosomal genes and tested whether these were less frequent in nonrecombining regions after controlling for the following possible confounding effects: 1) lower GC-biased gene conversion in nonrecombining regions, by comparing GC content in coding versus noncoding regions, because selection on codon usage acts only in exons while GC-biased gene conversion also impacts introns and intergenic sequences and 2) lower ancestral expression levels in nonrecombining regions, taking as a proxy the expression level in a closely related outgroup without recombination suppression. We then investigated the relationship between degeneration level (in terms of nonsynonymous substitution accumulation and decrease in frequency of optimal codons) and the time since recombination suppression in the different evolutionary strata and species. We found that the frequency of optimal codons rapidly decreased following recombination suppression and reached an asymptote at ca. 3 My. The strength of purifying selection remained virtually constant at an intermediate level between purifying selection and neutral evolution: the ratio of nonsynonymous over synonymous differences between alleles on alternative mating-type chromosomes (dN/dS) indeed remained at 0.55. Accordingly, the nonsynonymous mutation differences (dN) between mating-type chromosomes increased linearly with stratum age. Understanding the tempo of degeneration is important for our knowledge on genomic evolution, in particular for the maintenance of regions without recombination, that can be associated with lower fitness and human genetic diseases (Wilson 2021).
Results
PR–HD Linkage in Three New Microbotryum Genomes
We sequenced (long-read Pacific Bioscience technology) and assembled the genomes from haploid cells bearing opposite mating types (called a1 and a2) of a single diploid individual, for the following species: Microbotryum violaceum (s.l.) parasitizing Silene melanantha (called M. v. melanantha), M. violaceum (s.l.) parasitizing S. tatarinowii (called M. v. tatarinowii), and M. coronariae parasitizing Silene flos-cuculi (Syn. Lychnis flos-cuculi) (fig. 1A; supplementary table S1, Supplementary Material online). In most species, the mating-type chromosomes were assembled in one or few contigs, in the latter case being broken not at the same position in the two mating-type chromosomes within diploid individuals (supplementary fig. S1, Supplementary Material online), which allowed joining contigs. We reconstructed the evolutionary history of mating-type chromosomes by comparing their genome structure to those of M. intermedium, taken as a proxy for the genomic ancestral state, following previous studies (Branco et al. 2017, 2018). In M. intermedium, the PR and the HD mating-type loci are located on distinct mating-type chromosomes (supplementary fig. S2, Supplementary Material online). In the case of M. coronariae, we could not assess the respective positions of several contigs within the nonrecombining region (supplementary fig. S1, Supplementary Material online), but this did not affect the general scenario of rearrangements (fig. 1A) as these contigs could be assigned to the nonrecombining region given the rearrangements between mating types and could be assigned to ancestral mating-type chromosome arms (supplementary fig. S1, Supplementary Material online). For reconstructing the scenarios of chromosomal rearrangements, mating-type chromosome fissions (always at centromeres) were inferred by assessing what chromosome arms became autosomes (i.e., completely collinear between mating types and assembled separately from the mating-type chromosomes in both haploid genomes; supplementary fig. S1, Supplementary Material online). The orientations of ancestral mating-type chromosome fusions were inferred by assessing on supplementary fig. S1, Supplementary Material online what edges of ancestral mating-type chromosomes remained recombining (i.e., became PARs, the other edge or centromere then corresponding to the fusion point).
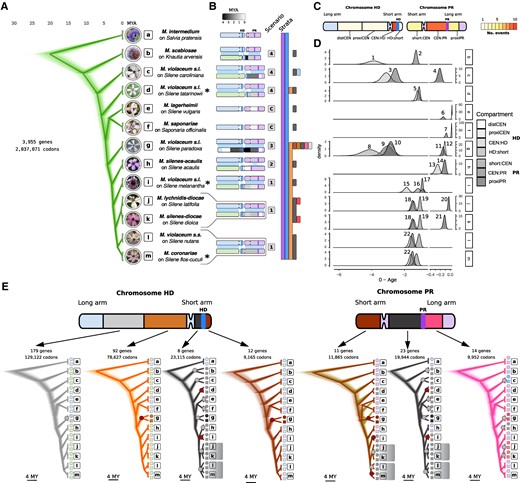
Timetrees and rearrangement scenarios of recombination suppression events in the Microbotryum genus. (A) Densitree plot of 1,000 randomly sampled trees with the best posterior probabilities based on the concatenation of single-copy autosomal genes (green traces). Tips are labeled with scientific names of Microbotryum fungi and of their hosts. Boxed letters serve as a guide for species labels in panels D and E. Asterisks indicate the species whose genomes are reported here for the first time. Photos of diseased flowers by M.E. Hood. (B) Rearrangement scenarios as cartoons and presence of evolutionary strata across the phylogenetic tree (vertical-colored bars). Extant recombining regions in mating-type chromosomes are colored in blue or purple when corresponding to the ancestral HD or PR chromosome, respectively. Nonrecombining regions are colored according to the linear gradient displayed at the top in millions of years since the onset of recombination suppression. Pale green chromosomes are autosomes derived from the fission of the long arm of the ancestral HD chromosome or the short arm of the ancestral PR chromosome. (C) Diagram of ancestral mating-type chromosomes showing the different regions involved in recombination suppression events. Regions are colored according to the number of independent suppression of recombination events in which these have been involved (gradient at the right). distCEN, distal region to the HD centromere on the long arm; proxiCEN, proximal region to the HD centromere on the long arm; CEN:HD, region between the centromere and the HD locus; HD:short, region between the HD locus and the short arm telomere; short:CEN, short arm of the PR chromosome; CEN:PR, region between the centromere and the PR locus; proxiPR, region proximal to the PR locus towards the long arm telomere. (D) Density distributions of date estimates for recombination suppression events. Note that the range between 0 and 0.2 Ma is expanded. The 22 timepoints used for studying the tempo of degeneration are numbered on the plots. (E) Densitree plots for the different regions involved in recombination suppression events. For each region the number of genes indicated in the insets were concatenated to reconstruct 107 ultrametric trees, from which 1,000 randomly sampled trees among the 7.5 × 10⁶ with best posterior probabilities are plotted. Trees are colored according to the named strata in Microbotryum violaceum paradoxa (Fig. 2F). Shadowed clades show trans- specific polymorphism (i.e., alleles clustered by matingtype rather than by species). The species M. v. paradoxa (g) branches differently in the short arm of the PR chromosome and the PR:CEN regions than in the species tree. Note that the tree based on the short arm of the PR chromosome has two alternative topologies. Large dots on internal nodes correspond to the suppression of recombination events (colored red for those first described here). Symbols at the tips correspond to the alternate matingtypes and they are colored according to the focal stratum.
In M. v. melanantha and M. coronariae, the mating-type chromosomes carried both PR and HD loci and were found to result from the fusion of the whole ancestral PR chromosome with the short arm of the ancestral HD chromosome (fig. 1A and supplementary fig. S1, Supplementary Material online), as was previously found in M. lychnidis-dioicae, Microbotryum silenes-dioicae and M. violaceum sensu stricto (Branco et al. 2017, 2018). Thus, the mating-type chromosomes of the five species in this clade resulted from the same chromosomal rearrangements. However, trans-specific polymorphism analyses, detailed below, suggested three independent events of complete recombination cessation in this clade (fig. 1E). Indeed, as soon as recombination cessation links a gene to the mating-type locus, the alleles of this gene associated to the alternative mating-type alleles start diverging and accumulate mutations independently. The alleles of such a nonmating-type gene will thus cluster per mating type, even across speciation events. The node to which trans-specific polymorphism extends therefore indicates the date of complete recombination cessation (Hartmann et al. 2021). Despite the different rearrangements having led to HD and PR linkage across the Microbotryum phylogeny, a subset of 32 genes was shared among nearly all types of black strata, that is, were initially located between the mating-type loci for all types of rearrangements except in Microbotryum silenes-acaulis. Genealogies for these 32 genes, including also their sequences from M. silenes-acaulis and M. intermedium, despite being in recombining regions in these species, revealed patterns of trans-specific polymorphism consistent with three independent events of complete recombination cessation (fig. 1E): one in M. v. melanantha (with no trans-specific polymorphism), one in the lineage leading to M. lychnidis-dioicae and M. silenes-dioicae (two species sharing trans-specific polymorphism), and one in the lineage leading to M. coronariae on L. flos-cuculi and M. violaceum (s.s.) on Silene nutans (also sharing trans-specific polymorphism one with each other). Alternatively, there could have been a single chromosomal rearrangement event in the common ancestor of the clade encompassing these five species, but without initially complete recombination cessation, this occurring later, independently in the three lineages. For our purposes, studying the consequences of recombination suppression, the three independent events of complete recombination cessation are the important events, regardless of whether the initial chromosome fusion occurred once or three times independently, and we therefore considered in the following these three black evolutionary strata as independent.
In M. v. tatarinowii, the mating-type chromosomes resulted from the fusion of a part of the long arm of the PR chromosome with the short arm of the HD chromosome (fig. 1A; supplementary fig. S1, Supplementary Material online). We found the remaining part of the ancestral PR chromosome on an autosomal contig in the two haploid genomes of M. v. tatarinowii. This represents the same type of chromosomal rearrangement leading to PR–HD linkage as previously found in Microbotryum violaceum caroliniana (Branco et al. 2018). However, the phylogenetic placement of the two species shows that they represent independent events (fig. 1A). In addition, we improved the assemblies of Microbotryum scabiosae (supplementary table S2, Supplementary Material online) and refined the chromosomal rearrangement scenario for M. v. caroliniana. We could thus refine the breakpoint locations for the fissions and fusion generating their mating-type chromosomes (supplementary fig. S3, Supplementary Material online).
Evolutionary Strata
We investigated the existence of evolutionary strata in M. v. melanantha, M. v. tatarinowii, and M. coronariae following the methods used previously (Branco et al. 2017, 2018), that is, by plotting the synonymous divergence calculated between the alleles from the genomes of opposite mating types along the ancestral-like gene order of M. intermedium (fig. 2). The rationale of this method is that, as soon as some genes become linked to the mating-type genes, the alleles associated with the two mating-type alleles gradually accumulate substitutions independently, so that their differentiation increases with the time since recombination suppression. Stepwise extension of recombination suppression therefore yields a pattern of discrete strata with different levels of differentiation between alleles on the mating-type chromosomes. In contrast, we expect high levels of homozygosity in these selfing species in recombining regions, and therefore no differentiation between the two genomes derived from a diploid individual, including in PARs. The evolutionary strata may however be difficult to distinguish using only differentiation levels, so we delimited strata based on 1) the distribution of recombination suppression across the phylogenetic tree to assess when recombination suppression evolved and thereby identifying distinct evolutionary strata, that is, genomic regions that stopped recombining at different times (fig. 1D), as well as 2) the level of trans-specific polymorphism (fig. 1E), that is also a strong indicator of the time of recombination suppression.
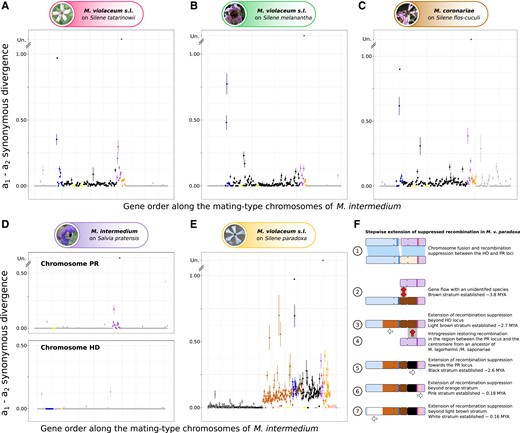
Allelic divergence analysis between mating-type chromosomes for the newly sequenced species and evolution of the mating-type chromosomes in Microbotryum violaceum paradoxa. For each species (A) Microbotryum violaceum tatarinowii; (B) Microbotryum violaceum melanantha; (C) Microbotryum coronariae; (D) Microbotryum intermedium; and (E) Microbotryum violaceum paradoxa, we show the synonymous divergence calculated between alternative mating types and plotted along the M. intermedium mating-type chromosome gene order. Zero dS values between mating-type chromosomes indicate recombination in these selfing species and the level of dS between mating-type chromosomes increases with time since recombination suppression. Different evolutionary strata, that is, different steps extending recombination suppression, are indicated by different colors. Divergence between the a1 and a2 PR alleles was too extensive for dS to be calculated (depicted as “Un” for unalignable). The different strata were delimited based on their presence in the various species across the phylogenetic tree (Figs. 1A and B) and their level of trans-specific polymorphism (Fig. 1E). (E) Scenario of the mating-type chromosome evolution in M. v. paradoxa.
We identified four evolutionary strata in each of M. v. melanantha, M. v. tatarinowii, and M. coronariae. Three strata are ancient and shared among most Microbotryum species, that is, the purple stratum around the PR locus, the blue stratum around the HD locus, and the orange stratum adjacent to the purple stratum (figs. 1A and 2A–D). In addition, recombination suppression that linked the HD and PR loci together evolved at different times in these three species (fig. 1D). We called all these regions involved in the different events of HD–PR linkage the black evolutionary strata, but they resulted from different types of chromosomal fissions and fusions and therefore encompass distinct gene sets (fig. 1A). We identified no additional evolutionary strata younger than the PR–HD linkage events in any of the species that we sequenced in the present study. For all statistical analyses we considered only independent events of recombination suppression, analysing the genomic regions corresponding to the species-specific strata or to the independent black strata (independent events linking HD and PR loci to each other or to their centromere that often trapped different gene sets). We did not include in our statistical analyses the oldest strata shared by multiple species that arose in a common ancestor, although we checked that similar results were obtained when including all strata.
The mating-type chromosome of M. v. paradoxa was formed by the fusion of the whole HD and PR ancestral mating-type chromosomes (Branco et al. 2018). The two most recent strata in M. v. paradoxa identified previously are distal to the mating-type loci and were called pink and white strata (fig. 2E). The analysis of single-copy genes in its mating-type chromosomes showed that the recombination suppression previously called black stratum in M. v. paradoxa actually occurred in multiple steps. The oldest event of recombination suppression corresponded to the genes located ancestrally between the HD-chromosome centromere and the PR locus (“brown” stratum, fig. 2F), thus linking the two mating-type loci. Recombination later stopped distal to the ancestral HD chromosome centromere on the long arm of the ancient HD chromosome (“light-brown”stratum), spreading to nonmating-type genes (fig. 2F). This was followed by an introgression from an ancestor of M. lagerheimii and M. saponariae, with still-recombining mating-type chromosomes, thus restoring recombination between the centromere and the PR locus. Recombination was subsequently again suppressed in this introgressed region (“black” stratum of M. v. paradoxa, fig. 2F). The introgression and the independence and timing of the different events of recombination cessation are supported by 1) the nonoverlapping distributions of the estimated times of recombination suppression for the brown and black strata (fig. 1D), 2) the different levels of differentiation between mating-type chromosomes (fig. 2E), and 3) the different tree topologies for the genes in the brown or light-brown strata versus the black stratum (fig. 1E), as explained below. The light-brown stratum may even be constituted itself of different strata or represent a gradual extension of recombination suppression, as its dS values seem to decrease progressively when going away from the mating-type locus (fig. 2E).
The black stratum in M. v. paradoxa indeed displayed a different placement of M. v. paradoxa compared with the species tree: M. v. paradoxa was sister species to the clade encompassing M. coronarie, M. lychnidis-dioicae, and M. violaceum s.s. in the species tree (fig. 1A), while it was placed as a sister species to the M. lagerheimii-M. saponariae clade in the black stratum tree (fig. 1E). This discrepancy strongly supports an introgression event of the black stratum in M. v. paradoxa shortly after speciation, from the ancestor of M. lagerheimii and M. saponariae (fig. 2F). This reinforces the view that mating-type chromosomes in fungi may be particularly prone to introgression, as this process may counteract the effect of degeneration following recombination suppression (Sun et al. 2012; Corcoran et al. 2016; Hartmann et al. 2020). The black stratum in the ancestor of M. v. paradoxa has indeed been introgressed from the ancestor of M. lagerheimii and M. saponariae that had likely not yet stopped recombining in these regions, as their recombination suppression events in this region is younger than their speciation (Carpentier et al. 2019). This introgression from recombining regions has likely temporarily restored recombination in these regions in the M. v. paradoxa lineage, explaining the younger recombination suppression date and the presence of the introgression on both M. v. paradoxa mating-type chromosomes. The introgression despite recombination suppression in the M. v. paradoxa lineage could have occurred via gene conversion and/or because the recombination was not suppressed with the recombining chromosomes of the ancestor of M. lagerheimii and M. saponariae. The brown stratum of M. v. paradoxa also had a different placement than the species tree and from the black stratum (fig. 1E), possibly resulting from an introgression from an unidentified species.
Absolute Dating of Recombination Suppression Events
We estimated the dates when recombination was suppressed for the 22 strata for which we had at least ten genes or 10,000 aligned codons among single-copy genes in nonrecombining regions. As soon as a gene is permanently linked to the mating-type loci, its alleles will independently accumulate substitutions that will remain associated with their linked mating-type allele. We therefore inferred the age of recombination suppression by estimating the divergence time between the alleles associated with the a1 and a2 mating types, using Beast v2.5.0. We used the split of M. lychnidis-dioicae and M. silenes-dioicae at 0.42 Ma as a calibration point (Gladieux et al. 2011). The estimated times ranged from 3.6 to 0.15 My before present for the various independent black strata (supplementary table S3, Supplementary Material online). We estimated divergence times ranging from 3.82 to 0.15 My in M. v. paradoxa strata and in the range of 0.07–0.25 My for the young strata such as the light-blue stratum of M. v. caroliniana and the red stratum of M. lychnidis-dioicae and M. silenes-dioicae (supplementary table S3, Supplementary Material online).
Identification of Optimal Codons
To identify optimal codons in Microbotryum fungi, we investigated which codons were preferentially used in highly expressed autosomal genes in the two distantly related species, M. lychnidis-dioicae, and M. intermedium (fig. 1). Codon usage bias is expected to be strongest for the most highly expressed genes and selection for optimal codon use to be more effective on autosomes because recombination occurs. We had expression data for haploid cells cultivated clonally on nutritive medium (supplementary table S4, Supplementary Material online), for the two mating types separately. To study autosomal codon usage, we performed a within-group correspondence analysis (WCA [Charif et al. 2005]), that is, a multivariate statistical method summarizing codon count data, normalizing the count of each codon by the average count of all the codons encoding for the same amino acid (Suzuki et al. 2008). For the M. intermedium a1 mating type, the first principal component axis summarized 16.55% of the codon usage variation (supplementary fig. S4, Supplementary Material online) and was significantly negatively correlated with the gene expression level (supplementary table S5, Supplementary Material online). Therefore, the genes with the lowest coordinates on the first principal component axis were those most highly expressed, where we expect strongest bias towards optimal codons. We performed χ2 tests to compare the codon counts per amino acid of the genes with the 10% highest coordinates and the 10% lowest coordinates on the first axis. For each amino acid, we inferred the optimal codon to be the one with the highest adjusted standardized residuals (i.e., largest counts compared with expected under the hypothesis of random use of synonymous codons) in highly expressed genes from χ2 tests (table 1). We inferred the same optimal codons when using the autosomes from the a2 mating type of M. intermedium or from either of the two M. lychnidis-dioicae mating types (supplementary table S6, Supplementary Material online). Because M. intermedium and M. lychnidis-dioicae are very distantly related species in our dataset (last common ancestor at ca. 20 My before present, fig. 1A), and share the same optimal codons, we assumed the optimal codons to be the same in all other Microbotryum species. The optimal codons were more GC-rich than the other synonymous codons (table 1).
Optimal codons in Microbotryum.
| Amino Acid | Optimal Codon | Synonymous Codons | ||||
|---|---|---|---|---|---|---|
| Ala | GCC | GCT | GCA | GCG | ||
| Arg | CGC | CGT | CGA | CGG | AGA | AGG |
| Asn | AAC | AAT | ||||
| Asp | GAC | GAT | ||||
| Cys | TGC | TGT | ||||
| Gln | CAG | CAA | ||||
| Glu | GAG | GAA | ||||
| Gly | GGC | GGT | GGA | GGG | ||
| His | CAC | CAT | ||||
| Ile | ATC | ATT | ATA | |||
| Leu | CTC | CTT | CTA | CTG | TTA | TTG |
| Lys | AAG | AAA | ||||
| Phe | TTC | TTT | ||||
| Pro | CCC | CCT | CCA | CCG | ||
| Ser | TCG | TCT | TCC | TCA | AGC | AGT |
| Thr | ACC | ACT | ACA | ACG | ||
| Tyr | TAC | TAT | ||||
| Val | GTC | GTT | GTA | GTG | ||
| Stp | TAA | TGA | TAG | |||
Decrease in Optimal Codon Frequency in nonRecombining Regions
We determined whether each codon was optimal or not. We did this for each haploid genome of the 13 Microbotryum species included in this study, separately for on the autosomes and the different compartments of the mating-type chromosomes, that is, the recombining PARs and distinct evolutionary strata with different ages of recombination suppression. However, several of these evolutionary strata are small and contain few genes, which precludes a reliable estimate of optimal codon usage. We therefore only considered the 22 largest nonrecombining regions (with at least 19 genes; fig. 1). This was to test whether the frequencies of optimal codons differed between genes in these nonrecombining regions and in autosomes. However, because we found that optimal codons were enriched in GC in Microbotryum, a decrease in the frequency of optimal codons in the nonrecombining regions compared with recombining regions could not only be due to a lower efficacy of selection for optimal codon usage but also a reduction in GC-biased gene conversion in nonrecombining regions. It should be possible to distinguish these two effects because GC-biased gene conversion affects both coding and noncoding sequences while lower efficacy of selection on codons should only impact coding sequences (i.e., on exons but not on introns). We therefore introduced the difference in GC content between coding sequences (GCexon) and introns (GCintron) per gene as a covariate in the analyses of optimal codons as an estimation of the relative effects of GC-biased gene conversion versus selection on codon usage. We performed a logistic ANCOVA for each genome to explain the variation in the status of codons (i.e., optimal vs. nonoptimal) by the genomic compartment, by the difference in GC content between coding sequences (GCexon) and introns (GCintron), and by their interactions (see supplementary fig. S5, Supplementary Material online for raw data distribution). These factors allowed us to test 1) whether the optimal codon usage varied significantly among the different genomic compartments, 2) whether the optimal codon usage varied with the difference in GC content between coding sequences and introns (GCexon — GCintron), which estimates the impact of GC-biased gene conversion, and 3) whether the strength or direction of the relationship between optimal codon use and GC-biased gene conversion varied among the different genomic compartments. We wanted to assess whether codons were less often optimal in nonrecombining regions (tested through the genomic compartment effect), and to assess whether this could be adequately explained solely by a lower frequency of GC-biased conversion in nonrecombining regions, which was tested through the interaction between the genomic compartment and the quantitative measure of the effect of GC-biased conversion.
We found few significant differences in optimal codon usage between autosomes and the recombining regions located on mating-type chromosomes (supplementary table S7a, Supplementary Material online). In contrast, across all species and mating types, codons were significantly less often optimal in nonrecombining regions than in autosomes (supplementary table S7a, Supplementary Material online, fig. 3A, supplementary figs. S6 and S7, Supplementary Material online), except for the very recently evolved nonrecombining region of the a2 HD M. lagerheimii mating-type chromosome (supplementary table S7a, Supplementary Material online). Codons were thus less often optimal in older nonrecombining evolutionary strata than in recombining regions. To understand whether this was a signal of degeneration due to the lower efficacy of purifying selection in nonrecombining regions, we needed to ascertain whether the lower frequency of optimal codons could be explained simply by a lower frequency of recombination-mediated gene conversion, gene conversion being typically GC-biased and optimal codons being, on average, more GC-rich than less optimal codons. To test for this, we used the difference in GCexon – GCintron as a covariate. Because low efficacy of selection on codon usage should influence only coding sequences while GC-biased conversion should affect all sequences, large excesses in GCexon compared with GCintron points to the predominant action of selection whereas no difference points to the predominant action of GC-biased gene conversion. Across the genomic landscape of autosomes, genes that showed low difference in GC content between exons and introns were most rich in optimal codons, indicative of stronger influence of GC-biased conversion. As the difference in GC content between exons and introns increased the frequency of optimal codons declined. This was the case for all the genomes (supplementary table S7a, Supplementary Material online; fig. 3B), except the a1 genomes of M. lychnidis-dioicae, M. v. melanantha, and M. violaceum (s.s.) for which the effect was not significant (supplementary table S7a, Supplementary Material online). This suggests that GC-biased gene conversion, in addition to selection for optimal codon usage, increases the frequency of optimal codons in autosomes. Indeed, selection for optimal codons is strong only in highly expressed genes, while GC-biased conversion can act on all genes. This also means that the generally lower frequency of optimal codons in nonrecombining regions could in principle be due to less frequent GC-biased gene conversion in these regions compared with autosomes.
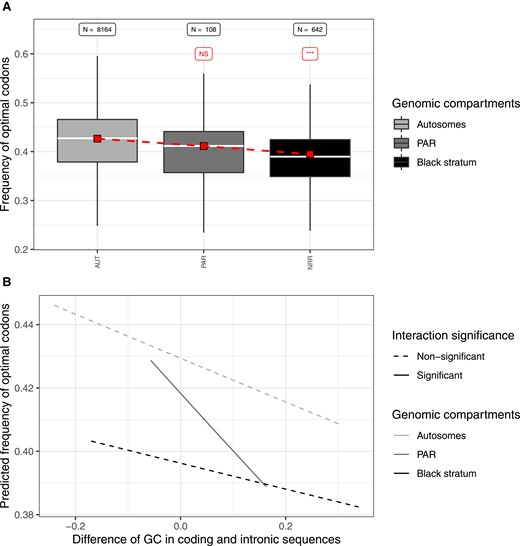
Analysis of the frequency of optimal codons in the a1 genome of Microbotryum silenes-dioicae. (A) Distribution of the frequency of optimal codons across genomic compartments. Boxplot grey shade refers to the genomic compartment. For each genomic compartment, the red square indicates the mean value of the predicted frequency of optimal codons, obtained from the logistic regression explaining the frequency of optimal codons by the genomic compartment, by the difference in GC content between coding (GCexon) and intronic (GCintron) sequences and their interaction. The sample size (N) is labeled on top of the corresponding boxplot, as well as the significance level of the difference between a given genomic compartment and the autosomes in red (NS: nonsignificant; ***P < 0.001) from the logistic regression. (B) Frequency of optimal codons predicted by the logistic regression plotted against the difference in GC content between coding and intronic sequences. From the statistical analysis, significant differences in slope between a genomic compartment and the autosomes are indicated by solid line and filled dots, while nonsignificant interactions are indicated by dotted line and open dots. Similar analyses for all species studied here are presented in supplementary figs. S6 and S7, Supplementary Material online.
However, the relationship between the difference in GCexon and GCintron and optimum codon usage rarely differed between autosomes and nonrecombining regions, most interactions being nonsignificant (supplementary table S7a, Supplementary Material online; fig. 3B). In most genomes, we indeed observed the same slope of optimal codon frequency as a function of the difference in GCexon and GCintron in nonrecombining regions as in autosomes (fig. 3B and supplementary fig. S6, Supplementary Material online). This means that the codons were not only less optimal in nonrecombining regions in the genomic areas where GC-biased conversion had the highest impact (low difference in GCexon and GCintron, left fig. 3B) but also where it had little influence, that is, where only selection acts (high difference in GCexon and GCintron, right fig. 3B). Such similar slopes for autosomes and nonrecombining regions, together with lower overall values of optimal codon frequency in these nonrecombining regions, indicate that selection for optimal codons has a lower efficacy across the genomic landscape in nonrecombining regions and that the GC-biased conversion has similar impact in recombining and nonrecombining regions. We also performed the same statistics using all evolutionary strata, even the shortest ones, and we obtained similar conclusions as when using only the largest ones (supplmentary fig. S8, Supplementary Material online, supplementary table S7b, Supplementary Material online).
Control for Ancestral Gene Expression Level
Selection on codon usage of genes could be weaker in nonrecombining regions if gene expression in these regions had been, by chance, low in these genomic regions even before recombination was suppressed. To investigate whether genomic compartments differed in the average gene expression level before recombination suppression, we inferred the ancestral expression level of each gene from the expression level of its ortholog in M. intermedium, which has no recombination suppression on its mating-type chromosomes except in small regions around the mating-type loci themselves. Of course, some gene-specific expression levels may have changed in M. intermedium since its divergence from the last common ancestor, but, without recombination suppression in this species, there has likely been no major change in gene expression across large genomic regions since the last common ancestor of the studied Microbotryum species. That gene expression level changed little across the Microbotryum genus in recombining regions was supported by highly significant correlations of gene expression levels of shared autosomal genes measured in similar culture conditions between M. intermedium and M. lychnidis-dioicae (supplementary tables S8 and S9, Supplementary Material online).
For each of the two haploid genomes across the 13 species, we compared the mean and variance of the inferred ancestral gene expression level (i.e., the gene expression level in M. intermedium) between the current genomic compartments using a Kruskal–Wallis test and a Levene’s test, respectively. For each species we tested for differences in the inferred ancestral gene expression between the current genomic compartments, that is, autosomes, PARs and the various evolutionary strata that lack recombination. We found no significant difference in mean or variance of the inferred ancestral gene expression level between the current recombining and nonrecombining regions for any genome (supplementary table S10, Supplementary Material online). Therefore, differences in frequencies of optimal codons across the genomic compartments are unlikely to be explained by differences in ancestral gene expression level between genomic compartments.
Tempo of Degeneration in Codon Usage and in Protein-Coding Genes
The multiple independent events of recombination suppression in the Microbotryum genus provides an excellent case study for investigating the tempo of degeneration, allowing analysis of the relationship between degeneration level and time in nonrecombining regions using independent data points. Here, we investigated the tempo of degeneration using the genes present in the regions with independent recombination suppression events between PR and HD loci, as well as the large species-specific strata. We excluded the shared strata common to most species because they do not provide independent data points (purple, blue, and orange strata) and those that contain insufficient numbers of genes to ensure reliable estimates of the time since recombination suppression (e.g., the green strata in M. lychnidis-dioicae). For the black strata shared by multiple species (fig. 1), we took the mean value of variables for species descendent from the same recombination suppression event to avoid pseudoreplication. In total, we thus considered 22 evolutionary strata for these analyses (supplementary table S11, Supplementary Material online).
We tested whether the odds for a codon to be optimal (Noptimal/Nnonoptimal), the nonsynonymous differences between alleles on the two mating-type chromosomes (dN) and the ratio of nonsynonymous versus synonymous substitution rates (dN/dS) for the genes located in the nonrecombining regions covaried with the time since recombination suppression, including species as a cofactor and, for optimal-codon analyses, ancestral gene expression level as a covariable. We tested linear, logarithmic, or quadratic relationships with the time since recombination suppression on the one hand and dN, dN/dS or the odd for a codon to be optimal on the other hand.
The odds for a codon to be optimal was best explained by considering the joint effect of its ancestral expression level, the species and a quadratic effect of the age since recombination suppression (fig. 4a, supplementary table S12, Supplementary Material online). This means that the decrease in the frequency of optimal codons slowed with time, reaching an asymptote at ca. 3 My (fig. 4a). As expected, the odds for a codon to be optimal increased with its ancestral expression level (supplementary fig. S9, Supplementary Material online; supplementary table S12, Supplementary Material online). The asymptote for the frequency of optimal codons seemed at a higher value than expected under random codon usage. There are indeed 18 amino-acids encoded by >1 codon and 59 codons in total discarding the three stop codons and the two single-codon aminoacids; this gives a frequency of optimal codons of 18/59 = 0.30 under random usage while the asymptote is at ca. 0.43 and the lowest frequencies at 0.40 (fig. 4a).
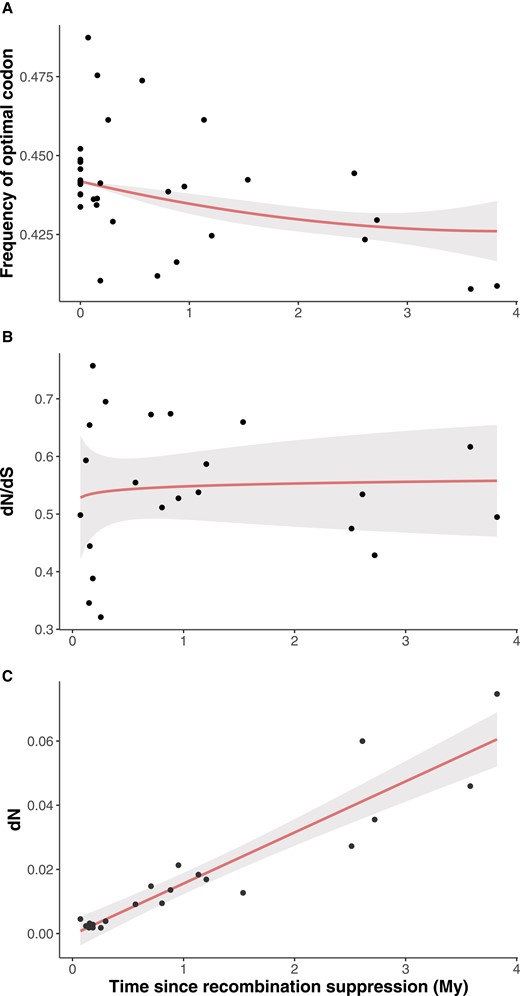
Tempo of degeneration in Microbotryum fungi. (A) Frequency of optimal codons Noptimal/(Noptimal + Nnonoptimal) as a function of time since recombination suppression (in Million years, My). Note that the statistical analyses were performed on the odds of optimal codons (Noptimal/Nnonoptimal) and not the frequency as plotted here. (B) Nonsynonymous over synonymous divergence (dN/dS) between alleles on the two mating-type chromosomes, as a proxy of the strength of purifying selection, as a function of time since recombination suppression (in My). (C) Accumulation of nonsynonymous changes accumulation (dN) between alleles on the two mating-type chromosomes as a function of time since recombination suppression (in My). In all panels, the dots represent the data. Predictions from the models are show as red lines and the 95% confidence intervals of the prediction as grey areas.
The dN/dS ratio rapidly increased following recombination suppression and was best explained by the log of time since recombination suppression (fig. 4b, supplementary table S12, Supplementary Material online). However, the dN/dS ratio very rapidly reached a plateau, actually remaining almost constant at a value around 0.55. This means that purifying selection decreased very rapidly following recombination suppression to a constant level, intermediate between strong purifying selection (dN/dS = 0) and neutral evolution (dN/dS = 1). Accordingly, nonsynonymous differences between mating-type chromosomes (dN) increased linearly with stratum age, at a rate of 0.015 per MY (fig. 4c). In contrast, both dN and dS were near zero in recombining regions between alleles from haploid cultures of opposite mating types deriving from a diploid individual (fig. 5), these fungi being highly homozygous due to high selfing rates.
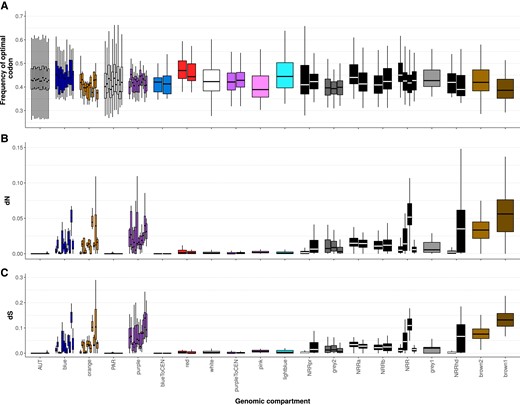
Degeneration in Microbotryum fungi, with values for all genomic compartments and species. Boxplots of frequencies of optimal codons (A) and nonsynonymous differences (dN) between alleles of alternative mating-type chromosomes (B) in all species and all genomic compartments. The X-axis legend correspond to the one in fig. 1C.
For the degeneration tempo analysis, we used one single point per recombination suppression event to avoid pseudoreplication and we excluded the small strata with too few genes to provide reliable age estimates. Plotting the values for all strata and all species (fig. 5 and supplementary fig. S8, Supplementary Material online) showed similar degeneration levels among species in shared strata and thus repeatability of degeneration; this further supports the degeneration tempo analyses above. Figures 4 and 5 also show that the frequencies of optimal codons in recombining regions (autosomes and PAR) were high and relatively homogeneous among species.
Discussion
This study takes advantage of multiple events of recombination suppression on the mating-type chromosomes of closely related fungal species to document the tempo of genomic degeneration in nonrecombining regions (i.e., the pace at which deleterious mutations accumulate over time). We quantified the rate of degeneration by estimating the age of each nonrecombining region, that is, the time since recombination suppression, and by examining how the degree of degeneration estimated using two different measures, that is, nonsynonymous substitution accumulation and the reduction in optimal codon usage, varied with age. Few studies have focused on the degeneration of codon usage. This study further proposes a method for disentangling the effect of less efficient selection from other factors that influence codon usage in nonrecombining regions. Indeed, codon usage is likely to be affected by ancestral gene expression level and GC-biased gene conversion, so studies of the consequences of relaxed selection on codon usage in nonrecombining regions need to control for these two processes. We found that genes in nonrecombining regions had fewer optimal codons than those in recombining regions. Controlling for levels of ancestral gene expression and GC-biased gene conversion allowed us to conclude that this was due to a decrease in selection efficacy in nonrecombining regions. Furthermore, by examining independent nonrecombining regions of varying age, we observed a decrease in the frequency of optimal codon usage that slowed down with time to reach an asymptote. nonsynonymous substitutions, in contrast, accumulated in a nearly linear manner over the last 4 My of suppressed recombination on Microbotryum mating-type chromosomes, in agreement with a steady level of purifying selection, intermediate between neutral evolution and strong selection against nonsynonymous changes (dN/dS = 0.55).
Multiple independent events of recombination suppression involving mating-type loci have been reported in anther-smut fungi (Branco et al. 2017, 2018; Carpentier et al. 2019; Duhamel et al. 2022). By sequencing and analysing the genomes of three additional Microbotryum species, we document three new independent events of mating-type chromosome rearrangements and fusions leading to PR–HD linkage, amounting to a total of eight such independent PR–HD linkage events in our present dataset. Linking mating-type loci is beneficial under selfing (Nieuwenhuis et al. 2013; Branco et al. 2017). The high number of independent events of PR–HD linkage through distinct genomic rearrangements shows the power of natural selection to generate repeated convergent phenotypes by independent pathways. In addition, there have been multiple extension events of the region of recombination suppression, at different times and in a stepwise manner in Microbotryum species. Here, we document additional previously unidentified evolutionary strata. In total, we analyzed 22 genomic regions without recombination, each corresponding to an independent event of recombination suppression, providing the statistical power for a formal comparative study of genomic degeneration. Similar comparative analyses have been previously impossible because of the lack of such multiple independent events of recombination suppression across closely related species. The Microbotryum genus contains more than a hundred species (Lutz et al. 2008; Hood et al. 2010), so there are probably many as yet unexploited resources of genomic diversity that will allow deeper exploration of the effects of suppressed recombination in the vicinity of reproductive compatibility loci on genome evolution and in particular on the tempo of degeneration. The Microbotryum genus thus constitutes a unique model for understanding major evolutionary processes affecting the genomic structure of sexual eukaryotes.
We found that optimal codons were less frequently used in nonrecombining regions compared with autosomes across multiple Microbotryum species. We interpreted this as a feature of degeneration due to reduced efficacy of selection in nonrecombining regions, by controlling for possible confounding factors, that is, lower GC-biased conversion or lower ancestral gene expression in nonrecombining regions. Indeed, because optimal codons in Microbotryum are GC-rich, less GC-biased gene conversion in nonrecombining regions compared with autosomes could lower the frequency of optimal codons in such regions. To test for this alternative explanation, we generated a covariate that estimated the strength of GC-biased gene conversion across genes in the genomes. We found similarly lower frequencies of optimal codons in nonrecombining regions regardless of whether GC-biased conversion was high or low across the genomic landscape, and thus even when only selection acted. Thus, we can conclude that lower efficacy of selection contributes to the decrease in the odds of optimal codons in nonrecombining regions in Microbotryum mating-type chromosomes. To our knowledge, this study constitutes the first attempt to analyze codon usage by controlling for confounding processes in statistical analyses.
We also checked that the differences in codon usage between autosomes and nonrecombining regions were not due to differences in gene expression levels between these regions before the evolution of recombination suppression, as gene expression level affects codon usage (Novoa and Ribas de Pouplana 2012; Zhou et al. 2016). Indeed, if expression levels were ancestrally lower for genes now located in nonrecombining regions, selection on codon usage would have been weaker than in other autosomal regions, and lower frequencies of optimal codons would have been expected, regardless of the effect of recombination suppression. However, we found no difference in the ancestral expression levels between autosomal genes and those in current nonrecombining regions. Altogether, we thus found robust evidence showing that lower efficacy of selection due to recombination suppression resulted in less optimal codon usage in Microbotryum species, as has been suggested in the nonrecombining mating-type chromosome of the fungus N. tetrasperma (Whittle et al. 2011).
It has often been assumed that only weak selection would act on codon usage (Li et al. 2009; Machado et al. 2020), because synonymous substitutions should not greatly impact phenotypes. Contradicting this view, several studies, focusing at the gene level, have shown substantial impacts of synonymous substitutions on phenotypes (Carlini 2004; Lampson et al. 2013; Machado et al. 2020), sometimes leading to strong selection on codon usage (Machado et al. 2020). In Drosophila species, codon usage was shown to be quite stable over long time frames with 11/12 species having the same preferred codons except those coding for serine (Vicario et al. 2007). In the Microbotryum genus, optimal codons were the same in M. intermedium and M. lychnidis-dioicae, two species having their last common ancestor at the basis of the studied Microbotryum clade, ca. 20 My ago. The same optimal codons have therefore been maintained for several million years, suggesting strong and consistent selection. The preferred codons in two distantly related plant species, in different families, S. latifolia and Arabidopsis thaliana, are almost identical, despite their long divergence time (Qiu et al. 2011). Silene latifolia shows no decrease in optimal codon frequencies in nonrecombining regions of the Y-chromosome (Bartolomé and Charlesworth 2006). In Drosophila in contrast, the rate of accumulation of unpreferred synonymous mutations was higher for the neo-Y chromosome than for the neo-X chromosome even for highly expressed genes (Bartolomé and Charlesworth 2006). Codon usage in nonrecombining regions therefore requires more studies before we can draw generalities about its evolution.
Degeneration of protein-coding sequences in nonrecombining regions of sex chromosomes has been much more studied than codon usage and has been consistently found in a variety of organisms, from animals and fungi to plants (e.g., Soojin and Charlesworth 2000; Bergero and Charlesworth 2011; Chibalina and Filatov 2011; Whittle et al. 2011; Bachtrog 2013; Fontanillas et al. 2015). Overall trends were inferred from observations that older evolutionary strata, e.g., on sex chromosomes of papaya and supergenes in butterflies (Wu and Moore 2015; Jay, Chouteau, et al. 2021) had higher nonsynonymous substitution rates than younger strata. However, though theoretical models made predictions about the tempo of gene losses, empirical studies on the tempo of sequence degeneration were lacking (Bachtrog 2008), because data from sufficient numbers of independent recombination suppression events to examine the tempo of nonsynonymous mutation accumulation did not exist.
The existence of multiple independent events of recombination suppression in Microbotryum fungi allowed reliable estimations of the tempo of degeneration in protein-coding sequences. The decrease in the frequency of optimal codons was rapid following recombination suppression and reached an asymptote at ca. 3My. The asymptote seemed above the value of the frequency of optimal codons expected at random, which suggests that selection is still acting. The dN/dS ratio, a proxy for the degree of relaxed selection, very rapidly (within <0.25 My) reached a constant value, remaining around 0.55. The efficacy of purifying selection thus very rapidly decreased after the onset of recombination suppression and then remained steady at the same intermediate value between strong purifying selection (dN/dS = 0) and neutral evolution (dN/dS = 1). Accordingly, nonsynonymous differences (dN) increased linearly with stratum age, at a rate of 0.015 per MY. One could have expected that the strength of purifying selection would increase with time (i.e., dN/dS would decrease with time) if accumulating more nonsynonymous changes would have increasing deleterious effects, that is, if fitness decreased more rapidly than linearly with the number of nonsynonymous substitutions. One could have expected in contrast that the strength of purifying selection would decrease with time (i.e., dN/dS would increase with time), if some gene copies became completely nonfunctional. This may be the case, for example, if selection on their function occurs primarily in the diploid (dikaryotic) stage such that deleterious mutation can remain sheltered under the permanent heterozygosity afforded by recombination suppression. We did not observe such nonlinear effects here, but they may occur at longer time scales following recombination suppression. In addition to revealing the tempo of degeneration, this is the first study to our knowledge that disentangles the effects of reduced selection efficacy and GC-biased gene conversion on the frequency of optimal codons and that investigates the tempo of degeneration using multiple independents events of recombination suppression.
We used synonymous and nonsynonymous substitutions to estimate the time of divergence between sequences, as is typically done. We analyzed how dN, dN/dS and the odds of optimal codons evolved over time since recombination suppression. These different measures depend on substitution rates, with the influence of both mutation and selection, and it is precisely this effect of selection we aimed to analyse. The codon usage and dN should be strongly correlated to the total synonymous divergence only in the absence of purifying selection, which is precisely what we are studying. If selection is very efficient, optimal codon frequencies should not change and dN should remain very low, as is in fact observed on autosomes, in contrast to the nonrecombining regions of the mating-type chromosomes. Note also that the same curve shapes were found as a function of dS alone, in particular dN was very strongly correlated with dS (supplementary fig. S8, Supplementary Material online). We studied here how rapidly deleterious substitutions accumulate over time since recombination suppression, that is, the shape of the curve of accumulation of deleterious mutations with time.
Understanding the tempo of degeneration is important for our knowledge on genomic evolution, on the origin of genetic diseases, and on the maintenance of regions without recombination. For example, it is important to note that the seven youngest evolutionary strata used in this study of degeneration tempo are still collinear between mating types (Branco et al. 2017, 2018; Carpentier et al. 2019) and correspond to low levels of degeneration. In contrast, the evolutionary strata with strong signs of degeneration are also highly rearranged between mating types (Branco et al. 2017, 2018; Carpentier et al. 2019). This implies in particular that the hypothesis postulating that inversions linked to a mating-type locus or a sex-determining region could easily reverse when they accumulate too much load (Lenormand and Roze 2021) likely does not hold, as the region would then have already accumulated further rearrangements, preventing reversion to the original state that would allow recombination. This would in turn support the hypothesis that the extension of recombination suppression could then simply be the result of the selection of recombination cessation for sheltering deleterious alleles (Jay, Tezenas, et al. 2021).
Materials and Methods
Genome Sequencing
We sequenced haploid genomes of opposite mating types for one diploid strain of each of the following species: M. v. tatarinowii parasitizing S. tatarinowii (#1400, GPS 39°59′45.4″ 116°11′37.3″, Xiangshan, Beijing, collected in September 2015), M. v. melanantha parasitizing S. melanantha (#1296; 27°01′50.6″ 100°10′41.6″ First Peak, Lijiang, date collected in July 2014), and M. coronariae parasitizing L. flos cuculi (#1247; GPS 55.7 -4.9, Great Cumbrae Island, UK, collected in 2000). Additionally, we sequenced the a1 genome of M. intermedium parasitizing Salvia pratensis (#1389, GPS 44.3353 N 7.13637 E, Cuneo, Italy, collected in July 2011). Samples were collected before the publication of laws regarding the Nagoya protocol in the countries of collection. DNA extraction and sequencing based on Pacific Bioscience long-read sequencing was performed as described previously (Branco et al. 2017, 2018). Sequencing was carried out at UCSD IGM Genomics Center (San Diego, USA) with the P6 C4 chemistry. Coverage was between 24x and 35x for all genomes, except for M. intermedium for which it was 199x.
Assembly of New Genomes and Assembly Improvement for M. scabiosae Infecting Knautia arvensis
We converted the bax.h5 files from each smart cell into one bam file using bax2bam with the “–subread” option (https://github.com/PacificBiosciences/bax2bam), and all bam files from the same sequencing genome into one fastq file using bam2fastx (https://github.com/PacificBiosciences/bam2fastx). We generated the assembly using canu (Koren et al. 2017) with the parameters “genomeSize = 30 m” and “-pacbio-raw”. We used pbalign (version 0.3.0) with the blasr algorithm (Chaisson and Tesler 2012) to realign the raw reads onto the assembly (indexed with samtools faidx (Li et al. 2009) and then used the output bam file into quiver (Chin et al. 2013) to polish the assembly basecalling (https://github.com/PacificBiosciences/GenomicConsensus). Default parameters were used when not detailed in the text (see the supplementary table S1, Supplementary Material online for further assembly statistics).
The previous genome assemblies of the a1 and a2 genome of M. scabiosae were based on five PacBio movies (Branco et al. 2018). We re-assembled the genome using three additional movies, from the same strain, and generated using the same PacBio technology for a total coverage of 506x for the a1 genome and 803x for the a2 genome. The assemblies were substantially improved, as the contig numbers were reduced from 123 and 147 to 26 and 20 for the a1 and a2 mating type, respectively (see the supplementary table S2, Supplementary Material online for further assembly statistics).
Gene Models, Orthologous Group Reconstruction, Transposable Elements, Centromeres
As for the previously published Microbotryum genomes (Badouin et al. 2015; Branco et al. 2017, 2018), the protein-coding gene models were predicted with EuGene (version 4.2a; Foissac et al. 2008), trained for Microbotryum. Similarities to the fungal subset of the uniprot database (The UniProt Consortium 2011) plus the M. lychnidis-dioicae Lamole proteome (Badouin et al. 2015) were integrated into EuGene for the prediction of gene models. We obtained the orthologous groups based on all-vs-all blastp high scoring pairs parsed with orthAgogue-u option (Ekseth et al. 2014) and clustered with mcl (Dongen 2000) setting to 1.5 the inflation parameter. Transposable elements were obtained from a previous study (Hartmann et al. 2018). Centromeres were identified as regions with the highest density of the centromeric repeats described in M. lychnidis-dioicae (Badouin et al. 2015). In the most fragmented assemblies (e.g., M. coronariae), the centromeres on the mating-type chromosomes could not be localized, but the centromere localization was only used in the M. lagerheimii assembly to assess whether chromosome fissions occurred at centromeres.
Evolutionary Scenarios of the Mating-Type Chromosomes
For the supplementary figs. S1–S3, Supplementary Material online, we represented genomic data using Circos (Krzywinski 2009) with the following tracks: 1) contig, 2) dS = 0 (indicating recombination in these selfing species as selfing leads to homozygosity), 3) all genes, and 4) transposable elements, centromeric repeats. Both the dS = 0 and all gene tracks were filtered for TEs and centromeric repeats, using their merged coordinates with bedtools (Quinlan and Hall 2010). Homozygosity (dS = 0) was used to infer recombining regions on mating-type chromosomes following previous studies (Branco et al. 2017, 2018). The comparisons of mating-type chromosomes of the species with linked HD and PR loci to the ancestral state with HD and PR loci on different chromosomes (using the M. intermedium genome as a proxy for the ancestral state) allowed us to infer the chromosomal rearrangements having linked HD and PR loci, as previously done (Branco et al. 2017, 2018). Nonrecombining regions were identified as genomic regions with nonzero levels of differentiation between mating-type chromosomes as previously done (Branco et al. 2017, 2018).
RNAseq Experiment and Expression Level Quantification.
We generated RNAseq data for M. intermedium under two different conditions: 1) haploid cells of a single mating type grown on rich medium and then mixed in equal proportions of the two mating types before RNA extraction (“H” condition) and 2) mixtures of cells of the two mating types under mating conditions (“M” condition). Total RNA was isolated from haploid cells using the Qiagen RNeasy Mini Kit. For the rich medium condition, haploid strains (a1 or a2) were streaked on Potato Dextrose Agar (PDA) and grown for 48 h at 22 °C. Cells were scraped, ground in liquid nitrogen, and total RNA extracted following the manufacturer’s protocol. For RNAseq analysis, equal amounts of total RNA individually isolated from a1 and a2 cultures were pooled. For the mating condition, haploid a1 and a2 cultures were first grown separately in yeast extract peptone dextrose broth overnight. Cell density was measured with a spectrophotometer. The concentration of each culture was adjusted to O.D.600 1.0. Equal volumes of the two haploid cultures were mixed and plated on water agar. These plates were incubated for 4 days at 14 °C, after which wet mounts were prepared from each mated plate to verify the presence of conjugation tubes, indicating active mating behavior. Cells were scraped. Total RNA was isolated from haploid cells using the Qiagen RNeasy Mini Kit. After total RNA isolation, several quality control measures were taken. Concentration and purity were assessed using a NanoDrop 2000 spectrophotometer (Thermo Scientific); 260/280 and 260/230 ratios >1.8 were considered satisfactory for RNAseq application. Additionally, cDNA was prepared and used as template for intron-spanning primers in PCR reactions to verify the lack of genomic DNA contamination. Bioanalyzer analysis was completed to detect intact 18S and 23S RNA as a measure of overall RNA quality. After passing all quality control measurements, RNA was sent for RNAseq analysis to CD Genomics (Shirley, NY, USA). Three replicates were sequenced per condition and means across the three replicates were analyzed.
For M. lychnidis-dioicae, we used RNAseq data published previously (Perlin et al. 2015), using only the expression data from the two conditions that corresponded to those analyzed in M. intermedium, that is, culture on PDA medium and under mating conditions. List and statistics of the RNAseq experiments used in this study are provided in supplementary table S4, Supplementary Material online. We controlled the quality of the RNAseq experiment data using fastQC (https://github.com/s-andrews/FastQC). We trimmed the sequences using trimmomatic (Bolger et al. 2014); parameters: ILLUMINACLIP:TruSeq3-PE.fa:2:30:10:2:keepBothReads LEADING:3 TRAILING:3 MINLEN:36). We only considered the resulting trimmed paired-end reads for further analysis (supplementary table S3, Supplementary Material online). For each RNAseq dataset, we pseudoaligned the reads onto the corresponding references and quantified the gene expression levels using Kallisto using the “kallisto quant” command with the “–bias” option (Bray et al. 2016). For the diploid RNAseq experiment (supplementary table S4, Supplementary Material online), we used the concatenated coding sequence set from a1 and a2 haploid genomes as reference. For haploid RNAseq experiment, we considered the haploid coding sequence set from the corresponding mating type. For each RNAseq experiment, we removed all the genes with an expression level above the 95th percentile of the expression level distribution to avoid spurious high expression level.
We tested for change in expression level for genes in recombining regions between two distant-related Microbotryum species. We performed Pearson’s correlation tests between M. intermedium and M. lychnidis-dioicae orthologous genes for the two of RNA-seq experimental replicates that were similar between the two species (i.e., cells grown on rich media or mated on water agar (Perlin et al. 2015); supplementary table S8, Supplementary Material online).
Identifying Optimal Codons in Microbotryum Fungi
We generated a codon usage table for each of the a1M. lychnidis-dioicae, a2M. lychnidis-dioicae, a1M. intermedium and a2M. intermedium haploid genomes (scripts available in the public repository) and filtered the genes that overlapped transposable elements that had been previously identified (Hartmann et al. 2018). We then performed a WCA, following the procedure available at http://pbil.univ-lyon1.fr/datasets/charif04/(Charif et al. 2005) on each codon usage table. Correspondence analysis is a multivariate statistical method that summarizes codon count data by reducing them to a limited number of variables. WCA more specifically dissociates the effects of different amino-acid compositions from the effects directly related to synonymous codon usage (Charif et al. 2005). This method adjusts the value for each codon by the average value of all the codons encoding for the same amino acid. We only considered the two first principal components which explained between 16.30% and 16.50% of the variance for the first principal component and between 7.75% and 8.51% for the second principal component (supplementary fig. S4, Supplementary Material online). The coordinates of the genes projected onto the first (PC1) and second (PC2) axes were significantly correlated with gene expression level (Pearson’s correlation tests; supplementary table S5, Supplementary Material online). We considered the first axis to better characterized the gene expression level variation because the correlations between PC1 gene coordinates and gene expression level were higher than those calculated between PC2 gene coordinates and gene expression level (see correlation’s coefficients in supplementary table S5, Supplementary Material online).
We performed χ2 tests to compare, per amino acid, the codon counts of the 10% of genes having the lowest PC1 coordinates to the codon counts of the 10% of genes having the highest PC1 coordinates, representing the genes with highest and lowest expression, respectively (supplementary fig. S3, Supplementary Material online). When the χ2 test was significant (P < 0.05), we considered for each amino acid the optimal codon to be the one with the highest residual from the χ2 test (supplementary table S6, Supplementary Material online). We did not consider the ATG (methionine) and TGG (tryptophan) codons as they have no synonymous codons.
Frequency of Optimal Codons and GC Content Statistics
For each coding sequence (i.e., exons) with base pair numbers corresponding to multiple of three, we calculated the frequency of optimal codons, the GC content of the third position (GC3) of each codon and the GC content of the introns of each gene (GCintrons). We removed from this gene set any gene overlapping with a transposable element.
NonSynonymous and Synonymous Divergence Estimation
For each pair of allele from alternative mating type in each species, we aligned the protein sequences with muscle v3.8.31 (Edgar 2004) and obtained the codon-based CDS alignments with TranslatorX; dN and dS values were computed in the yn00 program for each gene in each species (Yang and Nielsen 2000). To estimate dN/dS values per stratum, we summed the dN and dS values of all genes within each stratum, weighted by gene size, and computed the ratio of these sums.
Absolute Dating of Recombination Suppression Events
We estimated the species and genome compartment divergence times under a calibrated Yule model and a HKY substitution model (kappa = 2, estimated frequencies) with 10,000,000 or 20,000,000 mcmc generations in beast v2.5.0 (Bouckaert et al. 2019). We used three unlinked site models (one per codon position). Clock model and tree parameters were kept linked. We used the split of M. lychnidis-dioicae and M. silenes-dioicae as a calibration point, with a normal prior with a mean 0.42 Ma and sigma 0.04 (Gladieux et al. 2011). Beast input files are available upon request. Concatenated alignments were obtained from codon-based alignments produced by macse v2.03 -prog alignSequences (Ranwez et al. 2018) protocol on fully conserved single copy genes. We reconstructed the species and genome compartment maximum likelihood trees with IQTree v2.0.4 (1,000 rapid bootstraps and automatic model selection [Minh et al. 2020]).
For the species divergence we used 3,955 fully conserved single copy autosomal genes (2,732,071 aligned codons). For estimating the dates of recombination suppression, we estimated the divergence time at the genes linked to mating-type loci between alleles associated with a1 and a2. mating types in ML trees. We used genes ancestrally located on the long arm of the HD chromosome (corresponding to the white stratum, with 179 genes and 129,122 aligned codons, and the light-brown stratum, with 92 genes and 78,627 aligned codons), the region between the HD loci and the centromere (8 genes and 23,115 aligned codons), the region between the HD loci and the short arm telomere (12 genes and 9,165 aligned codons), the short arm of PR chromosome (11 genes and 11,865 aligned codons), the region between the PR loci and the centromere (23 genes and 19,944 aligned codons) and the region extending from the PR locus towards the long arm telomere (shared gene set between the PR associated nonrecombining region of M. silenes-acaulis and the red, light-blue and pink strata, with 14 genes and 9,952 aligned codons).
Statistics
We tested, for each of the 26 Microbotryum genomes (one genome per mating type for 13 species), whether optimal codons were less common in the genes in distinct genomic compartments (PARs and the different evolutionary strata with different ages of recombination suppression) than in autosomal genes. To control for an effect of GC-biased gene conversion on differences in GC level among genome compartments, we used the difference in GC content between coding and intron sequences across genes as a covariate in an ANCOVA that considered the status of codons (optimal vs. nonoptimal) as the response variable, genomic compartment as classification variable and the difference in GC content between coding and intron sequences across genes as the covariate. The interaction effect tested for difference in slopes of the relationship between codon usage and the covariate among genome compartments. Using the glm function in R, we gave as input the frequency of optimal codons weighted by the total number of codons per gene (using the “weight” option in the glm function). After performing a logistic regression assuming binomial distribution and a logit link, we noticed that predicted frequencies of optimal codons were all lower than the raw frequency of optimal codons which could indicate overdispersion issues. We therefore performed the logistic regression assuming a quasibinomial distribution, the only difference being in the estimation of the dispersion parameter to correct, among other things, the P-values. The estimated dispersion parameter was high for the logistic regression model of each genome (Ф > 2), so we choose the quasibinomial distribution to interpret the data. Choosing a quasibinomial distribution did not, however, change the log(odds) estimated by the model.
To assess how the frequency of optimal codons, the ratio of nonsynonymous over synonymous mutations (dN/dS) and the number of nonsynonymous mutations (dN) varied over time since recombination suppression in nonrecombining regions, we performed regressions using R. We used species as blocks and, for the optimal codon analysis, ancestral gene expression level as a covariable. We compared linear, logarithmic or quadratic regressions based on Akaike information criterion. For dN/dS and dN analyses, we analyzed only nonrecombining regions, that is, we did not include autosomes or PARs, as nearly no synonymous or nonsynonymous mutations were observed in these genomic compartments, the species being highly homozygous. Because the status for a codon as optimal or not is a binomial variable, we performed logistic regressions for this trait using generalized linear models.
To visualize the variation in the frequency of optimal codons or dN/dS for all strata, including those for which we had no solid age estimates because of their small sizes, we plotted the values as boxplots and as a function of dS.
Supplementary Material
Supplementary data are available at Molecular Biology and Evolution online.
Acknowledgments
We thank Hui Tang and Janis Antonovics for their help with sample collection. We thank Maxime Dubart and Sylvain Billiard for great help and discussion about statistical analyses. This work was supported by the National Institute of Health (NIH) grant number R15GM119092 to M.E.H., and the Louis D. Foundation award and EvolSexChrom ERC advanced grant number 832352 to T.G. We thank Hector Mendoza for help with RNA isolation. We thank Kurt Hasselman, John Bain, and Hui Tang who collected the strains (involving a confrontation with a grizzly bear for John Bain). Support for R.M.W. and RNA isolation was additionally from NIH (sub-award #OGMB131493D1) to M.H.P. from (P20GM103436) to (Nigel Cooper, PI) and also NSF/IRES Award (1824851) to M.H.P. The contents of this work are solely the responsibility of the authors and do not represent the official views of the NIH. None of the authors have any competing interests.
Author Contributions
T.G., M.E.H., and F.C. conceptualized and designed the study; F.C., R.C.R.d.l.V., P.J., and M.D. performed formal analyses; F.C., T.G., M.E.H., R.C.R.d.l.V., and J.A.S. interpreted the study; M.H.P., R.M.W., F.C., T.G., and R.C.R.d.l.V. were involved in data acquisition; F.C. and T.G. wrote the original draft; F.C., T.G., M.E.H., R.C.R.d.l.V., J.A.S., and P.J. wrote the final draft; F.C., T.G., R.C.R.d.l.V., M.E.H., M.H.P., and R.M.W. revised the study. All authors read and approved the final version.
Data Availability
The datasets supporting the conclusions of this article are available under the BioProjects https://www.ncbi.nlm.nih.gov/bioproject/PRJNA744716 and https://www.ncbi.nlm.nih.gov/bioproject/PRJNA747176 and in the public repository.
References
Author notes
These authors co-supervised the study.
