


Abstract
Evolutionary radiation is a widely recognized mode of species diversification, but its underlying mechanisms have not been unambiguously resolved for species-rich cosmopolitan plant genera. In particular, it remains largely unknown how biological and environmental factors have jointly driven its occurrence in specific regions. Here, we use Rhododendron, the largest genus of woody plants in the Northern Hemisphere, to investigate how geographic and climatic factors, as well as functional traits, worked together to trigger plant evolutionary radiations and shape the global patterns of species richness based on a solid species phylogeny. Using 3,437 orthologous nuclear genes, we reconstructed the first highly supported and dated backbone phylogeny of Rhododendron comprising 200 species that represent all subgenera, sections, and nearly all multispecies subsections, and found that most extant species originated by evolutionary radiations when the genus migrated southward from circumboreal areas to tropical/subtropical mountains, showing rapid increases of both net diversification rate and evolutionary rate of environmental factors in the Miocene. We also found that the geographically uneven diversification of Rhododendron led to a much higher diversity in Asia than in other continents, which was mainly driven by two environmental variables, that is, elevation range and annual precipitation, and were further strengthened by the adaptation of leaf functional traits. Our study provides a good example of integrating phylogenomic and ecological analyses in deciphering the mechanisms of plant evolutionary radiations, and sheds new light on how the intensification of the Asian monsoon has driven evolutionary radiations in large plant genera of the Himalaya-Hengduan Mountains.
Introduction
The interest of biologists on evolutionary radiation can be traced to Darwin’s “abominable mystery,” and in recent years the mechanisms underlying adaptive radiation have been extensively studied in some animal groups such as cichlid fishes (Ronco et al. 2021), lizards (Garcia-Porta et al. 2019), and Darwin’s finches and Hawaiian honeycreepers (Navalon et al. 2020). In contrast, fewer studies have unambiguously revealed the mechanisms of plant evolutionary radiations, and most of them focused on alpine plants such as Lupinus (Drummond et al. 2012; Nevado et al. 2016, 2018) or island plants such as Darwin’s Giant Daisies (Fernandez-Mazuecos et al. 2020), although, in the Cenozoic, evolutionary radiation occurred in all main clades of land plants, including bryophytes (Medina et al. 2018), ferns (Testo and Sundue 2016), gymnosperms (Nagalingum et al. 2011), and angiosperms (Givnish et al. 2009, 2014; Drew and Sytsma 2013; Hackel et al. 2018; Nevado et al. 2019; Soltis et al. 2019). Moreover, solid phylogenetic and biogeographic analyses are fundamental to identify specific types of evolutionary radiations and their driving factors (Simoes et al. 2016). Unfortunately, published phylogenies of most species-rich cosmopolitan plant genera that experienced recent evolutionary radiations show a low resolution of interspecific relationships with a wide occurrence of polytomy (Nagalingum et al. 2011; Moonlight et al. 2015; Shrestha, Wang, et al. 2018; Azani et al. 2019; Renner et al. 2020), and cannot be used for accurate divergence time estimation and biogeographical inference.
Most plant evolutionary radiations were documented from biodiversity hotspots and inferred to be driven by both biological (intrinsic) and environmental (extrinsic) factors (Givnish et al. 2014; Bouchenak-Khelladi et al. 2015; Hughes and Atchison 2015; Hughes et al. 2015; Simoes et al. 2016; Soltis et al. 2019). However, for a specific plant group such as a species-rich cosmopolitan genus, why did evolutionary radiation occur in specific regions? Generally, plant groups with wide geographic distributions, particularly in mountainous regions, require more adaptive strategies for high environmental heterogeneity and diverse selective pressures. Species may adapt to different environments through the evolution of suitable functional traits (Ackerly 2004; Losos 2011; Kostikova et al. 2014; Zanne et al. 2014), for instance, some traits of leaf economics spectrum are good indicators for plant adaptive strategies (Wright et al. 2004; Diaz et al. 2016). Previous studies also found that adaptive evolution was common in rapid evolutionary radiations of angiosperm groups (Nevado et al. 2019), but it remains largely unknown how geographic and climatic factors, as well as functional traits, work together to trigger plant evolutionary radiations.
Rhododendron (Ericaceae) provides an ideal system to investigate the mechanisms underlying evolutionary radiations of subalpine woody plants and to explore the interactions of evolutionary, geographic, and ecological forces in shaping global patterns of species richness of large cosmopolitan plant genera. As the largest genus of woody plants in the Northern Hemisphere and an important component of montane ecosystems, Rhododendron comprises eight subgenera, 15 sections, 71 subsections, and more than 1,000 species (Chamberlain et al. 1996). This genus was widely distributed in circumboreal areas based on the fossil record from the Eocene to Miocene sediments (Collinson and Crane 1978; Denk et al. 2005; Hofmann 2018). However, currently it demonstrates the highest species diversity in the Himalaya-Hengduan Mountains and Southeast Asia (Chamberlain et al. 1996), which originated from evolutionary radiations (Goetsch et al. 2011; Schwery et al. 2015; Xing and Ree 2017; Ding et al. 2020). Rhododendron is also a symbol of the Sino-Himalayan flora, or called the “Rhododendron Flora,” whose evolution has been driven by the intensification of the Asian monsoon (Chen et al. 2018). This genus includes both deciduous (∼10%) and evergreen (∼90%) species, which show diverse life-forms, including small creepers of several centimeters high, shrubs, trees up to 30 meters high, and some epiphytes. An overwhelming majority of the evergreen species grow in habitats with high precipitation, and no species occur in extremely arid regions such as Xinjiang, Northwest China, and Africa except the south edge of the Mediterranean. Notably, Rhododendron can adapt to low-nutrient habitats because of the unique ericoid mycorrhizal fungi (Pearson and Read 1973; Perotto and Bonfante 1998) and (or) tough evergreen leaves. In particular, leaves of Rhododendron are highly diverse in size and texture, showing that some leaf functional traits could have adapted to different habitats and altitudes (Schwery et al. 2015). Based on the above information, we hypothesize that the evolutionary radiations in Rhododendron were jointly driven by the topographical heterogeneity caused by mountain building and the great increase in precipitation associated with the intensification of the Asian monsoon, and were further strengthened by the adaptation of leaf functional traits.
A robust species phylogeny is essential to understand the spatiotemporal evolution of a plant group, but phylogenetic relationships of most subgenera, sections, subsections, and species of Rhododendron remain unresolved due to the use of a few DNA markers (Goetsch et al. 2005; Yan et al. 2015; Xing and Ree 2017; Shrestha, Wang, et al. 2018; Ding et al. 2020). To test our hypothesis of evolutionary radiations in Rhododendron, we conducted a phylotranscriptomic analysis to reconstruct a highly resolved and dated species tree for Rhododendron, and then employed model-based biogeographical and diversification rate analyses to interpret its spatiotemporal diversification. We further explored which environmental variables and leaf functional traits had shaped the global patterns of species diversity of this genus. This study also sheds new light on how the development of the Asian monsoon has driven the evolution of species-rich plant genera in the Himalaya-Hengduan Mountains.
Results
Transcriptome/Chloroplast Genome Data Processing and Statistics
We obtained 248 transcriptomes from 202 species of Rhododendron, which represent all eight subgenera (Azaleastrum, Candidastrum, Hymenanthes, Mumeazalea, Pentanthera, Rhododendron, Therorhodion, and Tsutsusi) and 15 sections, and nearly all multispecies subsections (Chamberlain et al. 1996), and two transcriptomes from the two outgroups (supplementary table S1, Supplementary Material online). After careful screening and testing the monophyly of the studied species (supplementary fig. S1, Supplementary Material online), 3,437 orthologous genes (OGs) were obtained for the final analysis. In addition, 38 chloroplast genes with high-quality sequences were obtained from the transcriptome data for 189 species.
Reconstructed Phylogeny of Rhododendron
The concatenated alignments of the 3,437 OGs (nuclear genes) and 38 chloroplast genes used in phylogenetic analyses include 3,903,298 bp for 202 species (200 Rhododendron species and two outgroups. Rhododendron nipponicum and R. viscidum were excluded due to the low quality of its transcriptome sequences) and 31,572 bp for 189 species, respectively. Both concatenated and coalescent trees generated from the nuclear genes are highly resolved and strongly supported (UFBoot=100% and local posterior probability [LPP]=100% for most nodes) with almost consistent topologies, but a few nodes of the coalescent tree have relatively lower support (fig. 1 and supplementary fig. S2, Supplementary Material online). The tree generated from the concatenated chloroplast genes shows consistent topologies as the nuclear gene tree at the section level, but has much lower resolution for interspecific relationships (supplementary fig. S3, Supplementary Material online). Our results support the division of Rhododendron into five subgenera (Therorhodion, Tsutsusi, Rhododendron, Pentanthera, and Hymenanthes) and 11 sections (Therorhodion, Sciadorhodion, Choniastrum, Azaleastrum, Brachycalyx, Tsutsusi, Ledum, Schistanthe, Rhododendron, Pentanthera, and Ponticum) (fig. 1).
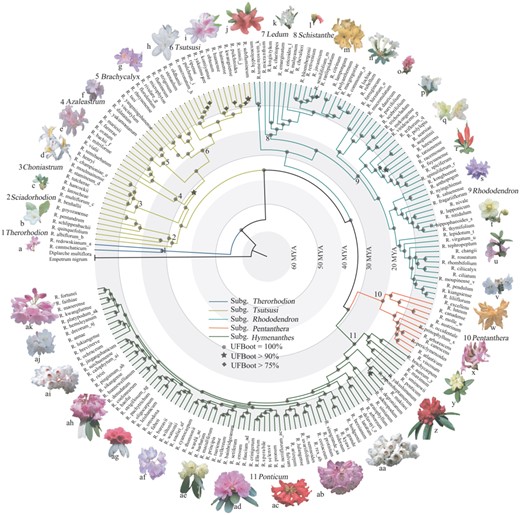
Phylogenetic relationships and divergence time estimates of Rhododendron based on the concatenated alignment of CDS sequences of 3,437 OGs. The 11 sections are noted above the branches and around the tree by numbers 1–11. Flower photographs are not to scale. The lowercase letters (a-ak) following the species names correspond to the photographs of these species around the tree. Geological time scales are shown as light-gray/white concentric rings.
The transcriptome-based phylogeny also shows a very high resolution at the species level, even for the taxonomically difficult subgenus Hymenanthes (fig. 1), which includes more than 300 extant species. In subg. Hymenanthes, species at the basal positions are from the higher latitudes of Eurasia and North America, including R. brachycarpum, R. aureum, R. maximum, R. smirnowii, R. ponticum, R. yakushimanum, R. japonoheptamerum, R. makinoi, and R. degronianum. Within subg. Pentanthera mainly distributed in North America, R. molle from North-East Asia is sister to R. austrinum from southeastern North America. In subg. Rhododendron, R. hypoleucum, and R. tomentosum from circumboreal regions diverged first, and formed a clade sister to the other clade composed of two lineages, one comprising species of section Schistanthe mainly from the Malay Archipelago, and the other belonging to section Rhododendron that comprises the Asian species as well as R. ferrugineum and R. hirsutum from Europe. In section Sciadorhodion, R. albiflorum from Western North America is sister to species from North-East Asia. In particular, in section Schistanthe mainly distributed in the Malay Archipelago, the eastern and southern Asian species (R. micranthum, R. charitopes, R. longistylum, and R. emarginatum) representing the northernmost distribution of the section branched off first, followed by R. ericoides endemic to Malaysia, characterized by linear leaves. Moreover, the robust phylogeny of Rhododendron has anchored phylogenetic positions of some species with unique morphological characters, such as R. pentandrum (basionym: Menziesia pentandra), R. goyozanense (basionym: Menziesia goyozanensis), R. benhallii (basionym: Menziesia ciliicalyx), and R. semibarbatum.
Divergence Time Estimates and Biogeographical Analyses
We tried two approaches (RelTime and MCMCTree) in divergence time estimation, but only a reduced data set was used for MCMCTree due to the limited computation power. The results showed that the time estimates from the two approaches are very close (supplementary figs. S4 and S5, Supplementary Material online), and thus estimates from the RelTime approach based on a complete data set were used in subsequent analyses. The genus Rhododendron likely originated in the Paleocene at ∼64 Ma, with subg. Therorhodion as the earliest diverging lineage (∼56 Ma), followed by subg. Tsutsusi, which diverged from the remaining subgenera at roughly 35.9 Ma during the late Eocene (supplementary fig. S4, Supplementary Material online). The two subgenera Hymenanthes and Pentanthera diverged from each other in the early Oligocene (∼31.0 Ma). Major diversifications occurred in four sections (Tsutsusi, Schistanthe, Rhododendron, and Ponticum) during the Miocene, particularly in the middle to late Miocene.
The Akaike information criterion (AIC) model selection supported the dispersal–extinction–cladogenesis (DEC) model (LnL=−192.25, AIC=388.50), and the DEC+J model showed higher log-likelihood (LnL) values and lower AIC values (LnL=−186.09, AIC=378.18) (supplementary table S2, Supplementary Material online). The DEC model was finally selected, considering that the “+J” model remains controversial, and that the two models provided similar results in ancestral area reconstruction. The ancestral range estimates indicated that Rhododendron very likely originated in North-East Asia, subsequently expanded into Europe and North America, and finally into South Asia and the Malay Archipelago (fig. 2 and supplementary fig. S6, Supplementary Material online). The biogeographic stochastic mapping (BSM) suggested that most biogeographical events can be explained by within-area speciation (82.64%) and dispersals (15.05%), and only a few events involved vicariance (2.31%) (supplementary table S3, Supplementary Material online). Among the dispersal events, anagenetic events (i.e., range expansions) were more common (9.73%) than jump dispersal to a new area (i.e., founder events) (5.32%), and many dispersals occurred between North-East Asia and South Asia. Most of the inferred vicariance events also occurred between South Asia and North-East Asia.
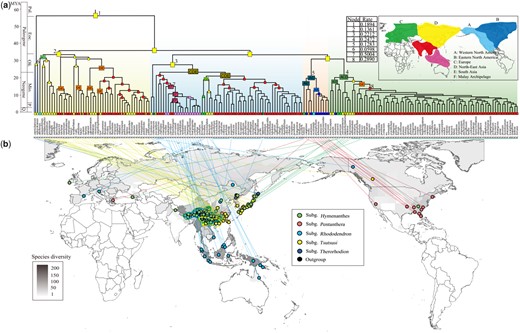
Ancestral range estimates of Rhododendron. (a) Divergence times estimated using RelTime based on the concatenated CDS sequences of 3,437 OGs, and the ancestral areas reconstructed by BioGeoBEARS using the DEC model. The probabilities for the ancestral ranges are illustrated in rectangles color-coded by geographical regions on the world map. Diversification rates are noted on the tree with numbers corresponding to those in the table above the phylogeny. Pal., Paleocene; Eoc., Eocene; Oli., Oligocene; Mio., Miocene; P., Pliocene; Q., Quaternary. (b) Sample collection sites. The coordinates of the collection sites of 202 species are mapped to the world map of Rhododendron species diversity, which was constructed by the recorded species distributions at the administrative unit level. The colored solid circles in front of the names of subgenera correspond to the colored background on the chronogram.
Diversification Analyses
The Bayesian analysis of macroevolutionary mixtures (BAMM) revealed great fluctuations in the net diversification rate, which increased rapidly in the Eocene, decreased considerably in the early Oligocene, and then rose gradually during the middle Oligocene to the middle Miocene, followed by a quick increase in the late Miocene (fig. 3a). Three major shifts of the net diversification rate were found in the genus Rhododendron (excluding the subgenus Therorhodion), the section Schistanthe mainly distributed in the Malay Archipelago, and the section Ponticum nearly all confined to the Himalaya-Hengduan Mountains, respectively (fig. 3b). Based on the BAMM analysis, the diversification rate was much higher in six nodes (1, the crown group of Rhododendron; 2–4, the three subgenera Tsutsusi, Rhododendron, and Hymenanthes; 7, section Schistanthe in Southeast Asia; 8, sect. Ponticum in South Asia) than in the other two nodes corresponding to the two species-poor subgenera Pentanthera (5) and Therorhodion (6) (fig. 2a). The evolutionary rate of environmental factors increased greatly, whereas the rate of leaf functional traits decreased slowly with several small fluctuations after the early Miocene (fig. 3a). Notably, the evolutionary rate of leaf functional traits had a major shift in section Ponticum (supplementary fig. S7, Supplementary Material online).
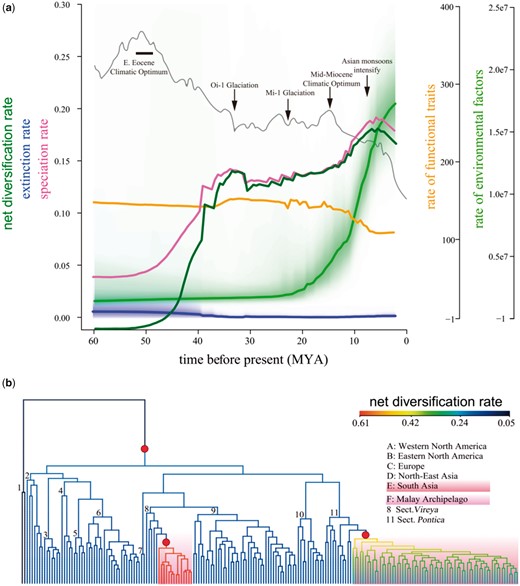
(a) Median rates of net diversification, extinction and speciation, and macroevolutionary rates of environmental factors and leaf functional traits. The unit of diversification is speciation events per million years; the rates of leaf functional traits are unitless. Global surface temperature changes (Zachos et al. 2001) are denoted by the dark gray curve, with several major geologic and climatic events (Hansen et al. 2013) noted by black arrows or box. Pal., Paleocene; Eoc., Eocene; Oli., Oligocene; Mio., Miocene; P., Pliocene; Q., Quaternary. (b) Phylogenetic distribution of net diversification rate shifts on the ultrametric tree from RelTime. The net diversification rates are shown on branches with colors from low (blue) to high (red) values. Red solid circles indicate diversification rate shifts. The 11 sections are noted by numbers 1–11 on branches and refer to figure 1.
The assessment of evolutionary rates by method-of-moments (MS) estimators and б2 trait rates found similar patterns (supplementary fig. S8, Supplementary Material online) as revealed by the BAMM analysis. The MS estimators rely on the ages and species numbers of the clades, and thus may be greatly affected by unequal sampling. In contrast, the BAMM analysis considers the effect of unequal sampling. Therefore, we assessed that BAMM yielded more accurate estimates of diversification rates in Rhododendron, which were used in the discussion.
In the RPANDA analysis, we fitted nine models of time and temperature dependence to investigate the relationship between net diversification rate and global paleo-temperature. The best model for evolutionary rate analyses in Rhododendron was determined as the birth–death model, in which speciation rate is linearly correlated with time (AICc=1,229) (supplementary table S4, Supplementary Material online). Our analyses showed that the genus evolved under higher speciation rates after the middle Eocene and large-scale extinction occurred in the early Eocene. The net diversification rate increased with rising global paleo-temperature when the climate was relatively cool, but decreased when the climate turned warmer (>10 °C) (supplementary fig. S9, Supplementary Material online).
Phylogenetic Signal and Divergence of Leaf Functional Traits
By analyzing the variation of seven traits critical to the growth of the studied Rhododendron species, we found that three traits, leaf N, leaf P, and specific leaf area (SLA), were strongly related (supplementary fig. S10a, Supplementary Material online), and had strong phylogenetic signals based on Pagel’s λ (λ > 0.50 and P < 0.05 for λ = 0) (supplementary table S5, Supplementary Material online). Blomberg’s K showed a similar variation pattern as Pagel’s λ, but had a lower absolute magnitude. In addition, the three traits showed clear divergences among the two life-forms, the five subgenera, and the five distribution ranges (supplementary figs. S10 and S11, Supplementary Material online). For example, the deciduous species at lower altitudes from subg. Pentanthera and three sections (Sciadorhodion, Brachycalyx, and Tsutsusi), the two species of subg. Therorhodion in the boreal-tundra, as well as a few deciduous species of section Rhododendron at extremely high altitudes or cold habitats, exhibited higher leaf N, leaf P, and SLA. In contrast, the evergreen species from subg. Hymenanthes and four sections (Choniastrum, Azaleastrum, Ledum, and Schistanthe) as well as most species of section Rhododendron had lower leaf N, leaf P, and SLA (supplementary fig. S12, Supplementary Material online).
Effects of Environmental Variables and Leaf Functional Traits on the Global Pattern of Rhododendron Species Diversity
According to the multiple regression analysis, all tested models had a lower R2 at the global scale than the regional scale (supplementary tables S6 and S7, Supplementary Material online). The habitat heterogeneity represented by elevation range and the water availability represented by annual precipitation were positively correlated with global Rhododendron species richness. The driving factors of species richness were different among the three biogeographic regions (South Asia, North-East Asia, and the Malay Archipelago) with high species diversity. In South Asia, three variables related to energy availability, including temperature annual range, mean diurnal range, and isothermality, and one soil variable (soil organic carbon content in the fine earth fraction) were stronger predictors of species richness. In North-East Asia, the mean diurnal range, isothermality, and elevation range were significantly correlated with species richness. In the Malay Archipelago, the annual mean temperature and the max temperature of warmest month showed negative correlation, whereas the mean temperature of wettest quarter, annual precipitation, and elevation range showed positive correlation with species richness (fig. 4 and supplementary table S7, Supplementary Material online). Although habitat shifts were numerous in Rhododendron, we only found phylogenetic constraints on elevation range of species distribution and leaf functional traits (supplementary fig. S12, Supplementary Material online). For example, the values of leaf N, leaf P, and SLA were generally lower in evergreen trees at higher altitudes in South Asia and the Malay Archipelago, but higher in deciduous shrubs at lower altitudes in North-East Asia and North America and deciduous creeping shrubs at extremely high altitudes in South Asia and North-East Asia.
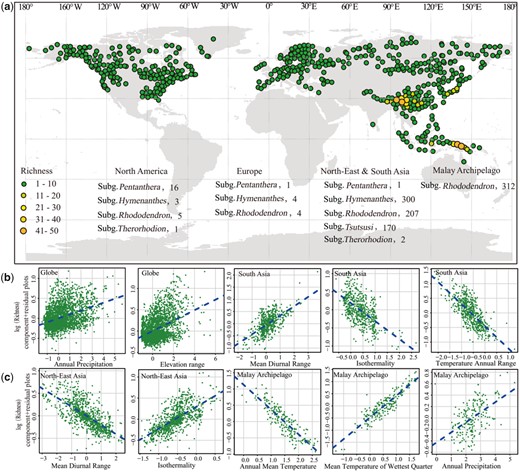
Global patterns of Rhododendron species diversity and the species composition in each geographical region (a), and the correlations between species richness and environmental variables at the global and regional (b, c) scales across grid cells of 50 km×50 km.
Discussion
Phylogenetic and Biogeographic History of Global Rhododendron
Phylogenetic reconstruction of the cosmopolitan genus Rhododendron with at least 1,000 named species, most of which originated from recent evolutionary radiations, had been a notoriously challenge. However, using 3,437 orthologous nuclear genes from transcriptomes, our phylogenomic analysis has generated a highly supported and dated backbone phylogeny of Rhododendron comprising 200 species that represent all subgenera, sections and nearly all subsections (fig. 1 and supplementary table S1, Supplementary Material online), which is also supported by the analysis of 38 chloroplast genes (supplementary fig. S3, Supplementary Material online). The transcriptome-based phylogeny supports the division of Rhododendron into five subgenera and 11 sections (fig. 1), and indicates a need to redefine some subgenera and sections, although more species should be sampled to reconstruct a robust species tree of this large genus in future studies. For example, the previously recognized subgenus Choniastrum was inferred as sister to the large subgenus Rhododendron by some previous studies (Goetsch et al. 2005; Shrestha, Wang, et al. 2018), but is nested within subg. Tsutsusi and placed as sister to a clade comprising three sections (Azaleastrum, Brachycalyx, and Tsutsusi) in the present study. In addition, the previously recognized genus Menziesia is nested within subg. Tsutsusi as found in previous molecular phylogenetic studies (Goetsch et al. 2005; Gillespie and Kron 2010; Yan et al. 2015; Shrestha, Wang, et al. 2018) (fig. 1). Therefore, subg. Tsutsusi defined by Chamberlain et al. (1996) is not monophyletic, and the available evidence suggests that Menziesia and subg. Choniastrum should be merged into subg. Tsutsusi. Moreover, our data support the monophyly of section Schistanthe, which comprises approximately 312 species and more than 95% of these species are endemic to the Malay Archipelago.
Notably, the transcriptome-based phylogeny also shows a very high resolution of interspecific relationships, indicating that phylotranscriptomics is an economical and highly efficient approach for tree of life reconstruction at the species level, even for plant groups with recent evolutionary radiations like Rhododendron or with long generation times and slow molecular evolutionary rates like pines (Jin et al. 2021). It is generally recognized that transcriptome sequencing (RNA-seq) needs fresh samples, but actually silica-gel dried plant materials are also suitable for phylotranscriptomic studies according to our experience, because phylotranscriptomics uses OGs generated from RNA-seq and does not compare gene expression levels. Therefore, phylotranscriptomics is very promising in phylogenetic reconstruction. In contrast, restriction site associated DNA sequencing (RAD-seq) can only be used to investigate shallow phylogenetic relationships. Although hybridization enrichment sequencing (Hyb-seq) can use DNA from herbarium specimens and is appropriate to study phylogenetic relationships at different taxonomic levels, this approach needs to design hybridization probes, which require a priori knowledge of target sequences (see review by Yu et al. [2018]). We believe that phylotranscriptomics will be increasingly used in tree of life reconstruction.
The solid phylogeny of Rhododendron provides an excellent opportunity to explore the evolutionary and biogeographic history, and further to reveal the mechanisms underlying evolutionary radiations in this genus. The crown age estimate (∼64 Ma) and reconstructed ancestral areas for different nodes (figs. 1 and 2; supplementary fig. S4, Supplementary Material online), together with the fossil record (Collinson and Crane 1978), strongly suggest that Rhododendron originated in boreal regions in the early Paleocene and subsequently underwent several vicariance and dispersal events, as well as anagenetic events (supplementary table S3, Supplementary Material online). This is corroborated by the most basal position of subg. Therorhodion (fig. 1), which has peduncles bearing leaf-like bracts and only includes two species distributed in both sides of Beringia. Molecular dating indicates that all extant lineages of Rhododendron, with the exception of subg. Therorhodion, did not diverge until the late Eocene (figs. 1 and 2; supplementary fig. S4, Supplementary Material online). In particular, currently, the greatest diversity of Rhododendron occurs in the Himalaya-Hengduan Mountains and the Malay Archipelago, where at least 860 species have been recognized, of which nearly all studied species diverged in the Miocene (fig. 2). Therefore, we infer that most extant species of Rhododendron originated from evolutionary radiations when the genus migrated southward from circumboreal areas to tropical/subtropical mountains and across the equator to Southeast Asia in the middle Miocene. Our inference about the radiations is also supported by the dramatic increases in net diversification rate in the same period (fig. 3a), especially in the two large sections Ponticum and Schistanthe (fig. 3b), which comprise at least 600 species that occur in the Himalaya-Hengduan Mountains and the Malay Archipelago. The long distance migration of Rhododendron might have been facilitated by the strong dispersal ability of its small wind-dispersed seeds. A north-to-south migration history was also revealed in the two large subgenera Hymenanthes and Rhododendron as well as in the large section Schistanthe (fig. 2 and supplementary fig. S6, Supplementary Material online). Considering that approximately five-sixth species became extinct in the Cretaceous-Paleogene mass extinction event (Zachos et al. 2008), the earlier lineages of Rhododendron in Europe likely went extinct during the Paleocene based on the earliest fossil record (Collinson and Crane 1978).
Geographic and Climatic Factors Driving Evolutionary Radiations and Global Patterns of Species Richness of Rhododendron
All evidence supports our hypothesis that the evolutionary radiations in Rhododendron were driven by the interactions of topographical heterogeneity and great increase in precipitation. In the Neogene, several uplift episodes of the Qinghai-Tibet Plateau and the Himalayas occurred sequentially, which created high mountains and deep valleys and led to the changes in drainage systems (Clark et al. 2004; Royden et al. 2008). This diverse and heterogeneous topography could have triggered the great diversification of Rhododendron in these regions. In this study, we detected numerous within-area speciation events in the Himalaya-Hengduan Mountains (supplementary table S3, Supplementary Material online), and the newly evolved species are much younger than those from the high latitudes of Eurasia and North America (fig. 2 and supplementary fig. S6, Supplementary Material online). The other within-area speciation events mainly occurred in the uplands of Southeast Asia in section Schistanthe (supplementary table S3, Supplementary Material online), which includes approximately 312 species, and 150 of them from New Guinea, Australia, and the Solomon Islands constitute a monophyletic group (Goetsch et al. 2011) that evolved with the Plio-Pleistocene orogeny in New Guinea. Correspondingly, the net diversification rate has greatly increased since the Miocene (fig. 3a), especially in the two large sections Ponticum and Schistanthe that are mainly distributed in the Himalaya-Hengduan Mountains and the Malay Archipelago, respectively (fig. 3b). The association between mountain uplift and dramatic increase of net diversification rate, together with a number of within-area speciation events, indicates that topographical heterogeneity, elevation range in particular, has driven the evolutionary radiations in Rhododendron. However, topography alone cannot explain why Rhododendron does not show a high diversity in other continents with many mountainous areas, which is very different from Quercus, another large woody plant genus that experienced evolutionary radiations in both East Asia and North America (Hipp et al. 2020).
Shrestha, Su, et al. (2018) inferred that habitat heterogeneity, followed by climate seasonality, led to the diversification of Rhododendron. In contrast, our study found that the species richness of Rhododendron is significantly positively correlated with elevation range and annual precipitation (fig. 4). Previous studies suggested that a vast arid zone occurred from southeast to northwest China during the Paleogene due to the zonal planetary wind system (Sun and Wang 2005; Guo et al. 2008), but during the Neogene the intensification of the Asian monsoon led to a significant change of the environment in East Asia from large arid areas to more humid areas (Zhang et al. 2007). The vegetation of East Asia also changed rapidly with the development of widespread humid forest in the early Miocene (Hsu 1983). This shift seems to coincide with diversification rate acceleration in sections Schistanthe, Ponticum, Rhododendron, and Tsutsusi at ∼ 21 Ma (supplementary fig. S4, Supplementary Material online). Based on the above discussion, we may conclude that in the middle to late Miocene active mountain uplift in East Asia, the Himalayas, and Southeast Asia to Oceania produced highly heterogeneous habitats represented by a wide elevation range, which, together with high precipitation caused mainly by the intensification of the Asian monsoon, greatly promoted the rapid diversification of Rhododendron in Asia. Our conclusion is also corroborated by rapid increases of both net diversification rate and evolutionary rate of environmental factors in the Miocene (fig. 3a), which suggests that ecological factors have driven evolutionary radiations in Rhododendron. Nevertheless, some biotic factors such as mycorrhizal fungi might also have contributed to the species richness of Rhododendron, which needs to be investigated in future studies.
The uneven diversification of Rhododendron in different continents also led to a unique global pattern of its species diversity, that is, a great diversity in Asia (including Southeast Asia) versus a low species richness in Europe and North America. Although mountain uplift also occurred in southern Europe and western North America in the Neogene (Morley 2018; Fernandes et al. 2019), it was not active as in Asia, and the relatively dry habitats limited the diversification of Rhododendron. This also explains why some continents such as America and Europe have a low species diversity of Rhododendron, although they have many mountainous areas. One may argue that the low species diversity of Rhododendron in America and Europe could be attributed to extinctions caused by the Quaternary glaciations. However, this is not supported by the fact that most extant species of Rhododendron in the world originated in the Miocene (fig. 2a). Actually, the Pleistocene glacial cycles not only led to species extinctions, but also drove evolutionary radiations in some plant genera such as Lupinus (Nevado et al. 2018). In addition, the energy availability, represented by mean diurnal range, isothermality, temperature annual range, and annual mean temperature, also played an important role in shaping regional species richness of Rhododendron (fig. 4). In contrast to the finding of previous studies that species richness of woody plants was often limited by cold winter temperatures (Wang et al. 2011), the species richness of Rhododendron in the Malay Archipelago is significantly negatively correlated with annual mean temperature (fig. 4c), indicating a prefer of cold climate. The RPANDA analysis also indicates that the net diversification rate of Rhododendron increased in a relatively cool climate, but decreased in a warm climate (>10 °C) (supplementary fig. S9, Supplementary Material online). Indeed, most extant Rhododendron species are cold-resistant and grow in cold and humid habitats, even at an altitude up to 5800 m for R. nivale (Wu et al. 2005).
Adaptation of Functional Traits with Phylogenetic and Environmental Conservatisms
The evolutionary radiations in Rhododendron were further strengthened by the adaptation of leaf functional traits. The net diversification rate and the evolutionary rate of environmental factors increased sharply, but the rate of leaf functional traits decreased slowly after the early Miocene (fig. 3a). Additionally, the rate of leaf traits had a major shift in section Ponticum (supplementary figs. S7 and S10–S12, Supplementary Material online). These may suggest an adaptation of functional traits with phylogenetic and environmental conservatisms. The leaf functional traits, including SLA, leaf N, leaf P, and leaf C, show different strategies for resource capture, and are fundamental to survival and growth (Chapin 1980; Grime et al. 1997; Reich et al. 1997; Diaz et al. 2004, 2016; Wright et al. 2004). Previous studies have investigated the distributions, relationships, and adaptation of leaf functional traits at both global and regional scales (Chapin 1980; Reich et al. 1997; Wright et al. 2004; Diaz et al. 2016), and reported phylogenetic conservatism of some traits (Ackerly and Donoghue 1998; Cavender-Bares et al. 2004; Hao et al. 2011; Liu et al. 2015), but rarely focused on the global patterns of these traits for a specific plant group. Based on the robust species phylogeny of Rhododendron (fig. 1), our present study further analyzed seven leaf functional traits in these species, which have a common genetic background and similar divergence times, and thus can better understand the evolution and ecological adaptation of these traits. We found that three traits (SLA, leaf N, and leaf P) show strong phylogenetic signals at the subgenus level (supplementary table S5, Supplementary Material online), and these traits with phylogenetic conservatism are closely related to plant nutrient use, which might be caused by stabilizing selection of nutrient availability in different habitats and correlated adaptations between structural and functional traits. Moreover, the variation of SLA, leaf N, and leaf P corresponds well with leaf-forms and geographical distributions of species in Rhododendron. Leaves of deciduous species show higher nutrient concentration and greater SLA than evergreen species, and particularly the North American species mainly belonging to the deciduous subgenus Pentanthera with distribution at low altitudes exhibit much higher SLA, leaf N, and leaf P than the species of South Asia and Malay Archipelago mainly belonging to the subalpine/alpine evergreen sections Ponticum and Schistanthe (supplementary figs. S10–S12, Supplementary Material online), which also display the highest diversification rates (fig. 2). This suggests that plants adjust their ecophysiological traits to compete for resources in various environments, with trade-offs between coadapted traits (Santiago and Kim 2009). Compared with species with deciduous leaves, that is, the “acquisitive” leaves that tend to exhibit photosynthetic capacity and growth rate (Givnish 2002; Santiago et al. 2004; Kikuzawa et al. 2013), species with evergreen leaves (low-SLA and nitrogen-poor “conservative” leaves) are expected to have higher survival in the face of abiotic and biotic hazards (Wright et al. 2004; Defossez et al. 2018). This also explains why Rhododendron survived great environmental changes and adapted to new environments with evolutionary radiations in the Himalaya-Hengduan Mountains and the Malay Archipelago.
Conclusions
Our study has revealed the spatiotemporal evolution of Rhododendron and the mechanisms underlying evolutionary radiations in this large cosmopolitan genus by using a combination of phylogenomic, ecological, and ecophysiological approaches. Based on 3437 OGs generated from transcriptome sequencing, we have successfully reconstructed a robust and dated backbone phylogeny of Rhododendron, which is also supported by the analysis of 38 chloroplast genes. Our results show that most extant species of Rhododendron originated by evolutionary radiations in the Neogene when the genus migrated southward from circumboreal areas to tropical/subtropical mountains, and the evolutionary radiations were jointly driven by the topographical heterogeneity caused by mountain uplift and the great increase in precipitation associated with the intensification of the Asian monsoon, and were further strengthened by the adaptation of leaf functional traits. In future studies, it would be interesting to investigate whether some biotic factors such as mycorrhizal fungi have played important roles in driving the diversification of Rhododendron. Moreover, genome sequencing of representative species from different subgenera and sections will be helpful to understand the genetic basis for their adaptations to different habitats, especially to high elevations.
Materials and Methods
Plant Sampling, Sequencing, and Data Processing
We sampled a total of 250 individuals for transcriptome sequencing, including 202 species of Rhododendron that represent all eight subgenera, all 15 sections and nearly all multispecies subsections of this genus, and two species (Diplarche multiflora and Empetrum nigrum) as outgroups, based on the most close relationships between Rhododendron and the two genera Diplarche and Empetrum (Gillespie and Kron 2010). Among the samples of Rhododendron, 198 species were recognized by Chamberlain et al. (1996), and four species (R. benhallii, R. multiflorum, R. pentandrum, and R. goyozanense) were transferred from Menziesia by Craven (2011). These samples comprise 30 deciduous, 21 semievergreen, and 151 evergreen species, and well represent different life-forms (tree, shrub, and small creeper) (supplementary table S1, Supplementary Material online).
To test the monophyly of the species that are difficult to discriminate from their close relatives, each of them was represented by two individuals. In addition, six of the 250 individuals, representing six Rhododendron species (R. championiae, R. tomentosum, R. mucronulatum, R. austrinum, R. jinggangshanicum, and R. hunnewellianum) from different subgenera, were also used for chloroplast genome sequencing (supplementary table S1, Supplementary Material online). For transcriptome sequencing, total RNA was extracted from young leaves and leaf buds using the RNAprep Pure Plant Kit (Tiangen, Beijing, China). The cDNA libraries were constructed with NEBNext Ultra Directional RNA Library Prep Kit for Illumina (New England BioLabs Inc., Ipswich, MA) and sequenced on the Illumina HiSeq 2500 platform (Illumina Inc., San Diego, CA), which generated paired-end reads of 100 or 150 bp used in de novo assembly with Trinity v. 2.0.6 (Grabherr et al. 2011). After discarding redundant transcripts using CD-HIT v. 4.6.5 (Li and Godzik 2006; Fu et al. 2012) with a similarity threshold of 1, the longest transcript of each gene was retained. The coding sequences (CDS) were identified with TransDecoder v. 0.36 (https://github.com/TransDecoder/TransDecoder/releases) (Haas et al. 2013), and the CDS encoding the longest peptide was retained for the ortholog search. For chloroplast genome sequencing, total DNA was extracted from fresh young leaves using the CTAB method (Murray and Thompson 1980). The DNA libraries with an average length of 350 bp were constructed using the NexteraXT DNA library preparation Kit (Illumina, San Diego, CA) and were sequenced on the Illumina Novaseq 6000 platform (Total Genomics Solution Limited, SZHT), generating reads with an average length of 150 bp. These raw reads were edited using NGS QC Tool Kit v2.3.3 (Patel and Jain 2012), and the obtained high-quality reads were assembled de novo into contigs using SPAdes v.3.11.0 (Bankevich et al. 2012). The PGA software (Qu et al. 2019) was used to annotate the chloroplast genomes and identify the protein-encoding genes.
Identification of OGs for Phylogenomic Analysis
Orthologous genes were searched from the transcriptome sequences by HaMStR v.13.2.6 (Ebersberger et al. 2009). First, 4,740 core OGs were identified with OrthoFinder v.2.2.7 (Emms and Kelly 2015), based on ten primer taxa, including R. grande, R. glischrum, R. lanatum, R. fulvum, R. sinogrande, R. pingianum, R. hemsleyanum, R. sikangense, R. simiarum, and R. araiophyllum. These OGs were then used as queries to search homologous sequences from the 250 samples by HaMStR v.13.2.6 with strict parameters (-est -central -intron=remove -representative -strict -eval_blast = 1e-20 -eval_hmmer = 1e-20). The CDS and AA sequences of each OG were obtained using Perl scripts and aligned using MAFFT v7.407 (Katoh and Standley 2013).
We obtained the optimal OG data set by testing whether conspecific individuals formed highly supported monophyletic groups. A total of 3637 OGs, each of which covered at least 225 individuals (90% of the 250 samples), were concatenated by FASconCAT-G_v.1.04 (Kuck and Longo 2014) for the test. We used IQ-TREE v.2.0-rc1 (Nguyen et al. 2015) to perform maximum-likelihood (ML) analysis for the concatenated data set using the GTR+F+I+G4 model, with 1,000 ultrafast bootstrap replicates (UFBoot) (Hoang et al. 2018). The generated tree showed that all conspecific individuals formed monophyletic groups with high branch support (supplementary fig. S1, Supplementary Material online). Due to computational limitations, to save calculation time, we selected one individual with most OGs in each monophyletic group to represent each species. After discarding the low-quality OGs and putative paralogous genes (supplementary methods, Supplementary Material online), a total of 3437 OGs, each having at least 90% species coverage and a length of at least 300 bp, were retained in the final analyses. In addition, 38 chloroplast genes of 189 species were obtained for phylogenetic analyses (supplementary methods, Supplementary Material online).
Phylogenetic Analyses and Divergence Time Estimation
We used 3437 OGs and 38 chloroplast genes in phylogenetic reconstruction with the ML method in IQ-TREE v.2.0-rc1 (Nguyen et al. 2015). For the 3437 OGs, both concatenation and coalescent approaches were used. In the concatenation analysis, all OGs were concatenated into a supermatrix, and the ML tree was generated under the GTR+F+I+G4 model. In the coalescent analysis, single-gene trees were reconstructed for all OGs and used to estimate the coalescent tree by ASTRAL v.5.7.3 (Zhang et al. 2018) with LPP (Sayyari and Mirarab 2016). For the 38 chloroplast genes, only the concatenation analysis was conducted, and the ML tree was generated using the same method as mentioned above. For all phylogenetic analyses, all codon positions of the OGs/genes were included because no substitutional saturation was detected by DAMBE (Xia 2018), and 1,000 ultrafast bootstrap replicates were used (Hoang et al. 2018).
We used two approaches in divergence time estimation. First, an ultrametric dated tree was generated based on the ML tree of the 3,437 concatenated OGs, using the RelTime method (Tamura et al. 2012) with the general time reversible (GTR) nucleotide substitution model in MEGA X (Kumar et al. 2018). We selected two fossils for time calibration. The seed fossil of R. newburyanum (Collinson and Crane 1978) dated to the Paleocene (∼54.5 Ma) was used to set the minimum age of the Rhododendron crown group, based on the consensus of the available evidence (Popp et al. 2011; Liu et al. 2014; Schwery et al. 2015; Shrestha, Wang, et al. 2018), and the leaf fossil of R. protodilatatum (Tanai and Onoe 1961), dated to the Pliocene (∼5.3 Ma), was used to set the minimum age of the section Brachycalyx crown group as in the study of Yoichi et al. (2017). Second, we used SortaDate (Smith et al. 2018) to extract ten clock-like genes from 830 OGs (each of which covered all sampled species) according to three criteria, including low variation in root-to-tip length (an indication of clock-likeness), small topological conflict with the species tree estimated from the 3,437 OGs, and greater tree length for collecting discernible information. Divergence time was estimated with the merged sequence of the ten clock-like genes by MCMCTree program in PAML (Yang 2007). Using the approximate likelihood calculation method, the ML estimates of branch lengths, the gradient vector, and Hessian matrix were calculated with BASEML under the GTR+G substitution model (dos Reis and Yang 2011). The independent rate model (Rannala and Yang 2007) for molecular clock was set in the mcmctree control file, with the following settings: rgene_gamma=1 16; sigma2_gamma=1 10. Markov chains were sampled every 500 iterations until 20,000 samples were collected, with a burn-in of 10,000,000 iterations. We checked the convergence of each run in Tracer (Rambaut et al. 2018) to confirm that effective sample sizes (ESS) of all parameters were above 200.
Ancestral Area Reconstruction
Ancestral areas were reconstructed using BioGeoBEARS v.1.1.1 (Matzke 2013, 2014) implemented in R v.3.6.2 (R Core Team. 2019). The time-calibrated phylogenetic tree was generated by MEGA X (Kumar et al. 2018), and outgroups were pruned. Six geographic regions (Western North America, Eastern North America, Europe, North-East Asia, South Asia, and the Malay Archipelago) were defined based on the current distribution of Rhododendron (fig. 2a). We tested six models, including the likelihood version of DIVA (DIVALIKE), the DEC model (LAGRANGE’s DEC), and the BayArea likelihood version of the range evolution model (BAYAREA), as well as the “+J” versions of the three models which consider founder events (Matzke 2013). Although the DEC+J model remains controversial (Ree and Sanmartin 2018), we still test it because it might be suitable for Rhododendron, a genus with small wind-dispersed seeds that are helpful for founder-event speciation. We used BSM to calculate the number of dispersal events between the six geographic regions (supplementary methods, Supplementary Material online).
Environmental Data Assembly and Niche Analysis
The global occurrence records of Rhododendron were collected from online databases (the global biodiversity information facility, GBIF, www.gbif.org), herbaria (PE, HAST, K, and TAI), and fieldwork. These data sets were filtered with three criteria (supplementary methods, Supplementary Material online). Finally, we used a total of 13450 unique coordinates from 765 species, including the 200 Rhododendron species used in the phylogenetic analysis.
We compiled 34 environmental factors that represent the features of climate, soil, and land cover to study their relative contributions to the diversity pattern of Rhododendron (supplementary methods, Supplementary Material online). After removing the highly correlated ones (r > 0.8), 27 of the 34 environmental factors were retained for final analysis (supplementary table S6, Supplementary Material online). Multiple regression models were constructed based on the global Rhododendron data set and the data sets for South Asia, North-East Asia, and the Malay Archipelago.
Measurement of Leaf Functional Traits
The SLA data were assembled for the 200 species used in the phylogenetic analysis. Up to five fully expanded leaves per species, representing two to four individuals, were scanned with a leaf area meter and dried at 60 °C for 36 h and the dry mass was determined to 0.0001 g. The SLA (cm2 g−1) was computed by dividing the leaf area by the leaf dry mass. The dry leaves were grounded and homogenized for leaf nutrient measurements. The total leaf nitrogen content (leaf N) and leaf carbon content (leaf C) were determined by the fully automatic element analyzer Vario EL cube (Elementar Analysensysteme GmbH, Hanau, Germany) using one portion of dry leaves. The other portion of dry leaves was digested in HNO3 (p ≈ 1.42 g cm−3), and was used for determination of the concentrations of P (leaf P), K (leaf K), and Mg (leaf Mg) using inductively coupled plasma-optical emission spectrometer (iCAP 6300 ICP-OES spectrometer, Thermo Fisher).
Diversification Rate Estimation
The diversification rates and major shifts were evaluated by BAMM (Rabosky 2014). To alleviate the effect of incomplete and unequal sampling, clade-specific sampling fractions were used to ensure that each section was sampled in proportion to the number of its described species. We performed a run for 10,000,000 generations of MCMC. The convergence was assessed by the ESS of likelihood and the number of shifts (ESS>200). After discarding 25% of samples as burn-in, the BAMM results were used as the input file for BAMMtools (Rabosky et al. 2014). We analyzed all 34 environmental variables and seven functional traits using phylogenetic principal component analysis (PPCA) implemented in R library phytools (Revell 2012) with function phyl.pca. The BAMM trait model was used to explore evolutionary rates for the ordinated data of the environmental variables and functional traits. Based on the first axis of the PPCA results, we performed a run of 10 million generations for the ecological variables and a run of 50 million generations for the functional traits, with a 25% burn-in. All of these analyses were based on the time-calibrated phylogenetic tree from the RelTime method.
To compare different methods for diversification rate estimation in Rhododendron, we also calculated the MS estimators (Magallón and Sanderson 2001; Meyer and Wiens 2018; Rabosky 2018) and б2 trait rates from the Ornstein–Uhlenbeck model (Hansen 1997) based on the sim.bdtree function in the R package GEIGER (Harmon et al. 2008; Pennell et al. 2014). The age of the terminal branch of each clade was used. We set different extinction parameters (0, 0.1, 0.5) to alleviate the effect of extinction on the MS estimators.
RPANDA (Morlon et al. 2016) was further used to investigate the impact of global paleo-temperature on the diversification of Rhododendron based on nine temperature-dependent likelihood models (supplementary table S4, Supplementary Material online). We calculated the Akaike’s Information Criterion with small-sample correction (AICc) value to test the best diversification model. The global paleo-temperature data set was obtained from the conversion by calculating a 5-point mean on a δ18O data set (Cramer et al. 2009).
Investigation of Phylogenetic Signal
To test whether leaf traits are phylogenetically constrained, we used the Blomberg’s K (Adams 2014) and Pagel’s lambda (Pagel 1999) with 1,000 simulation replicates of trait data from the R package caper (Orme 2013) and phytools (Revell 2012). For the quantitative traits, Pagel’s λ was used to show the extent to which traits depart from the expected curve under a Brownian motion model of trait evolution (Pagel 1999). The λ values range between 0 and 1, where λ = 1 indicates that the distribution of trait values across the phylogeny is exactly as expected under Brownian motion, whereas λ = 0 implies no phylogenetic signal. We interpreted the phylogenetic niche conservatism here as being represented by λ values >0.50, which indicates that traits of closely related species are more similar than they would be expected by chance (Cooper et al. 2010).
Supplementary Material
Supplementary data are available at Molecular Biology and Evolution online.
Acknowledgments
We sincerely thank Jian-Sheng Peng (Shangri-La Alpine Botanical Garden), Li-Bing Zhang (Missouri Botanical Garden), Zheng-Yu Liu and Zhong-Wei An (Chongqing Institute of Medicinal Plant Cultivation), Zhi-Duan Chen, Jian-Fei Ye, and Bing Liu (Institute of Botany, Chinese Academy of Sciences), Harry Wiriadinata (Bogor Botanical Gardens, Indonesia), and Arief Hidayat (Research Center for Plant Conservation and Botanic Gardens, Indonesian Institute of Sciences) for their help in plant sampling. We thank Hong Du for her assistance in lab work, and Zhe Cai (Institute of Botany, Chinese Academy of Sciences) and Yi Wang (Southern University of Science and Technology) for assistance with data analyses. This study was supported by the National Key Research and Development Program of China (Grant No. 2017YFA0605100), the Strategic Priority Research Program, Chinese Academy of Sciences (Grant No. XDA23080000), and the Key Research Program of Frontier Sciences, Chinese Academy of Sciences (Grant No. QYZDJ-SSW-SMC027).
Author Contributions
X.-Q.W. conceived and designed the study. X.-M.X. and M.-Q.Y. performed the experiments. X.-M.X., X.-Q.W., C.-L.L., S.-X.H., W.-T.J., and T.-T.S. analyzed the data. X.-Q.W. and X.-M.X. wrote the manuscript. X.-M.X., X.-Q.W., W.Y., Y.-R.Z., F.W., L.-H.Z., and X.-H.L. provided plant materials.
Data Availability
Transcriptome data are deposited in the NCBI SRA database under the BioProject accession PRJNA687836. SRA entries for each assembly are listed in supplementary table S1, Supplementary Material online. The complete chloroplast genome sequence data of the six Rhododendron species are deposited in GenBank accession numbers OK586896–OK586901. Sequence alignments, phylogenetic trees, and other data files generated in this study are deposited at Dryad (https://doi.org/10.5061/dryad.s4mw6m97d).
