


Abstract
Thailand and Laos, located in the center of Mainland Southeast Asia (MSEA), harbor diverse ethnolinguistic groups encompassing all five language families of MSEA: Tai-Kadai (TK), Austroasiatic (AA), Sino-Tibetan (ST), Hmong-Mien (HM), and Austronesian (AN). Previous genetic studies of Thai/Lao populations have focused almost exclusively on uniparental markers and there is a paucity of genome-wide studies. We therefore generated genome-wide SNP data for 33 ethnolinguistic groups, belonging to the five MSEA language families from Thailand and Laos, and analyzed these together with data from modern Asian populations and SEA ancient samples. Overall, we find genetic structure according to language family, albeit with heterogeneity in the AA-, HM-, and ST-speaking groups, and in the hill tribes, that reflects both population interactions and genetic drift. For the TK speaking groups, we find localized genetic structure that is driven by different levels of interaction with other groups in the same geographic region. Several Thai groups exhibit admixture from South Asia, which we date to ∼600–1000 years ago, corresponding to a time of intensive international trade networks that had a major cultural impact on Thailand. An AN group from Southern Thailand shows both South Asian admixture as well as overall affinities with AA-speaking groups in the region, suggesting an impact of cultural diffusion. Overall, we provide the first detailed insights into the genetic profiles of Thai/Lao ethnolinguistic groups, which should be helpful for reconstructing human genetic history in MSEA and selecting populations for participation in ongoing whole genome sequence and biomedical studies.
Introduction
Mainland Southeast Asia (MSEA), consisting of Myanmar, Cambodia, Vietnam, western Malaysia, Laos, and Thailand, is a region of enormous diversity, with a population of ∼263 million people speaking ∼229 languages belonging to five major language families: Tai-Kadai (TK), Austroasiatic (AA), Sino-Tibetan (ST), Hmong-Mien (HM), and Austronesian (AN) (Eberhard et al. 2020). Thailand and Laos are in the center of MSEA and are characterized by a diverse landscape involving highlands and lowlands, long coastlines, and many rivers. North-versus-south movements are facilitated by several rivers, including the Mekong, Chao Phraya, and Salaween which are considered to be a key factor for population movement from southern China and upper MSEA to lower MSEA. In addition, the Malay Peninsula to the south acts as a crossroad, facilitating east-versus-west movement by sea and by the narrow width of the Kra Isthmus (the narrowest part of the Malay Peninsula).
The geographic heterogeneity of Thailand and Laos is reflected in the ethnolinguistic diversity of the region. There are ∼68.6 million people in Thailand and ∼6.8 million in Laos, speaking ∼159 languages belonging to all five major MSEA language families (Eberhard et al. 2020). TK languages are widespread in southern China and MSEA and are quite prevalent in present-day Thailand and Laos, spoken by 89.4% of Thais and 65.7% of Laotians. The major TK speaking groups in northern, northeastern, central, and southern Thailand are known as Khonmueang, Lao Isan, Central Thai, and Southern Thai or Khon Tai, respectively (Eberhard et al. 2020). AA languages are next in predominance, spoken by 4.0% of Thais and 26.2% of Laotians. In addition, this area is also inhabited by historical migrants who speak ST, HM, and AN languages (frequencies of 3.2%, 0.2%, and 2.8%, respectively, in Thailand; and 2.9%, 4.7%, and 0% in Laos) (Eberhard et al. 2020). The AA, HM, and ST languages are spoken mainly by highlanders (the hill tribes) in northern and western Thailand, and in midland and upland regions in Laos, although AA languages are also spoken by some lowland groups, for example, the Mon. AN-speaking groups, such as the Thai Malay (SouthernThai_AN), are distributed in the Southern Provinces of Thailand, bordering with Malaysia.
Archaeological records document a long history of human occupation of the area, with modern human remains dated to 46–63 thousand years ago (kya) in northern Laos (Demeter et al. 2012). In addition, cultural remains of SEA hunter-gatherers (e.g., flake stone tools of the Hòabìnhian culture) have been found in northern Thailand dating to 35–40 kya (Shoocondej 2006), and in southern Thailand dating to 27–38 kya (Anderson 1990). The transition from a hunter-gatherer tradition to a Neolithic agricultural lifestyle occurs ∼4 kya all across Thailand and Laos (Higham and Thodsarat 2012; Higham 2014); agriculture in MSEA probably has its origins in the valley of the Yangtze River in China (Higham and Thodsarat 2012), and ancient DNA evidence indicates that present-day AA speaking groups in MSEA are most closely related to Neolithic agricultural communities (McColl et al. 2018; Lipson et al. 2018).
However, the common languages shared by Thais and Laotians are TK languages, not AA languages. The origin of the TK languages is thought to be in what is now southern or southeastern China, and they probably spread to MSEA during the Iron Age (Pittayaporn 2014). Whether the spread of TK languages occurred via demic diffusion (an expansion of people that brought both their genes and their language) or cultural diffusion (language spread with at most minor movement of people) has been debated (Sangvichien 1966; Nakbunlung 1994; Pittayaporn 2014). Previous genetic studies of uniparental lineages have generally supported demic diffusion for the maternal side but cultural diffusion from the AA people for the paternal side for major Thai/Lao TK groups (Kutanan et al. 2017, 2018b, 2019). Archaeological evidence suggests other population contacts in the region, for example, objects from India that appear during the late Bronze Age and Iron Age and involve the AA-speaking Khmer and Mon (Higham and Thodsarat 2012,; ,Higham 2014). Moreover, the HM- and ST-speaking hill tribes in the mountainous areas of northern Thailand, northern Myanmar, northern Laos, and southern China migrated to the region during historical times, ∼200 years ago (ya) (Schliesinger 2000; Penth and Forbes 2004). Taken together, the archaeological and linguistic evidence suggest a complex population structure and history of the ethnolinguistic groups of Thailand and Laos.
This population structure and history remains largely unexplored by genetic studies, which have almost exclusively analyzed autosomal short tandem repeat (STR) loci, and mitochondrial DNA (mtDNA), and male specific Y chromosome (MSY) sequences. These studies revealed the relative genetic heterogeneity of the AA groups and homogeneity of TK groups (Kutanan et al. 2014, 2017, 2019; Srithawong et al. 2015, 2020; Kampuansai et al. 2017, 2020) and contrasting male and female genetic histories in the region, especially for the matrilocal versus patrilocal hill tribes (Oota et al. 2001; Besaggio et al. 2007; Kutanan et al. 2018a, 2019, 2020). While genome-wide data provide much richer insights into population structure and genetic history, previous genome-wide studies of Thai/Lao populations are either primarily from northern populations (HUGO Pan-Asian SNP Consortium 2009; Xu et al. 2010; Lipson et al. 2018) or do not provide any information on ethnolinguistic background (Wangkumhang et al. 2013; Lazaridis et al. 2014). Therefore, we here generated genome-wide SNP data for 452 individuals from 33 ethnolinguistic groups from Thailand and Laos, including two southern Thai groups that have not been involved in any previous genetic studies, speaking languages that encompass all five language families in MSEA. We analyzed the allele and haplotype sharing within and between the Thai/Lao groups and compared them with both modern Asian populations and nearby SEA ancient samples. Our results provide several new insights into the genetic prehistory of MSEA through the lens of populations from Thailand and Laos.
Results and Discussions
Overview of Genetic Structure and Allele Sharing
We generated genome-wide SNP data for 452 individuals from 32 populations from Thailand and 1 population from Laos; when combined with previously published data from 3 Thai populations (Lipson et al. 2018; Lazaridis et al. 2014), there are 482 Thai/Lao samples belonging to 36 populations (fig. 1). We also merged our data with data from modern Asian populations generated on the same platform and SEA ancient samples (supplementary table 1, Supplementary Material online; supplementary fig. 1, Supplementary Material online). We began with principal component analysis (PCA) to investigate the overall population structure of the merged data set and identify any outliers (supplementary fig. 2, Supplementary Material online). After outliers were removed, PC1 separates South Asian (SA) from East Asian (EA) groups, with the Kharia (#44), Onge (#45), and Uygur (#65) located in between (fig. 2A;supplementary fig. 3, Supplementary Material online). PC2 separates Northeast Asian (NEA) groups from SEA groups. With respect to the major MSEA linguistic groups, ST and HM groups are generally separated from the AA, TK, and AN groups on PC2, while the latter three overlap one another (fig. 2B). Exceptionally, the Karen speaking ST groups (Karen_ST; #7–9) also overlap the AA, TK, and AN groups (fig. 2B), while the ST-speaking Lahu from Thailand (#6) and China (#56) and the HM-speaking IuMien (#3) are grouped with the AA-speaking Kinh (#52) and close to the northern Thai TK groups (N_TK; #21–26). Strikingly, four Thai groups from this study, that is, the AA-speaking Mon (Monic_AA; #20), AN-speaking SouthernThai_AN (#4), and TK-speaking CentralThai (C_TK; #34) and SouthernThai_TK (#35), as well as the previously published Thai-HO (#36; this population is from the Human Origins data set of Lazaridis et al. 2014, with no further details available), Mamanwa (#46) and Cambodian (#51), all show additional affinity toward the SA populations (fig. 2A and B). Interestingly, the AN-speaking group from Thailand (SouthernThai_AN; #4), is not close to the AN groups from Taiwan (Amis and Atayal) or Indonesia (Semende and Borneo; #47-48), but rather they are near the AN-speaking Negrito group Mamanwa (#46) from the Philippines, and the Monic_AA, C_TK and S_TK groups. When the PCA was performed on only SEA individuals, four poles were observed: those groups showing additional affinity to SA populations; the Khmuic/Katuic AA speaking groups (Khmu_Katu_AA); the Lahu ST speaking groups; and the HM groups; which implies additional admixture or drift has happened in these groups relative to the other SEA groups supplementary fig. 4, Supplementary Material online).
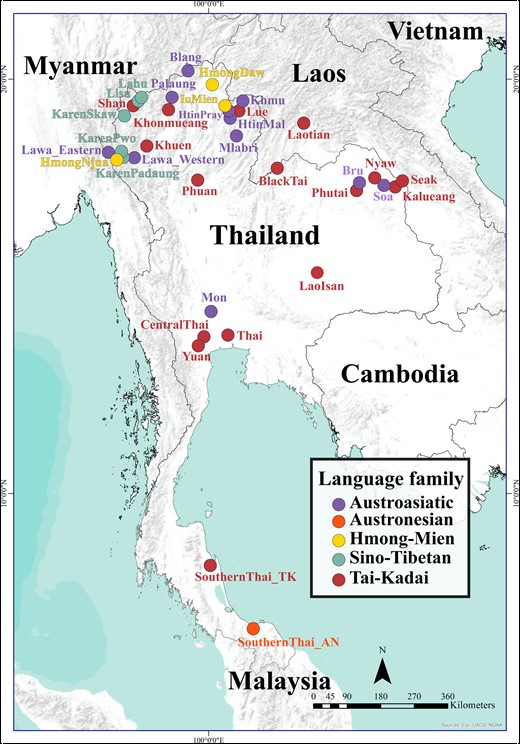
Map showing the location of the 36 Thai/Lao ethnolinguistic groups analyzed in this study, color-coded according to language family.
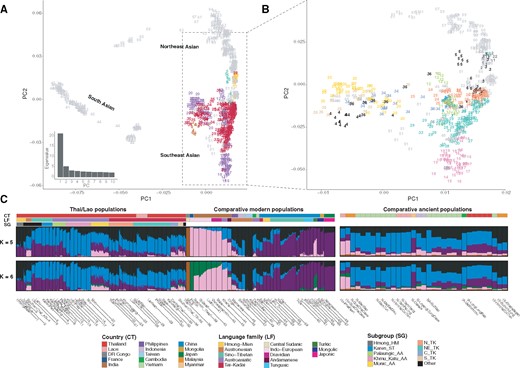
Population structure analyses. (A) Plot of PC1 versus PC2 for the SNP data for individuals from South Asia, Northeast Asia, and Southeast Asia. Individuals are numbered according to population, as indicated in supplementary table 1, Supplementary Material online and in the population labels in panel (C). Thai/Lao groups are colored by language family according to the key at the bottom of panel (C) while other groups are in gray (see supplementary fig. 3, Supplementary Material online for the same PC plot with all samples colored by country and by language family). The eigenvalues from PC1 to PC10 are shown on the bottom left side. (B) Plot focusing on Southeast Asian and Chinese populations speaking AA, AN, HM, ST, and TK languages, zoomed-in from (A). Thai/Lao groups are colored according to subgroup while other groups are in grey. (C) ADMIXTURE results for K = 5 and K = 6. Each individual is represented by a bar, which is partitioned into K colored segments that represent the individual’s estimated membership fractions in each of the K ancestry components. Populations are separated by black lines for modern populations and excavation sites and time periods are separated by black lines for ancient samples. The three colored bars at the top of the plot indicate the country (top), language family (middle), and subgroup (bottom) for each sample, according to the key at the bottom. The PCA analysis was performed on the pruned data set of 842 individuals and 153,191 SNPs, while the ADMIXTURE analysis was performed on the pruned data set of 895 individuals (including 10 Mbuti, 10 French, and 33 ancient individuals) and 158,772 SNPs; the highly drifted modern populations (Onge, Mlabri, and Mamanwa) and ancient samples were projected in ADMIXTURE analyses (see PCA with ancient samples projected in supplementary fig. 3, Supplementary Material online).
We then performed ADMIXTURE analysis to further investigate population structure. The lowest cross validation error occurred at K = 5 and K = 6 (supplementary fig. 5, Supplementary Material online); corresponding results are shown in fig. 2C. For K = 5, there is a brown component associated with Mbuti, a pink component appearing in French and Indian groups, a purple component enriched in NEA groups, a black component dominant in AN-speaking Amis and Atayal from Taiwan, and a blue component enriched in Khmu_Katu_AA groups from Thailand. Most of the Thai/Lao TK-speaking groups show two major sources (black and blue) with the purple component as a minor source, except that the C_TK and S_TK groups and Thai-HO have a substantial fraction of the pink component, as do the Monic_AA and Southern Thai_AN. This indication of potential relatedness with SA groups is consistent with the PCA results (fig. 2A and B). At K = 6, there appears a green component that separates French from South Asian populations (fig. 2C). This green component substantially reduces the pink component in the NEA groups but has a negligible effect on the SA-related Thai groups. Although increasing K values are associated with higher cross-validation errors, the additional new components reveal additional population structure (supplementary fig. 6, Supplementary Material online). At K = 7, 8, and 9, the Lahu from Thailand and China, the HM-speaking Hmong (Hmong_HM), and Karen_ST groups from Thailand are enriched for their own sources, respectively. At K = 11, the Soa and Bru (Katuic speaking populations of the Khmu_Katu_AA group) stand out with a light brown component.
To analyze population relationships based on allele sharing, we calculated outgroup f3-statistics of the form f3(X, Y; outgroup) that measure the shared drift between populations X and Y since their divergence from the outgroup (Mbuti). Higher outgroup f3 values indicate more shared drift between populations. The SouthernThai_AN, Monic_AA, C_TK, and S_TK groups and Thai-HO exhibit the lowest f3-values with other populations/ancient samples and also with each other (fig. 3), while the HM speaking populations show the strongest sharing with each other. TK populations exhibit close genetic affinity with each other, except for the C_TK, S_TK, and Thai-HO groups, and also share alleles with the HM speaking populations, consistent with results of the ADMIXTURE analysis at K = 8 (supplementary fig. 6, Supplementary Material online). There is higher sharing between the Thai/Lao groups and other SEA and southern Chinese groups (i.e., TK, HM, and non-NEA ST Chinese groups) than with SA and NEA groups (fig. 3). The highest sharing was between Thai Lahu and Chinese Lahu. The Amis and Atayal share more alleles with the TK groups than with the SouthernThai_AN group from Thailand (fig. 3), in agreement with ADMIXTURE results (fig. 2C;supplementary fig. 6, Supplementary Material online).
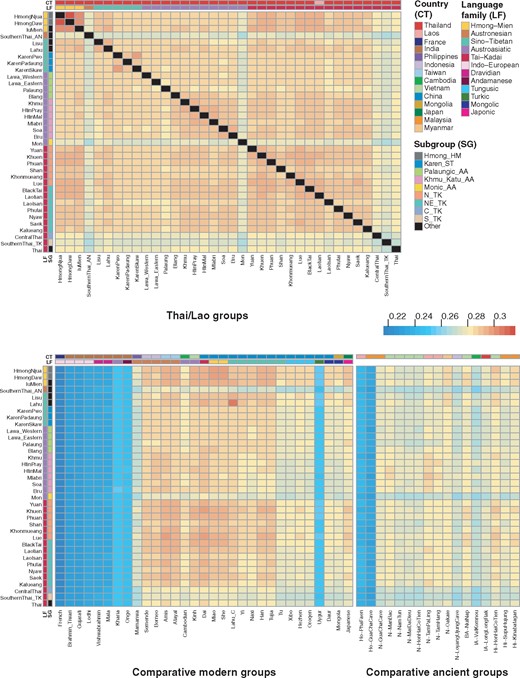
Population allele sharing profiles based on f3 statistics. Heatmap of outgroup f3 statistics (Thai/Lao groups, X; Mbuti) among Thai/Lao groups (upper) panel, and between Thai/Lao and other comparative modern Asian populations and ancient samples (lower). Black blocks denote missing values. The two colored bars at the top of the plot indicate the country (top) and language family (bottom) for each comparative population; and those on the side indicate language family (left) and subgroup (right) for each Thai/Lao group, according to the key at the right.
When ancient samples are included in the analyses of genetic structure and allele sharing, the two Hòabìnhian samples (#69–70) are projected close to the Onge on PCA (supplementary fig. 3, Supplementary Material online), while most of the Neolithic samples (#71–79) fall with the AA and AN groups. However, the N-Oakaie sample (#78) from Myanmar is closer to ST and HM groups. Most of the Bronze/Iron Ages samples (#80–82) cluster with the TK and AA samples except for the BA-NuiNap samples (#80) from Vietnam, which are close to the Neolithic samples. With respect to ADMIXTURE result at K = 5 (fig. 2C), the Hòabìnhian samples show a major pink component with minor blue and purple components, while all of the Neolithic samples exhibit a major blue component with minor black, pink, and purple components, except that the purple component is enriched in the N-Oakaie sample from Myanmar, and reduced/lacking in the N-GuaChaCave samples from Malaysia and the N-TamPaLing and N-TamHang samples from Laos. The purple component is also enriched in the IA-LongLongRak Iron Age samples from Thailand. The black component is substantially increased in the Bronze Age and historical samples, such as the BA-NuiNap and Hi-HonHaiCoTien samples from Vietnam and the Hi-SupuHujung and Hi-Kinabatagan samples from Malaysia (a similar pattern is seen in the Thai/Lao TK groups). In the outgroup f3 result (fig. 3), the ancient samples N-TamPaLing and N-TamHang share more with the Khmu_Katu_AA and NortheasternThai_TK (NE_TK) groups, but N-Oakaie shares more with the ST-speaking Lisu and Lahu groups and HM-speaking Hmong and IuMien groups. The Iron Age samples show overall less allele-sharing with Thai/Lao groups, whereas the Bronze Age and historical samples from Vietnam and Malaysia show higher sharing with the Thai/Lao TK and HM groups, in agreement with the ADMIXTURE results (fig. 2C). Our results support previous findings (Lipson et al. 2018; McColl et al. 2018): the Hòabìnhian samples are genetically related to Andamanese Onge: the Neolithic samples share ancestry with the AA populations (except for the N-Oakaie sample from Myanmar, which shares ancestry with ST speaking populations); and most Bronze/Iron Age samples are genetically related to both AN and TK speaking populations. However, the inclusion of many more ethnolinguistic groups in our study brings additional insights, for example, not all AA populations (Mon and Palaung) are equally related to Neolithic samples, suggesting genetic heterogeneity and the complexity of SEA prehistory.
Based on the overview provided by the PCA, ADMIXTURE, and outgroup f3 results, we focus on the following aspects of the data: genetic structure and heterogeneity of Austroasiatic speaking groups; genetic structure of the hill tribes; differences among the four major TK speaking groups according to geographic region; and South Asian-related admixture.
Genetic Structure and the Heterogeneity of Austroasiatic Speaking Groups
AA speakers (comprising ∼102 million people speaking 167 languages) are widespread across Asia, from South Asia (Bangladesh and India) to southern China and MSEA (Eberhard et al. 2020). There are two competing hypotheses of AA origins that are related to rice cultivation, namely South Asian versus Southeast Asian origins (Diffloth 2005; Chaubey et al. 2011); the latter is supported by genetic evidence (Chaubey et al. 2011). The AA people in SEA are most likely related to farmers who cultivated rice and millet and moved from their homeland, probably located near the Yangtze River, to the coast and then down the rivers of mainland China to SEA ∼4 kya (Weber et al. 2010; van Driem 2017; Lipson et al. 2018; McColl et al. 2018). However, prior to the movement of prehistoric AA-related groups southward, present-day MSEA (both upland and lowland) was home to hunter-gatherers whose descendants are genetically related to groups in southern Thailand and west Malaysia, such as the Maniq and Jehai (Jinam et al. 2012). The Neolithic farmer expansion did not completely replace the hunter-gatherers but admixed with some of them, as reflected by both ancient and modern DNA studies (Lipson et al. 2018; McColl et al. 2018; Kutanan et al. 2017; Liu et al. 2020).
Previous genetic and linguistic evidence suggested heterogeneity of the Thai AA people (Xu et al. 2010; Kampuansai et al. 2017; Kutanan et al. 2017; Eberhard et al. 2020) but further genetic groupings have not yet been investigated. We obtained data for 11 AA speaking populations which can be clustered into four linguistic groups: Monic branch (Mon); Khmuic branch (HtinMal, HtinPray, Mlabri, and Khmu); Katuic branch (Soa and Bru); and Palaungic branch (Lawa_Eastern, Lawa_Western, Palaung and Blang) (Diffloth 2005; Sidwell 2014). However, based on the PCA (fig. 2B), the Thai AA speaking groups can be roughly divided into three groups: Palaungic_AA (Lawa_Western, Lawa_Eastern, Palaung and Blang; #10–13); Khmu_Katu_AA (Khmu, HtinPray, HtinMal, Mlabri, Soa and Bru; #14–19); and Monic_AA (Mon; #20). The ADMIXTURE results at K = 5 also indicated that the AA-speaking groups can be clustered into three groups: the Palaungic_AA group exhibits two major sources (blue and purple) with the black component as a minor source; the Monic_AA group possesses the pink component; and the Khmu_Katu_AA group has a reduced frequency of the purple component (fig. 2C).
To further investigate the genetic structure of AA groups, we carried out haplotype-based analyses, namely ChromoPainter and sharing of segments that are identical by descent (IBD) (fig. 4; supplementary figs. 7–9, Supplementary Material online). These revealed some finer structure within the AA groups: the Mon_AA group shows excess sharing with Indian donors (discussed in more detail below); Khmu_Katu_AA groups show strong intragroup sharing but less sharing with other groups except for between the Soa and most NE_TK groups; and Palaungic_AA groups show various sharing patterns, for example, a broad sharing profile of the Blang with several other groups versus strong self-painting only of the Palaung, and strong sharing among the Lawa_Eastern, Lawa_Western, Karen_ST groups, and TK-speaking Shan.
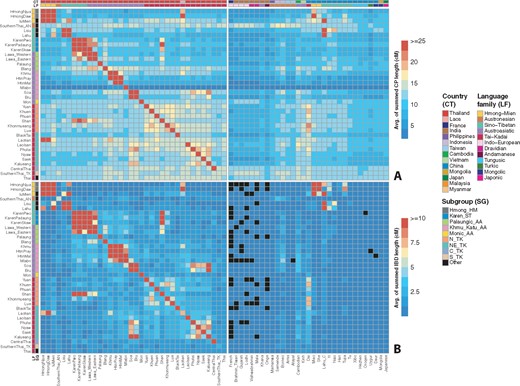
Haplotype sharing profiles as inferred by the ChromoPainter and IBD analyses. The color bars at the top denote the countries and language families while the color bars at the left denote countries and subgroups, according to the keys. (A) Heatmap of ChromoPainter results in which the recipient Y (Thai/Lao groups) is painted by donor X (Thai/Lao and other modern Asian populations), with Y denoted by each row and X denoted by each column. The heatmap is scaled by the average length in centimorgans of the summed painted chromosomal chunks of the recipient individuals from the donor individuals. (B) Heatmap of IBD sharing among Thai/Lao comparisons and between Thai/Lao and other modern Asian populations. The heatmap is scaled by the average length in centimorgans of summed IBD blocks shared between individuals from the two groups. Black blocks denote missing values.
We next computed f4-statistics of the form f4(group 1, group 2; group 3, Mbuti), where group 1 and group 2 are different AA groups while group 3 is from a different language family/subgroup. By convention, a Z-score > 3 or < −3 indicates that group 3 shares significant excess ancestry with group 1 or 2, respectively; nonsignificant Z-scores indicate that groups 1 and 2 form a clade and share equivalent amounts of ancestry with group 3. The AA groups show a very heterogenous profile, for example, when compared to the AA-Palaung, most of the other AA groups have additional affinity to TK and AN groups (and some with the ST groups), whereas the Palaung shows excess sharing with all the other groups compared to the Mon (supplementary fig. 10A, Supplementary Material online; supplementary table 2, Supplementary Material online). Consistent with the haplotype sharing profile of the Palaungic_AA group, the Blang has a broader excess sharing with all other subgroups except for the TK-speaking Khuen, the ST-speaking Lisu, and the HM groups, and the Lawa groups seem to have additional affinity to the Khmu_Katu_AA and the Karen_ST groups (supplementary fig. 11A, Supplementary Material online; supplementary table 3, Supplementary Material online). However, within the Khmu_Katu_AA group, the Khmuic branch groups tend to show excess sharing with the Palaungic_AA and the ST groups compared to the Katuic branch groups (supplementary fig. 11B, Supplementary Material online; supplementary table 3, Supplementary Material online).
We further investigated the groupings among AA Thai/Lao groups by f4-statistics of the form f4(East Asian group, Han Chinese; AA Thai/Lao group, Mbuti), to see if any of the AA groups showed different affinities with any East Asian groups in comparison with Han Chinese (supplementary table 3, Supplementary Material online). Based on the allele and haplotype sharing profiles (figs. 3 and 4), we used Atayal, Dai, Cambodian, Miao, and Naxi as representative East Asian groups speaking AN, TK, AA, HM, and ST languages, respectively. The grouping among AA Thai/Lao groups was also supported by this test; the Monic_AA show excess sharing only with the Dai, while the Khmu_Katu_AA and Palaungic_AA groups are distinguished by the former sharing excess ancestry with Atayal and having no significant Z-scores with Cambodian versus Han, while the latter have no significant Z-scores with Atayal and share excess ancestry with Han when compared with Cambodian. These results suggest more AN/TK and AA related ancestry in the Khmu_Katu_AA group, and more Han related ancestry in the Palaungic_AA group.
We finally built admixture graphs using AdmixtureBayes, and then further investigated these admixture graphs with qpGraph. To begin with, we built a backbone admixture graph with the outgroup Mbuti, N_Indian, and the following representative East Asian groups: AA-speaking Cambodian, AN-speaking Atayal, TK-speaking Dai, HM-speaking Miao, and ST-speaking Naxi (fig. 5A). Another f4 test with Amis, She, and Yi as alternative AN, HM, and ST representative groups, respectively, was performed to verify that our choice of representative groups is not biased in distinguishing the fine-scale relationships within each language family (supplementary fig. 13, Supplementary Material online). In the backbone graph, the first split separates the N_Indian from the East Asian groups, then the Naxi are separated from the other groups. The ancestor of Atayal and Dai is admixed from ancestors of N_Indian and Miao with 6% and 94% ancestry, respectively. The ancestor of Cambodian is admixed with 73% ancestry from the ancestor of Dai and 27% from the ancestor of all East Asian groups. The graph of AA groups (fig. 5B) includes several admixture events, and indicates that the Khmu_Katu_AA and Palaungic_AA subgroups are more closely-related, while the Monic_AA subgroup is distinguished from these by N-Indian-related ancestry, in agreement with the results of other analyses (figs. 2 and 4A).
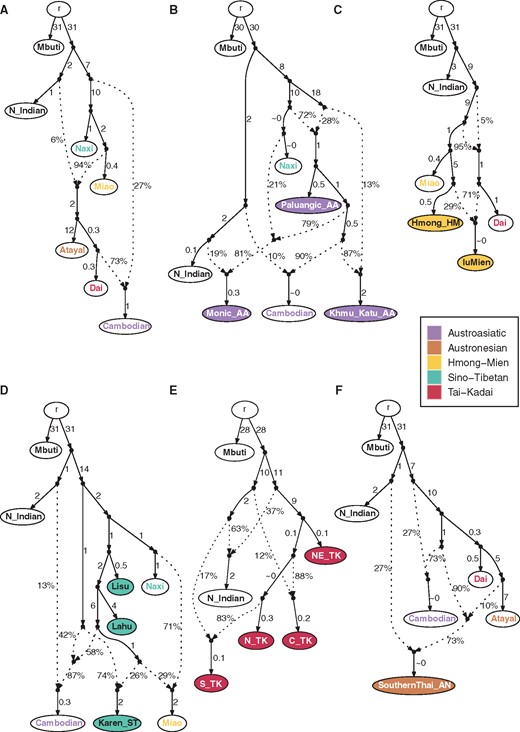
Admixture graphs for the Thai/Lao groups, for each language family. The node r denotes the root. White nodes denote backbone populations. Backbone population labels and Thai/Lao nodes are colored according to language family. Dashed arrows represent admixture edges, while solid arrows are drift edges reported in units of FST × 1,000. (A) backbone populations (worst-fitting Z = 0.861). (B) AA groups (worst-fitting Z = 2.101). (C) HM groups (worst-fitting Z = −2.028). (D) ST groups (worst-fitting Z = −2.873). (E) TK groups (worst-fitting Z = −2.270). (F) AN group (worst-fitting Z = −1.713).
Overall, the genetic evidence indicates that the Thai AA speaking populations fall into 3 primary groups: Monic_AA, Khmu_Katu_AA and Palaungic_AA (figs. 2–4; supplementary fig. 12, Supplementary Material online). The language of Mon is in the Monic branch, the sister clade of Aslian and Nicobarese, while the linguistic branch of Khmu_Katu_AA groups are Khmuic for HtinMal, HtinPray, Mlabri, and Khmu, and Katuic for Soa and Bru; the Palaungic branch includes languages of the Lawa_Eastern, Lawa_Western, Palaung, and Blang. In contrast to linguistic studies placing Khmuic and Palaungic languages in the same clade (Diffloth 2005), we find a closer relationship between populations who speak Khmuic and Katuic, which might be explained by the concept of center of gravity (Blench 2015). This idea proposes that after the Neolithic expansion of AA ancestors from southern China to MSEA, early AA speakers were concentrated along the middle Mekong in present-day northern Laos. Some groups subsequently moved westward and were the ancestors of Palaungic and Monic groups, and during this process they came into contact with different linguistic groups (e.g. Mon with Burmese ancestors, Lawa_Eastern and Lawa_Western with Karen_ST, and Palaung with ST groups from NEA), as shown by population structure and relationship analyses and f4 tests (figs. 2–4; supplementary fig. 11, Supplementary Material online; supplementary table 3, Supplementary Material online). These different contact histories would promote subsequent differentiation of the Palaungic and Monic groups from their Khmuic and Katuic ancestors. Meanwhile, the Khmuic and Katuic ancestors might have moved up and down the Mekong and had more contact with each other, thus accounting for their closer genetic relationship with each other. In this region, the Khmuic and Katuic speaking people may have also interacted with TK groups in Laos and Northeastern Thailand, promoting their genetic affinity (figs. 2B, 3, and 4; supplementary table 3, Supplementary Material online). However, some differentiation between the Khmuic and Katuic groups can be seen in the haplotype sharing (fig. 4) and ADMIXTURE results for K = 10 (supplementary fig. 6, Supplementary Material online). Additional studies of AA groups from Thailand (e.g. Pearic and Khmer speaking groups) and other MSEA countries are needed to provide more insights into the genetic structure of AA-speaking people.
Genetic Structure of the Hill Tribes
Consisting of ∼700,000 people, there are nine officially recognized hill tribes in Thailand: the AA-speaking Lawa (Lawa_Eastern and Lawa_Western), Htin (HtinMal and HtinPray) and Khmu; the HM-speaking Hmong (HmongNjua and HmongDaw) and IuMien; and the ST-speaking Karen (KarenPwo, KarenPadaung, and KarenSkaw), Lahu, Lisu, and Akha (Schliesinger 2000, 2001; Penth and Forbes 2004). Living in a remote and isolated region of Thailand, the hill tribes are of interest for their cultural variation in postmarital residence patterns, that is, patrilocality versus matrilocality (Oota et al. 2001; Besaggio et al. 2007; Kutanan et al. 2019, 2020). Most of the hill tribes are isolated from the lowlanders and from each other, which enhances genetic drift and inbreeding, as found in previous studies of autosomal STR (Kampuansai et al. 2017) and mtDNA and MSY variation (Kutanan et al. 2020).
Here, we investigated eight of the official hill tribes (all but the Akha) and the Mlabri, who are not officially regarded as a hill tribe but live in the mountainous area. All of them exhibit high within-population IBD sharing (supplementary fig. 8, Supplementary Material online), as expected given the results of previous studies that suggested high levels of isolation and strong genetic drift. The Mlabri in particular show the greatest levels by far of within-group IBD sharing, in agreement with their enhanced self-painting in the ChromoPainter analysis (fig. 4A). In the ADMIXTURE results at K = 10, four groups stand out with their own ancestry components (supplementary fig. 6, Supplementary Material online): Lahu (light green), Karen_ST (gray), Htin (Mal and Pray), Khmu (mint), and Hmong_HM (peach). In contrast, the Lawa (Eastern and Western), IuMien, and Lisu do not stand out in the ADMIXTURE analysis, and they have relatively less within group IBD sharing compared to other hill tribes (supplementary fig. 8, Supplementary Material online). This was further revealed by excess allelic sharing with many other populations in the f4 results (supplementary tables 2 and 3, Supplementary Material online) and haplotype sharing with other groups (fig. 4A; supplementary fig. 7, Supplementary Material online).
The Lawa belong to the Palaungic_AA group, which in the admixture graph for AA groups receives ancestry from the ST-Naxi (fig. 5B). We further built admixture graphs for the HM and ST hill tribes. For the HM groups (fig. 5C), there is a divergence between the Dai and a Miao-Hmong clade, while the IuMien are admixed with 29% ancestry from an ancestor of the Hmong and 71% from an ancestor of the Dai. The additional TK-related ancestry in IuMien is consistent with haplotype-sharing and f4 results (fig. 4; supplementary fig. 12, Supplementary Material online). The graph of ST groups indicates that Lisu, Lahu and Naxi form a clade, while the Karen_ST have additional Cambodian-related ancestry (fig. 5D); this AA-related admixture in the Karen is in agreement with the haplotype-sharing results (fig. 4), and the division of Lahu/Lisu versus Karen_ST groups is also supported by f4 results (supplementary fig. 10C, Supplementary Material online).
These results indicate that not all hill tribes can be characterized simply by high degrees of isolation and genetic drift; the Lawa, IuMien, and Lisu instead seem to have had more interactions with other groups, and so we will focus further discussion on these three hill tribes. The Lawa (Eastern and Western) are the native groups of northern Thailand and inhabited lowland areas before some of them moved to the highlands (Lawa_Western) while others remained in the lowlands or mid-lands (Lawa_Eastern) (Nahhas 2007). By contrast, the Karen in Thailand are refugees who claim to be the first settlers in Myanmar before the arrival of Mon and Burmese people, and moved from Myanmar beginning around 1750 A.D. due to the growing influence of the Burmese (Kuroiwa and Verkuyten 2008; Gravers 2012). The Lawa share ancestry with the Karen_ST (fig. 4; supplementary fig. 5, Supplementary Material online), in agreement with previous findings of shared MSY haplotypes (Kutanan et al. 2020). Genetic relatedness between Karen and Lawa groups was also reported in a previous genome wide study (Xu et al. 2010). In northern Thailand, Lawa and Karen had been in contact with one another since around the 13th century A.D., during the Lanna Period (Lewis and Lewis 1984). Because the languages of AA-speaking Lawa and ST-speaking Karen are different, geographic proximity along the border between northern/northwestern Thailand and Myanmar is the most likely factor that promoted admixture between these groups.
The IuMien and Hmong are descended from proto-HM groups from central and southern China (Wen et al. 2005) and are linguistically related; there is no significant sharing of ancestry between HM and non-HM groups in the f4 analyses (supplementary fig. 10B, Supplementary Material online; supplementary table 2, Supplementary Material online). However, they still behave differently in many analyses (figs. 3–5; supplementary figs. 6 and 12, Supplementary Material online). The Hmong show genetic signatures of isolation, such as higher IBD sharing within groups (supplementary fig. 8, Supplementary Material online), in agreement with a previous study of uniparental markers (Kutanan et al. 2020), whereas the IuMien show affinities not only with the Hmong but also with TK speaking groups and ST speaking Lahu from both Thailand and China (fig. 4). The differential affinities of HM groups to TK and ST groups has also been shown in two recent genome-wide studies (Liu et al 2020; Xia et al. 2019). In addition, the sharing of features between IuMien (but not Hmong_HM) and Sinitic languages (Blench 2008) indicates that IuMien similarities with other East Asian populations is evident both genetically and linguistically. The higher genetic isolation of the Hmong could reflect cultural isolation arising from a strong preference for marriage within Hmong groups, while the lower genetic isolation of the IuMien could reflect the pronounced IuMien cultural preference for adoption (Schliesinger 2000; Jonsson 2005; Besaggio et al. 2007).
The Lisu and the Lahu are originally from southern China and speak closely related languages that belong to the Loloish branch of ST (Bradley 1997). Shared genetic ancestry between Lisu and Lahu is evident in the haplotype sharing and admixture graph results (figs. 4 and 5D), although there are differences: Lisu have mixed ancestries probably due to Sinicization in southern China before movement to Thailand (Schliesinger 2000) or interactions with northern Thai lowlanders after settlement in Thailand (Penth and Forbes 2004), while the Lahu are more isolated, e.g. the ADMIXTURE result for K = 7 (supplementary fig. 6, Supplementary Material online) and the IBD sharing results (supplementary fig. 8, Supplementary Material online), in agreement with a previous study of uniparental markers (Kutanan et al. 2020). There is strong ancestry sharing between the Thai Lahu and Chinese Lahu (figs. 3 and 4), and the Chinese Lahu are moreover genetically similar to Vietnamese Lahu (Liu et al. 2020), indicating a close relationship among Lahu from MSEA and China.
Finally, though the Mlabri are not officially regarded as a hill tribe, this minority group is of interest due to their unique hunting-gathering life style, enigmatic origin, and very small census size (∼400 individuals) (Eberhard et al. 2020). The Mlabri language belongs to the Khmuic branch of AA languages that is also spoken by their neighbors, Htin (Mal and Pray subgroups) and Khmu, suggesting shared common ancestry, and oral tradition indicates that the Htin are the ancestors of the Mlabri (Oota et al. 2005). A previous genome-wide study also supported genetic affinities between the Mlabri and the HtinMal (Xu et al. 2010), while uniparental studies indicate paternal relationships among Mlabri, HtinMal, HtinPray, and Khmu and an oral tradition, versus maternal genetic relationships among Mlabri and Katuic-speaking Soa and Bru from northeastern Thailand (Kutanan et al. 2018a). Our present results also support genetic relatedness among Mlabri, Htin (Mal and Pray), Khmu, Soa, and Bru within the Khmu_Katu_AA group (fig. 2B; supplementary figs. 6 and 7, Supplementary Material online). The Mlabri, Htin, Khmu, Soa, and Bru all migrated from Laos about 100–200 years ago (Schliesinger 2000), thus close relatedness among them might reflect gene flow among various groups in Laos before their independent migrations to Thailand. However, the Mlabri stand out among these groups in exhibiting extremely high levels of within-group IBD sharing (supplementary fig. 8, Supplementary Material online), indicating strong genetic drift and isolation, consistent with previous investigations of mtDNA, Y chromosome, and autosomal diversity (Oota et al. 2005; Xu et al. 2010; Kutanan et al. 2018a). Both the small census size and recent origin within the past 1,000 years (Oota et al. 2005), combined with geographic isolation, could account for the very low genetic diversity of this group.
Differences among the Four Major TK Speaking Groups According to Geographic Region
With an origin from south/southeastern China (Sun et al. 2013; Pittayaporn 2014), the TK language family comprises around 95 languages spoken by ∼80 million people in northeast India, southern China, Vietnam, Myanmar, Cambodia, Thailand, and Laos (Eberhard et al. 2020). A common origin of TK and AN language families in southern China was suggested previously based on linguistic and genetic evidence (Thurgood 1994; Sagart 2004; Kutanan et al. 2018b; Yang et al. 2020). The TK languages spread to MSEA around 1–2 kya (Pittayaporn 2014), and previous genetic studies estimated an expansion time for TK groups ∼2 kya (Kutanan et al. 2019) and found relatedness between modern TK populations and ancient Iron Age samples (McColl et al 2018). MtDNA and MSY data indicate contrasting genetic variation and genetic differences between major TK groups in the North, Northeast, and Central regions of Thailand (Kutanan et al. 2019), suggesting different migration routes of TK groups that expanded from China. A previous genome-wide study also reported substructure of Thais in each region (Wangkumhang 2013); however, these previous studies did not investigate this substructure in detail.
In this study, we investigated one TK population from Laos and 15 TK populations from Thailand that can be grouped by geographic region: northern Thailand (N_TK), northeastern Thailand (NE_TK), Central Thailand (C_TK), and Southern Thailand (S_TK). Based on the PCA (fig. 2B), the TK groups from different geographic regions in Thailand show different relationships; the N_TK groups are close to the Palaungic_AA groups, AA-speaking Kinh, AN groups from Taiwan (#49–50) and the Philippines (#46), while the northeastern Thai TK groups (NE_TK; Black Tai, Lao Isan, Phutai, Nyaw, Saek, and Kalueang; #27 and #29-33) are close to the Khmu_Katu_AA groups. The TK speaking Laotian (#28) are grouped with the NE_TK groups. The central and southern Thai TK groups (C_TK and S_TK; CentralThai and SouthernThai_TK; #34 and #35) and Thai-HO (#36) are close to the Monic_AA groups. In accordance with the PCA results, ADMIXTURE results at K = 11 also show the different TK-speaking groups can be distinguished: the blue component is now enriched mostly in the N_TK group, the additional light brown component is enriched in the NE_TK group, and the C_TK and S_TK group possess the additional pink component as mentioned previously (supplementary fig. 6, Supplementary Material online).
Some finer structure within the Thai TK groups is revealed by ChromoPainter analysis (fig. 4A; supplementary fig. 7, Supplementary Material online): N_TK populations show strong sharing with each other and the Dai, though the Shan show additional sharing with the Lawa_Eastern and Karen_ST groups. The NE_TK groups show strong sharing with the Khmu_Katu_AA group, Cambodian, Borneo, and Dai. Notably, the Laotian show a relatively broader sharing profile and high sharing with the HM groups, whereas the BlackTai show a strong selfpainting profile. In addition to strong sharing with Khmu_Katu_AA groups, the C_TK group shows an excess sharing with the Indian donors, which is similar to the profile of Thai-HO. The S_TK group also shows a similar profile as C_TK but additional sharing with the AN-speaking Mamanwa, Borneo, and Semende, which is similar to the profile of the SouthernThai_AN (who show even stronger and broader sharing with the other AN groups).
The results of f4-statistics of the form f4(TK group 1, TK group 2; non-TK group 3, Mbuti) show that, in particular, the profiles of NE_TK and N_TK groups show strong excess sharing with each other and the HM groups, followed by ST and AA groups (supplementary fig. 11C–E, Supplementary Material online; supplementary table 3, Supplementary Material online). Many of the highest Z-scores come from comparisons involving the Laotian population (supplementary figs. 10D and 11C, Supplementary Material online; supplementary tables 2 and 3, Supplementary Material online), in agreement with their broader haplotype sharing profiles (fig. 4). In addition, we found that Thai-HO and CentralThai form a clade in all the tests (Z scores within ± 1.5), suggesting their close relationship in agreement with previous analyses (supplementary fig. 10E, Supplementary Material online; supplementary table 2, Supplementary Material online). By computing f4-statistics of the form (East Asian group, Han Chinese; Thai/Lao group, Mbuti), almost all of the Thai/Lao TK groups and the SouthernThai_AN population share excess ancestry with Atayal and Dai, share more ancestry with Han than with Cambodian or Naxi (although the SouthernThai_AN shares less excess ancestry with Cambodia than other Thai/Lao groups) and show either a slight excess sharing, or no excess sharing, with Miao (supplementary fig. 12, Supplementary Material online). These results provide further support for a genetic relationship between TK and AN groups.
Investigating the four major TK groups by an admixture graph analysis (fig. 5E), we found that the NE_TK and N_TK groups are in the same clade, and this clade contributes 88% to C_TK and 83% to S_TK. The remaining ancestry for C_TK and S_TK is contributed by Indian-related ancestry, which reflects SA-related admixture that is consistent with previous results (figs. 2 and 4A). This graph does not include any EA source populations as their inclusion leads to unacceptable graphs (worst-fitting Z = −7.037; supplementary fig. 14, Supplementary Material online), probably because the Dai have broad attraction to all the TK groups as well as Atayal and Cambodian, as most of the outlier Z-scores involve the Dai. However, this graph still provides essentially the same topology for the TK groups as in figure 5E with the N_TK now forming a clade with the Dai and Atayal while the NE_TK share more ancestry with Cambodian. To reduce complexity/redundancy in the modeling, we did not include the Thai-HO in the graph as their ethnolinguistic background is unclear and their genetic profile is very similar to C_TK (supplementary fig. 10E, Supplementary Material online; supplementary table 2, Supplementary Material online).
Overall, we find fine structure of TK groups in each geographic region (figs. 2B, 3, and 4; supplementary figs. 6 and 7, Supplementary Material online) that primarily reflects heterogeneity in admixture with local AA groups and geographic proximity. Northern Thailand is close to southern China; the N_TK groups are genetically close to the southern Chinese Dai and less mixed with local AA in the region. In contrast, Northeastern Thailand shares a border to Laos; the NE_TK groups are more related to the Khmu_Katu_AA groups that are widely distributed in Laos and recently migrated to Thailand. Central and southern Thailand share a border with Myanmar to the west; the central Thais (C_TK) and southern Thais (S_TK) have close genetic relationships with the Mon, who migrated from Myanmar. Our results indicate diversity of Thai TK populations, and so future whole genome or genome-wide studies should include a geographically representative sample of Thai TK groups, to fully capture this diversity. In addition, our results provide insights into the relationships of the Thai-HO group, which was published earlier but without any details concerning the ethnolinguistic background (Lazaridis et al. 2014). Our results show that the Thai-HO group is quite similar to the CentralThai TK group (figs. 2–4; supplementary fig. 10E, Supplementary Material online; supplementary table 2, Supplementary Material online), thus providing additional context for this group.
South Asian-Related Admixture
All of the descriptive analyses indicate South Asian (SA) related ancestry in the Mon, SouthernThai_AN, SouthernThai_TK, CentralThai, and Thai-HO (figs. 2, 4, and 5). The SA-like signal is also one of the facilitating factors that enhance the differentiation for the C_TK and S_TK versus N_TK and NE_TK groups, the Monic_AA versus Palaungic_AA and Khmu_Katu_AA groups, and the SouthernThai_AN versus other nearby AN groups (figs. 2–4; supplementary figs. 10 and 11, Supplementary Material online).
Hence, we used f4(Thai/Lao group, Han; SA Indian group, Mbuti) to verify the putative SA-related admixture. Several TK and AA Thai/Lao groups share significant excess ancestry with the AA-speaking Kharia (supplementary fig. 15, Supplementary Material online). By contrast, the Mon, SouthernThai_TK, and SouthernThai_AN share excess ancestry with every other Indian group (but not the Kharia or Onge), and they are the only Thai/Lao groups to share excess ancestry with the other Indian groups. They are also the only groups (along with CentralThai) that share less ancestry with Onge than do Han. To check this signal from ancient samples, we also performed an f4 analysis of the form f4 (ancient samples, Han; Thai/Lao groups, French), with only transversions (3,090–53,870 SNPs), to assess allele-sharing between the Thai/Lao groups and the ancient samples (supplementary fig. 16, Supplementary Material online). Most populations show no significant differences in ancestry sharing with the Hòabìnhian samples versus Han Chinese, except that the Mon and SouthernThai_TK share more alleles with Han while Blang shares more alleles with Ho-PhaFaen. Many of the Thai/Laos populations show significant ancestry sharing with most of the Neolithic samples; however, the Mon_AA, C_TK, S_TK, and SouthernThai_AN groups share excess ancestry with Han compared to the ancient samples, and this pattern becomes weaker in later periods. Taken together, these results highlight the distinctive nature of the SA-related ancestry in the Mon and southern Thai groups, compared to other Thai/Lao groups.
To further analyze the details of this putative admixture, we used the GLOBETROTTER software (Hellenthal et al. 2014), based on the output of ChromoPainter, to infer the number of admixture events, identify proxies for the admixture sources, and date admixture events. Again, to reduce redundancy in the modeling, we did not include the Thai-HO in the graph as their ethnolinguistic background is unclear and their genetic profile is very similar to C_TK (supplementary fig. 10E, Supplementary Material online; supplementary table 3, Supplementary Material online). We included Yuan in the source estimation as a control because they did not show any SA-related admixture signal but are geographically close to the other groups. For each group (including the Yuan control group), a single admixture event is inferred (fig. 6A). However, the admixture inferred for the Yuan is statistically uncertain, and the composition of sources is quite different compared to the sources inferred for the other groups: the dominant major sources are 46% from AA-speaking Kinh and 35% from TK-speaking Dai while the dominant minor sources are 4% from Indian Gujarati and 2% from ST-speaking Naxi. For the other groups, the dominant proxy for the major source is the Kinh, ranging from 45% to 63% (and 7–11% for the Dai), with the minor source from the Indian Brahmin Tiwari (10%) for the SouthernThai_TK and Gujarati (7–18%) for the rest. Apart from the dominant sources, the SouthernThai_AN are also inferred to have more AN-related (Mamanwa, Borneo, Semende, Atayal, and Amis) ancestry (19% vs. 9% in SouthernThai_TK and below 5% in the others), while the Mon have more ST-related (Lahu, Naxi, and Yi) ancestry (9% vs. below 4% in the others), in agreement with the admixture graphs (fig. 5).
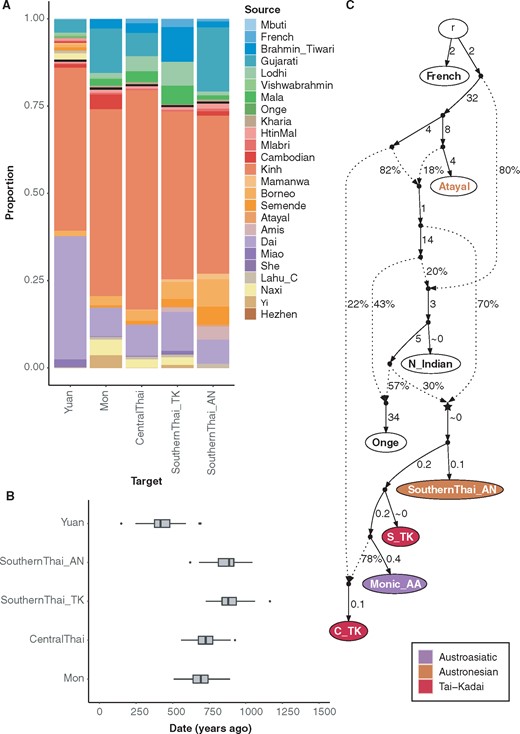
Investigation of putative SA-related admixture. (A) GLOBETROTTER estimation of admixture sources for four Thai groups (Mon, Central Thai, SouthernThai_TK, and SouthernThai_AN) with putative SA-related ancestry, and for the Yuan group as a control without putative SA-related ancestry. Different sources are denoted by different colors. (B) GLOBETROTTER estimates of the admixture date in the SA-influenced Thai groups. Results are based on 100 bootstraps. (C) Admixture graph for the Thai groups with SA-related admixture (worst-fitting Z = −1.646). The node r denotes the root. White nodes denote backbone populations. The star-shaped node denotes the N_Indian-related source contributing to all of the SA-related Thai groups. Backbone population labels and Thai nodes are colored according to language family. Dashed arrows represent admixture edges, while solid arrows are drift edges reported in units of FST × 1,000.
We next estimated the admixture dates using GLOBETROTTER; these range between 600 and 900 ya for the SA-related populations with the dates for both southern Thai populations tending to be older than those for the other groups (fig. 6B). We also estimated the admixture date for the Yuan even though the admixture is uncertain; a much younger date was inferred (∼400 ya). We also used another admixture dating software, ALDER, that is based on the decay of linkage disequilibrium (LD) (supplementary fig. 17, Supplementary Material online), which gave results overall falling in a similar time range with a slightly younger distribution of dates (500–750 ya). We used the most dominant major (Kinh) and minor (Gujarati) sources inferred by GLOBETROTTER as sources for ALDER. However, the LD decay curves of all the groups could not be fitted with the Kinh LD curve, while the Gujarati LD curve provided a fit for the SA-related groups but not for the Yuan. The ALDER dating was therefore carried out using just the Gujarati LD curve.
We also investigated this with admixture graphs. Considering the possible events that might be revealed with ancient samples included, we began with a maximum-likelihood tree inferred by TreeMix with Mbuti (as the outgroup), French, South Asians (N_Indian and Onge), representative East Asian groups (same as mentioned above), ancient samples with more than 130,000 overlapping SNPs (<65% missing data; these are Ho-PhaFaen, N-TamPaLing, N-GuaChaCave, IA-LongLongRak, and Hi-Kinabatagan), and Thai/Lao groups. The N_Indian, TK, AA, Hmong_HM, and Karen_ST groups were grouped based on linguistic classification and ChromoPainter results (see Materials and Methods). The overall topologies with and without migration are similar, except for shifts involving a few groups (supplementary fig. 18A, Supplementary Material online). The SouthernThai_AN, S_TK, Monic_AA, C_TK, and Thai-HO, together with the ancient samples, fall outside a clade containing the remaining Thai/Lao groups and the representative East Asian groups. The standard error of the residuals decreases from 15.6 to 12.3 when adding three migration events (supplementary fig. 18B, Supplementary Material online) and all groups from the same language family now form a clade except that the Karen_ST is placed in the AA clade together with Neolithic/Iron Age samples (N-GuaChaCave, N-TamPaLing, and IA-LongLongRak); the AN-speaking Atayal falls in the TK clade; and the Southern Thai_AN is placed in between the Hòabìnhian-related Onge/Ho-PhaFaen and the historical Hi-Kinabatagan samples. Three migrations were inferred: one from N_Indian to Mon_AA and IA-LongLongRak; one from the ancestor of all samples after the divergence of N_Indian and French to S_TK, C_TK, and Thai-HO; and one from the Hòabìnhian sample to the Neolithic samples.
Finally, we built an specific admixture graph for the Thai groups with inferred SA-related ancestry (fig. 6C). We included for comparison French (as the outgroup), N_Indian, and Onge to investigate if the SA-related source is most similar to European, northern Indian, or southern Indian ancestries, and we also included Atayal as a source of East Asian ancestry. An acceptable graph (worst-fitting Z = −1.646) indicates that the SA-related ancestry traces back to a single ancestral node (the star node in fig. 6C) that contributes 30% to the ancestry of the SA-related Thai groups, which is similar to the amount of SA-related source (minor source) estimated from GLOBETROTTER (fig. 6A). The C_TK are inferred to have an additional 22% ancestry from a lineage related to Atayal, similar to other admixture graphs for TK groups (fig. 5A, supplementary fig. 14, Supplementary Material online). Inclusion of more EA source populations and using Mbuti as an outgroup does not provide an acceptable graph (worst-fitting Z = −4.110; supplementary fig. 19, Supplementary Material online) but the overall topology is consistent with that in fig. 6C. While an AA-related ancestor contributes more than 80% ancestry to the SA-related Thai groups, suggesting that they are all mainly AA-related despite some of them speaking TK or AN languages, additional ancestry comes from TK, N_Indian, and Onge sources.
SA admixture analyses indicated that the SA contribution to all Indian-related Thai groups is as a minor source (∼25%) while the main contribution comes from AA-related sources (fig. 6A). Although the CentralThai and SouthernThai_TK speak TK languages, and SouthernThai_AN speak an AN language, their genetic backgrounds are similar to AA groups (figs. 5B and 6A; supplementary fig. 19, Supplementary Material online), suggesting cultural diffusion to, or admixture with, AA groups. For the CentralThai, our previous mtDNA results showed admixture between Mon and CentralThai people, while the MSY results showed that the CentralThai were influenced by cultural diffusion from the Mon (Kutanan et al. 2018b, 2019). The SouthernThai_TK are genetically related to both the Mon and CentralThai (figs. 2 and 6C; supplementary figs. 6, 18, and 19, Supplementary Material online), consistent with historical evidence indicating that there were movements from the central region to the south during the Ayutthaya Period (during 1350–1767 A.D.) (Baker and Phongpaichit, 2017). Also living in the southern region, the SouthernThai_AN not only has SA-related ancestry, but it is also genetically distinct from AN-speaking groups from Taiwan (Amis and Atayal) and ISEA (fig. 2; supplementary fig. 18, Supplementary Material online). Similar to other SA-related groups, the SouthernThai_AN are more related to AA-speaking Cambodian and Khmu_Katu_AA groups in the PCA (fig. 2) and in the qpGraph received ancestry from a N_Indian ancestor (∼27%) and an admixed ancestor with Cambodian (∼90%) and Atayal (10%) ancestry (fig. 5B). This pattern is in agreement with the AN groups from Vietnam (Liu et al. 2020); our results support the MSEA origin of the SouthernThai_AN group, via cultural diffusion involving local AA groups.
There is archaeological evidence of frequent early prehistorical contacts between India and present-day Thailand (and Cambodia) during the Iron Age that brought exotic goods as well as ideas rooted in Buddhist and Hindu religions (Higham and Thodsarat 2012). This could result in some Indian admixture in the local AA groups who then subsequently changed languages as a result of admixture or cultural diffusion involving arriving TK/AN groups. However, the dating of the Indian admixture in the Thai groups is more recent, ∼500–750 ya (fig. 6B; supplementary fig. 17, Supplementary Material online), which fits with the Ayutthaya Period (Baker and Phongpaichit 2017). During the 16th to 17th century A.D., Siam (the former name for what is now the kingdom of Thailand) had maritime connections with westward trade dominated by Persians, Indians, Chinese, and other nationalities who sailed from various Indian ports via the Melaka Straits or passed via Burmese ports to Ayutthaya (Baker and Phongpaichit 2017; Ruangsilp and Wibulsilp 2017). Trading and political connections—Indian Muslims served in administration (Chularatana 2007)—would have facilitated admixture from South Asian to central Thai people (probably related to the Mon) during the Ayutthaya Period. As mentioned previously, this is also the time period of historical movements from the central region to the south, which could immediately bring the SA admixture to southern Thais (TK and AN). Alternatively, many ports in southern Thailand were also part of the international trade network, so the South Asian admixture in the southern Thais (TK and AN) probably also reflects this process. Europeans, for example, Portuguese, were also an important part of this transnational network (Baker and Phongpaichit 2017), but our results do not indicate any European genetic influence (figs. 2C and 6C; supplementary fig. 6, Supplementary Material online). Finally, a single-pulse admixture is inferred by GLOBETROTTER, which is supported by the admixture graph (fig. 6C; supplementary fig. 19, Supplementary Material online). Although this suggests a strong SA admixture signal into AA genetically related groups during the Ayutthaya Period, we cannot rule out the possibility of extensive and continuous interaction between South Asian and Mainland Southeast Asian in the past. More ancient DNA data from this region could provide further insights into this SA-MSEA interaction as well as the historical relationships among AA, TK, and AN groups in MSEA.
Conclusions
We generated and analyzed an extensive and intensive genome-wide SNP data set from 36 ethnolinguistic groups from Thailand and Laos encompassing all five language families in MSEA, that is, TK, AA, ST, HM, and AN languages. We observed fine-scale genetic structure within each language family; interactions between AA and TK speakers are the principal factor influencing the population structure of the major TK speaking groups in each region. Interactions with South Asians is also evident in the genetic profiles of the Monic_AA, Central and Southern Thai_TK, and SouthernThai_AN groups. We also find genetic differences among ethnolinguistic groups within the ST and HM families, as well as among the hill tribes, that reflect different levels of contact with other groups. We observed genetic differentiation of the Thai and Taiwanese AN groups; genetic interactions between AN and AA groups in Thailand probably reflect cultural diffusion. Although our analyses provide the first detailed insights into the genetic history of Thai/Lao groups, further studies that include diverse modern groups from other MSEA countries, and more ancient samples, will provide even more insights into the demographic history of MSEA. In 2019, the Genomics Thailand Initiative was launched by the Thai government, with the goal of sequencing the genomes of 50,000 Thai people to enable precision medicine, and the project is ongoing. Our insights into the genetic structure of Thai/Lao ethnolinguistic groups should prove beneficial for selecting populations to include in such whole genome sequence and other biomedical studies.
Materials and Methods
Sample Preparation and Quality Control
Genomic DNA samples were from our previous studies (Kutanan et al. 2017, 2018b; 2020) (fig. 1), with the exception of newly collected samples from southern Thailand (SouthernThai_TK and SouthernThai_AN). In our previous studies, we interviewed all potential donors to screen for volunteers unrelated for at least two generations. We then collected blood, buccal or saliva samples with informed consent, which specified that their biological samples will also be stored for further anthropological genetic studies. For the present study, we used the same criteria as in the previous studies to recruit prospective donors from southern Thailand. Buccal samples were collected with written informed consent, and we extracted DNA using the Gentra Puregene Buccal Cell Kit (Qiagen, Germany) according to the manufacturer’s directions. Ethical approval for this study was granted by Khon Kaen University and by the Ethics Commission of the University of Leipzig Medical Faculty.
Genotyping was carried out using the Affymetrix Axiom Genome-Wide Human Origins array (Patterson et al. 2012); primary screening with the Affymetrix Genotyping Console v4.2 resulted in a total of 463 samples (genotype call rate ≥ 97%) genotyped for 596,085 loci on the hg19 version of the human reference genome coordinates.
We used PLINK version 1.90b5.2 (Purcell et al. 2007) to exclude loci and individuals with more than 5% missing data and also exclude mtDNA and sex chromosome loci. We further excluded loci which did not pass the Hardy–Weinberg equilibrium test (P value <0.00005), or had more than 50% missing data, within any population. We checked individual relatedness using KING (Manichaikul et al. 2010) implemented in PLINK version 2.0 (https://www.cog-genomics.org/plink/2.0/; last accessed May 8, 2020) and excluded one individual from each pair of individuals with first degree kinship. There are in total 452 Thai/Lao individuals with 533,705 loci after these quality control measures (supplementary table 1, Supplementary Material online).
We merged our data with data generated using the same array from modern populations from South Asia, East Asia, and outgroup populations (the African Mbuti and European French) (Patterson et al. 2012; Lazaridis et al. 2014; Qin and Stoneking, 2015; Lipson et al. 2018) using mergeit in EIGENSOFT version 7.2.1 with default settings (Patterson et al. 2006). The data on ancient samples from previous studies (Lipson et al. 2018; McColl et al. 2018) were retrieved with all information included and their alleles were obtained through pseudo-haploid strategies. We excluded ancient samples with less than 15,000 informative loci; the number of loci after data merging is 370,732.
Population Structure Analyses
For population structure analyses, PLINK version 1.90b5.2 was used to perform pruning for linkage disequilibrium, excluding one variant from pairs with r2 > 0.4 within windows of 200 variants and a step size of 25 variants, leaving in total 158,772 loci (153,191 loci when Mbuti and French are excluded). The Principal Component Analysis (PCA) was performed using smartpca from EIGENSOFT with the “lsqproject” and “autoshrink” options, with Mbuti and French excluded to focus on the structure among Asians. Three samples were identified as outliers based on the first 4 PCs and were removed (supplementary fig. 2, Supplementary Material online). The clustering program ADMIXTURE version 1.3.0 (Alexander et al. 2009) was run from K = 2 to K = 15 with 100 replicates for each K and with random seeds with the -P option. The ancient samples and highly drifted modern populations (Onge, Mlabri, and Mamanwa) were projected in the PCA and ADMIXTURE analyses. PONG version 1.4.7 (Behr et al. 2016) was used to visualize the top 20 highest likelihood ADMIXTURE replicates for the major mode at each K.
Allele Sharing Analyses
To test admixture and excess ancestry sharing, we computed f3 and f4-statistics from ADMIXTOOLS version 5.1 (Patterson et al. 2012) using admixr version 0.7.1 (Petr et al. 2019), with significance assessed through block jackknife resampling across the genome and using Mbuti as the outgroup. Additional f4-statistics were computed using French as the outgroup to avoid deep attraction to Africans if ancient samples were involved, and only transversions (3,090–53,870 SNPs depending on the quality of samples) were used to avoid potential noise from ancient DNA damage patterns. The heatmap visualization of f3 profiles was obtained using the pheatmap package in R version 3.6.0.
Data Phasing and Haplotype Sharing Analyses
To analyze haplotype sharing, we begin with data phasing; SHAPEIT version 4.1.3 (Delaneau et al. 2019) was used to phase the modern samples, with East Asian (without the Kinh Vietnamese merged in our data set) and South Asian populations as a reference panel, and the recombination map from the 1000 Genomes Phase3 (1000 Genomes Project Consortium et al. 2015). To prepare the reference panel, we extracted the East and South Asian individuals as well as the overlapping sites with our data for each chromosome from the 1000 Genomes Phase3 data using bcftools version 1.4 (http://samtools.github.io/bcftools/; last accessed 10 July, 2020). The phasing accuracy of SHAPEIT4 can be enhanced by increasing the number of conditioning neighbors in the Positional Burrows–Wheeler Transform (PBWT) on which haplotype estimation is based (Delaneau et al. 2019). We ran phasing with the options –pbwt-depth 8 for 8 conditioning neighbors and left other parameters as default.
We then ran ChromoPainter version 2 (Lawson et al. 2012) on the phased data set to begin the haplotype sharing investigation, with sample sizes for each population randomly down-sampled to 4 and 8. The former was used for 10 iterations of the EM (expectation maximization) process to estimate the switch rate and global mutation probability, while the latter was for the chromosomal painting process with the estimated switch and global mutation rates, which then gave the output for downstream analyses. We first attempted to paint the chromosomes of each individual, using all of the modern Asian samples as both donors and recipients via the -a argument. The EM estimation of switch rate and global mutation probability were ∼623.09 and ∼0.0013, respectively, which were then used as the starting values for these parameters for all donors in the painting process. To minimize the effect of genetic drift in the Thai/Lao groups, we also performed another run using all the modern Asian samples except for those sampled in this study as both donors and recipients; samples from this study were used only as recipients. The EM estimation of switch rate and global mutation probability for this analysis were ∼764.56 and ∼0.0011, respectively. The heatmap results were generated using the pheatmap package in R.
To identify shared IBD blocks between each pair of individuals and homozygous-by-descent (HBD) blocks within each individual, we used refinedIBD (Browning and Browning 2013). Both identified IBD and HBD blocks are considered as IBD blocks in our analyses, which is analogous to pairwise shared coalescence (PSC) segments in a previous study (Al-Asadi et al. 2019). The IBD blocks within a 0.6 cM gap were merged using the program merge-ibd-segments from BEAGLE utilities (Browning and Browning 2007; Browning et al. 2018), allowing only 1 inconsistent genotype between the gap and block regions. These results were used to generate four data sets based on the identified IBD blocks lengths: 1–5 cM, 5–10 cM, over 10 cM, and at least 2 cM. We used the first three data sets for analysis of the IBD sharing between populations by network visualization in different time periods (Ralph and Coop 2013; Al-Asadi et al. 2019), while the last one was used to analyze overall IBD sharing between populations by heatmap and IBD sharing within each individual population (Browning and Browning 2015; Browning et al. 2018). In each data set, we summed up the total number and length of IBD blocks for each individual pair and calculated the population median and mean. The pairs with at least 0.5 average number (i.e. on average half of the pair groups share IBD blocks; 2 for the range of 1 to 5 cM) of shared blocks were kept to reduce noise and false positives in network visualization.
Admixture Source and Date Inferences
For the populations with apparent Indian admixture, we ran GLOBETROTTER (Hellenthal et al. 2014) using the ChromoPainter results with only Thai/Lao samples in this study as recipients and all the donors as surrogates. We first tested the certainty and potential waves of admixture events, and then estimated the major and minor sources as well as the dates of admixture. The distributions of admixture dates were accessed through 100 bootstraps. We also dated admixture events with ALDER (Loh et al. 2013) using the populations identified as the major (Kinh) and minor (Gujarati) sources in the GLOBETROTTER analysis as the two sources used to date the admixture in the ALDER analysis. However, we could not get an acceptable fit of the LD decay curves between Kinh and all the tested groups, so we present the dates inferred using Gujarati as a single source instead. Again, genetic map information was retrieved from 1000 Genomes Phase3 data (1000 Genomes Project Consortium et al. 2015).
Admixture Graph Analyses
Using the pruned data set (18,310 SNPs) of the Thai/Lao and other reference modern populations (based on ChromoPainter results) and ancient samples (with more than 130,000 overlapping SNPs, corresponding to < 65% missing data), TreeMix version 1.12 (Pickrell and Pritchard 2012) was used to construct a maximum-likelihood tree in order to reveal population relationships and migration among five ancient samples (Ho-PhaFaen, N-GuaChaCave, N-TamPaLing, IA-LongLongRak and Hi-Kinabatagan), Thai/Lao modern populations, and selected reference modern populations, that is, the African Mbuti (used as outgroup), European French, Indo-European-speaking Indian groups (Gujarati, Brahmin Tiwari, and Lodhi), Andamanese Onge, and East Asian groups from the five different language families (AA-speaking Cambodian, TK-speaking Dai, AN-speaking Atayal, ST-speaking Naxi, and HM-speaking Miao). The Indo-European-speaking Indian groups were together labeled as N_Indian as they are enriched for the “North Indian” ancestry component identified previously, whereas Onge are enriched for “South Indian” ancestry (Reich et al. 2009). Based on ChromoPainter results, the AA Thai groups were further grouped into Monic_AA (Mon), Khmu_Katu_AA (HtinMal, HtinPray, Mlabri, Khmu, So, and Bru) and Palaungic_AA (Lawa_Eastern, Lawa_Western, Palaung, and Blang); the TK Thai/Lao groups were grouped into N_TK (Khonmueang, Shan, Khuen, Lue, Phuan, and Yuan), NE_TK (Black Tai, LaoIsan, Phutai, Nyaw, Kalueang and Laotian), C_TK (CentralThai), and S_TK (SouthernThai_TK); the HmongNjua and HmongDaw were grouped into Hmong_HM; and the KarenPwo, KarenPadaung, and KarenSkaw were grouped into Karen_ST. We investigated 0–3 migration events using 10 independent runs and then selected the topology with the highest likelihood for further investigation. To model admixture graphs, we used AdmixtureBayes (Nielsen 2018) to estimate the top 10 posterior admixture graphs for Thai/Lao groups from each language family and comparative modern populations (including the associated linguistic source groups, N_Indian group, and outgroup Mbuti), based on the covariance of the allele frequency profiles. We also performed an additional investigation of the potential South Asian genetic influence on some Thai groups (Mon, C_TK, S_TK, SouthernThai_AN), including Mbuti, French, N_Indian, Onge, and the associated linguistic source groups to disentangle potential East Asian versus South Indian/Hoabihian (Onge) versus North Indian (N_Indian) versus European (French) ancestry. Each case study graph was inferred from an independent pruned data set with 175,578–191,384 SNPs, depending on the number of groups/individuals. For each AdmixtureBayes run, a total of 300,000 MCMC steps were carried out, stopping the run if the summaries of effective sample size were all above 200. Finally, we used the estimated graphs from AdmixtureBayes as input for qpGraph from ADMIXTOOLS to test the goodness of fit of the graphs. Acceptable graphs have, by convention, an absolute value of the Z-score of the worst f4 statistic <3. If none of the estimated graphs from AdmixtureBayes produced an acceptable graph, we removed populations based on the f4 outliers output of qpGraph, used the option “-subnodes” in AdmixtureBayes, and ran qpGraph again. We iterated these procedures until we were able to find an acceptable graph. The qpGraph parameters are as follows: outpop: NULL, blgsize: 0.05, forcezmode: YES, diag: 0.0001, bigiter: 6, hires: YES, and lambdascale: 1.
Supplementary Material
Supplementary data are available at Molecular Biology and Evolution online.
Data availability
Data are made available upon receipt of a signed letter to the corresponding authors confirming that the data will only be used in accordance with the restrictions of the informed consent, including the following: the data will not be transferred to anyone else; the data will be used only for genetic/anthropological studies but not for health or disease-related studies or for any commercial purpose; and no attempt will be made to identify any of the sample donors.
Acknowledgments
We thank all sample donors for making this work possible. We acknowledge Khamnikone Sipaseuth, Saksuriya Triyarach, Narongdech Mahasirikul, Supada Khonyoung, and Dusit Boonmekam for assistance in collecting samples. We thank Roland Schröder for technical assistance. We thank Sandra Oliveira and Irina Pugach for helpful advice concerning computational analyses. J.K. acknowledges partial support provided by Chiang Mai University. L.A. acknowledges financial support from the European Research Council (grant agreement No. 818854—SAPPHIRE). This study was supported by the Max Planck Society and the Thailand Research Fund (RSA6180058).
Author Contributions
W.K. and M.S. conceived and designed the project; W.K., R.S., M.Sr., S.R., S.Sa., P.P., S.S., and J.K. collected samples; W.K. and L.A. generated data; W.K. and D.L. carried out the data analyses; W.K., D.L., and M.S. wrote the article with input from all coauthors.
References
1000 Genomes Project Consortium,
Author notes
Wibhu Kutanan and Dang Liu authors are co-first authors and contributed equally to this work.
