


Abstract
Transposable elements (TEs) make up a significant portion of eukaryotic genomes and are important drivers of genome evolution. However, the extent to which TEs affect gene expression variation on a genome-wide scale in comparison with other types of variants is still unclear. We characterized TE insertion polymorphisms and their association with gene expression in 124 whole-genome sequences from a single population of Capsella grandiflora, and contrasted this with the effects of single nucleotide polymorphisms (SNPs). Population frequency of insertions was negatively correlated with distance to genes, as well as density of conserved noncoding elements, suggesting that the negative effects of TEs on gene regulation are important in limiting their abundance. Rare TE variants strongly influence gene expression variation, predominantly through downregulation. In contrast, rare SNPs contribute equally to up- and down-regulation, but have a weaker individual effect than TEs. An expression quantitative trait loci (eQTL) analysis shows that a greater proportion of common TEs are eQTLs as opposed to common SNPs, and a third of the genes with TE eQTLs do not have SNP eQTLs. In contrast with rare TE insertions, common insertions are more likely to increase expression, consistent with recent models of cis-regulatory evolution favoring enhancer alleles. Taken together, these results imply that TEs are a significant contributor to gene expression variation and are individually more likely than rare SNPs to cause extreme changes in gene expression.
Introduction
A key goal in evolutionary genetics is to understand the factors maintaining genetic variation in populations. With the advent of whole genome sequencing technologies, our ability to characterize the genetic basis of phenotypic variation has enabled new insights into this goal. The vast majority of studies examining the genetic basis of traits have focused on the influence of single nucleotide polymorphisms (SNPs), which in most populations are the most abundant class of variant and easiest to characterize using short-read whole genome sequencing (Atwell et al. 2010; Burke et al. 2014; Visscher et al. 2017). However, despite their numbers, SNPs are also likely to have relatively small individual effects compared with larger structural variants such as large insertions, duplications, deletions, and rearrangement events, since they only affect the sequence of a single base pair of DNA (Chiang et al. 2017). Consistent with the potential importance of structural variants, a recent study in humans suggested that, despite representing considerably less than 1% of called variants, structural variants appear to be causal at about 5% of expression quantitative trait loci (eQTLs), and they have larger effect sizes compared with SNPs (Chiang et al. 2017). Transposable elements (TEs), an important type of structural variation, have been shown to mediate large phenotypic changes in a number of cases (Daborn et al. 2002; Schlenke and Begun 2004; Butelli et al. 2012; Carrier et al. 2012; Van’t Hof et al. 2016). However, little is known about the relative role of TE versus SNP variation on phenotypic variation.
Gene expression variation is a major contributor to phenotypic variation, leading to a growing interest in identifying genetic variants affecting expression (Brem and Kruglyak 2005; Massouras et al. 2012; Battle et al. 2014; Josephs et al. 2015; GTEx Consortium et al. 2017). There is increasing evidence for a major role of rare variants in the maintenance of expression variation, suggesting that a large fraction of expression variation may be maintained by a balance between new mutations introducing genetic variation and the action of purifying selection on expression removing these variants (Zhao et al. 2016; Kremling et al. 2018; Hernandez RD, Uricchio LH, Hartman K, Ye C, Dahl A, Zaitlen N, unpublished data, https://www.biorxiv.org/content/10.1101/219238v3, last accessed: april 28, 2019). However, the relative role of different classes of genetic variants, and the overall importance of rare versus common variants in maintaining expression variation remains highly debated (Montgomery et al. 2011; Li et al. 2017). Furthermore, recent modeling has also generated a novel prediction about gene expression variation: new expression-increasing mutations may spread through populations through a “runaway” process, whereby such alleles tend to end up linked to gene variants with low deleterious mutations (Fyon et al. 2015). This model would predict that new derived mutations that increase cis-regulatory expression should be at higher population frequencies than those mutations that decrease expression, since they are more likely to be favored through the enhancer runaway process. Overall, the nature of fitness effects of new expression-modifying mutations remains poorly understood.
TEs may be a significant source of genetic variation for gene expression. TE insertions can disrupt gene regulatory elements (Cridland et al. 2015), host-induced TE methylation can silence nearby genes (Hollister et al. 2011; Wang et al. 2013; Quadrana et al. 2016; Lee and Karpen 2017), but TEs can also contribute new regulatory elements leading to increased expression of nearby genes (González et al. 2008; Emera et al. 2012). In general, genome-wide studies in several model organisms have found that TE insertions are significantly associated with changes in nearby gene expression, with a predominantly dampening effect in Drosophila (Cridland et al. 2015), and a more balanced up- and down-regulating effect in Arabidopsis (Quadrana et al. 2016; Stuart et al. 2016). These studies suggest that TEs may contribute in important ways to heritable variation in expression in addition to SNPs; however there is still a lack of comparison between the effect of TE versus SNP variation in the same population.
A genome-wide survey of eQTL loci from a single large population of the self-incompatible outcrossing plant Capsella grandiflora showed approximately a third of genes are associated with local eQTLs (those present within 5 kb of the gene), and SNPs associated with expression differences show evidence for being under purifying selection (Josephs et al. 2015). However, Josephs et al. examined only common SNPs minor allele frequency (MAF >5%), and the role of other classes of variants in driving expression variation remains unclear. The large effective population size of C. grandiflora and low population structure in this species (Foxe et al. 2009; St. Onge et al. 2011), combined with Josephs et al.’s (2015) results, suggest that it is a promising species to investigate the role of TEs in shaping intraspecific expression variation. Recent work using a pooled sequencing analysis with this dataset also shows evidence that TE insertions near genes targeted by siRNAs are subject to greater purifying selection, suggestive of the importance of TE silencing as a mechanism of selection against TEs (Horvath and Slotte 2017). Although these results are suggestive, the relative role of SNPs versus TE activity in maintaining expression variation remains uncertain.
In this study, we examined TE polymorphism and its effects on expression variation using the same population studied by Josephs et al. (2015). We identified insertions across all individuals and explored the relationship between TE population frequency, rates of crossing over, and the density of coding sites and noncoding conserved sequences. We next tested the effect of TEs on gene expression variation using genome-wide expression data, and compared the relative contribution of TEs and SNPs to gene expression variation.
Results and Discussion
We combined TE calls from 124 C. grandiflora plants using the RelocaTE2 pipeline, which detects reference and nonreference TE insertions in individuals using split-reads and discordant reads (Chen et al. 2017). We created a custom TE library to capture insertions with recent activity (see Material and Methods for details), resulting in 2,900 TEs with a superfamily distribution similar to a previous Capsellarubella TE library and the Arabidopsis thaliana TE library (supplementary table S2, Supplementary Material online; Slotte et al. 2013). In total, we found 95,740 TEs in the population, which had at least one supporting split-read upstream and downstream of the insertion. We detected an average of 2,468 insertions and a median of 2,675 insertions per individual (range of 497–3,131). The frequency spectrum of TEs in the population shows a major skew toward low-frequency insertions compared with 4-fold degenerate SNPs, with a strong enrichment of insertions present in only one individual (fig. 1A). The trend of mostly low-frequency insertions is consistent with observations from other organisms and suggests there is strong negative selection acting against TEs (Novick et al. 2011; Tian et al. 2012; Cridland et al. 2013; Quadrana et al. 2016; Stuart et al. 2016; Laricchia et al. 2017).
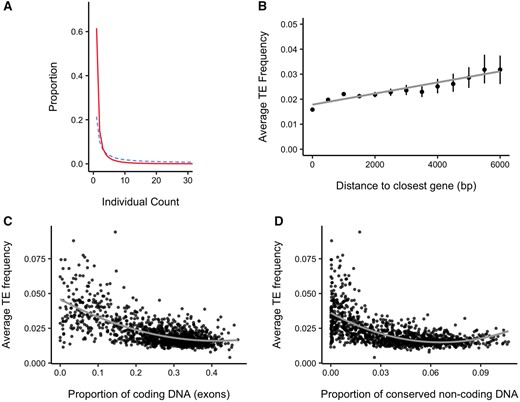
Patterns of TE insertion frequency from population data. (A) Frequency spectrum of TEs (full line) and 4-fold SNPs (dashed line). (B) Relationship between TE frequency and distance to the closest gene. The first point represents the average frequency of all TEs which are within a protein-coding gene. Subsequent points average the frequency of all TEs in 500 bp windows from the closest gene. Error lines are bootstrap confidence limits from the mean_cl_boot() function in ggplot2 (Wickham 2016). The gray line shows a linear model fit through the data. (C and D) Relationship between average TE frequency and proportion of (C) coding DNA and (D) conserved noncoding sequence (CNS) in 100 kb windows across the genome. The gray curve shows a quadratic model fit. Spearman’s ρ = −0.562 in (C) and −0.619 in (D).
Selection against Gene Disruption Regulates TE Numbers
There are two main hypotheses for why TEs are deleterious in the genome: (1) they can cause ectopic recombination between two nonhomologous insertions or (2) their insertion can disrupt gene function or expression. In the first hypothesis, TEs should be more deleterious in areas of high recombination rate, under the assumption that ectopic recombination rate mirrors the homologous crossover rate. We tested this hypothesis by comparing estimates of recombination rate in bins of 100 kb across the genome to the average TE population frequency of all insertions present in that bin (supplementary fig. S5, Supplementary Material online). There is no significant correlation between TE frequency and recombination rate across the genome, suggesting ectopic recombination does not play a large role in outcrossing C. grandiflora, consistent with results from the highly selfing A. thaliana (Wright et al. 2003). Ectopic recombination is expected to be of greater importance in outcrossing species due to their higher heterozygosity; a TE is more likely to recombine nonhomologously if it does not have a homologous partner to pair with. However, there is no evidence for a larger role of ectopic recombination in this outcrossing species than in a related selfing species. Although finer-scale estimates of recombination might reveal a significant effect and it is possible that ectopic recombination rates are less correlated with rates of crossing over than is often assumed, it appears that the previously observed lack of an effect of recombination on TE abundance in A. thaliana (Wright et al. 2003) cannot be attributed to its selfing mating system.
If TEs are deleterious because they disrupt gene function, insertions should be most deleterious, and consequently at lowest population frequency, when they are located in or near genes. There is a significant positive correlation between TE frequency and distance to the closest gene in bins of 500 bp (fig. 1B and supplementary fig. S11, Supplementary Material online; Spearman’s ρ without binning points: 0.134), with the strongest effect on TEs within 1,000 bp of genes. The positive relationship between TE frequency and gene proximity suggests that TEs closer to genes experience stronger purifying selection. This result is in line with a recent publication in C. grandiflora that utilized a pooled population sequencing analysis (Horvath and Slotte 2017).
Another way to test the gene disruption hypothesis is to plot the relationship between average TE frequency and coding site density in 100 kb windows across the genome. In testing this, we found a significant negative correlation, suggesting that TEs in regions of high gene density are kept at low population frequency (fig. 1C; Spearman’s ρ: −0.562). We also evaluated the relationship between TE frequency and the density of conserved noncoding sequences (CNSs), using CNSs conserved across nine Brassicaceae species, many of which show evidence of being regulatory elements (Haudry et al. 2013). There is also a strong negative correlation between TE frequency and CNS density, implying TEs face selective pressures due to negative effects of inserting into or near regulatory elements (fig. 1D; Spearman’s ρ: −0.619). There is a potential auto-correlation between coding site density and CNS density as regulatory elements will be found close to genes. To test whether the relationship of CNS density and TE frequency can be fully explained by the correlation between genes and CNSs, we built two quadratic regression models chosen because they showed the best fit to the data. In the first model, TE frequency is predicted only by proportion of coding sites whereas in the second, the proportion of CNSs is added as an additional predictor (the latter model is shown in table 1; adjusted R2 = 0.502). Using an F-test on the two models showed the model with coding sites and CNSs explains significantly more variation than the model with coding sites alone (P < 0.0001). Similar analyses in Drosophila melanogaster show that TEs are underrepresented in CNSs compared with the rest of the genome, however, there was no difference in population frequency of TEs in or outside of CNSs (Manee et al. 2018). Our results suggest that important TE effects on genes extend not only to direct gene disruption and methylation-mediated gene silencing, but also to disruption of regulatory sequence. The effect of TEs on CNSs could be due to direct disruption of enhancers, methylation of regulatory sequence caused by TE silencing, or spatial disruption of gene regulation caused by insertions between a gene and its regulatory region leading to aberrant expression (Hirsch and Springer 2017).
Quadratic Regression Model of Average TE Frequency.
| Coefficient | Estimate | P-value |
|---|---|---|
| Proportion of coding sequences | −0.100 | <0.0001 |
| (Proportion of coding sequences)2 | 0.126 | <0.0001 |
| Proportion of CNSs | −0.236 | <0.0001 |
| (Proportion of CNSs)2 | 1.399 | 0.000381 |
| Adjusted R2 | 0.502 | <0.0001 |
| Coefficient | Estimate | P-value |
|---|---|---|
| Proportion of coding sequences | −0.100 | <0.0001 |
| (Proportion of coding sequences)2 | 0.126 | <0.0001 |
| Proportion of CNSs | −0.236 | <0.0001 |
| (Proportion of CNSs)2 | 1.399 | 0.000381 |
| Adjusted R2 | 0.502 | <0.0001 |
Note.—Model: Average TE frequency ∼ proportion of coding sequences (CSs) + (proportion of coding sequences)2 + proportion of CNSs + (proportion of CNSs)2.
TEs Contribute Significantly to Gene Expression Variation
We have shown that TEs contribute to sequence variation, mostly as rare mutations that are under stronger purifying selection near genes and regulatory regions. Given this, we next investigated the extent to which TE insertions alter gene expression and contribute to standing genetic variation. One approach for testing for the effects of rare variants on expression is to ask whether individuals with extreme gene expression levels often carry TE insertions near these genes, as would be expected if there is a greater burden of rare TE insertions at the phenotypic extremes. To conduct this test, individual genes are sorted into expression rank bins (first bin is the individual with the lowest expression in the population for the chosen gene, last bin is the individual with the highest expression), and then the total number of all local rare variants is plotted for all genes in all individuals. If rare variants cause a change in gene expression, either an increase or decrease, then this will result in a parabolic shape because the lowest and/or highest expressed haplotypes in the population will harbor greater numbers of rare variants compared with the average haplotype in the population (Zhao et al. 2016).
To facilitate later comparison with SNP data, we used 109 individuals which passed TE, expression, and SNP quality filters. Using all TEs with an MAF <3% and within 500 bp of a gene, we found that individuals with more TEs near a gene are more likely to have extreme expression values than individuals without a nearby TE, and TEs appear to have a strong effect on decreasing gene expression and a weaker effect of increasing expression at the extremes (fig. 2A;R2 = 0.450). As a null control, we permuted mutation count and expression rank; as expected, permutations show no significant correlation, demonstrating the significance of our observed effect (supplementary fig. S6, Supplementary Material online). This general result suggests that TEs do contribute to expression variation and that TE silencing and gene disruption effects may be more common than TE-mediated upregulation. This result contrasts with a recent analysis in A. thaliana, where TE insertions driving increased expression appeared to be as prevalent as expression-decreasing effects (Quadrana et al. 2016, but see Stuart et al. 2016).
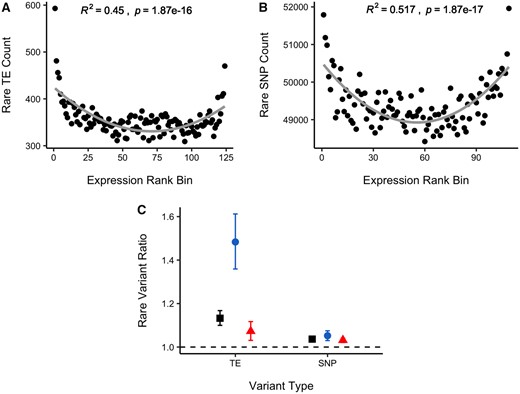
Relationship between (A) TE and (B) SNP count and gene expression rank bin for all rare variants (MAF <3%) within 500 bp of a gene. The gray curve shows a quadratic model fit. (C) Ratio of average number of rare variants in expression outliers relative to nonoutliers for TEs and SNPs. Square—all outliers; circle—expression-decreasing outliers; triangle—expression-increasing outliers. We ran 1,000 permutations of the data to obtain normal distributions of the ratio statistic, and in all cases the observed statistic fell outside of the permuted distribution values.
Although TEs appear to strongly downregulate gene expression, it is difficult from such an analysis to directly quantify the strength of the effect. We used a complementary statistical approach by calculating the ratio of the average number of TE insertions across genes in individuals that are expression outliers over the average number of TE insertions in nonexpression outliers. The ratio value for TEs is 1.13, and expression outlier individuals have significantly more TEs than nonoutlier individuals (fig. 2C; 95% quantile confidence interval: 1.10–1.17 from 1,000 bootstraps). When considering only downregulated expression outliers, the ratio of TEs in outliers versus nonoutliers is a much higher value of 1.48, consistent with the pattern observed in the burden of rare variants test (fig. 2C; 95% quantile confidence interval: 1.36–1.61 from 1,000 bootstraps). These results suggest that the standing genetic variation contributed by TEs has a significant effect on disrupting gene expression, pushing individuals to extreme expression values and that TE insertions are more likely to decrease expression than increase it.
Breaking down the results by TE type reveals large differences in the direction and type of effect that different TE types have on gene expression. Long terminal repeat (LTR) elements, which are large retrotransposons, show the strongest effect on decreasing gene expression (R2 = 0.471 under the rare variant burden test) whereas other TE types tested show significant but less pronounced effects (fig. 3, supplementary fig. S7, Supplementary Material online). LTRs are the most abundant TE type in most plant genomes, including C. grandiflora (Slotte et al. 2013; Bennetzen and Wang 2014), and often the most methylated (Ahmed et al. 2011). Methylated TEs, which have been silenced by the host genome to prevent their transcription and transposition, can have stronger effects on nearby gene expression, either through the spread of methylation past the TE or by making the chromatin less accessible to transcription factors and transcriptional machinery (Hirsch and Springer 2017). Thus, the strong effect of LTRs on decreasing gene expression may be mediated by their methylation. Future studies including sample-specific bisulfite sequencing and/or small RNA will be important to further test the mechanism of strong LTR effects on nearby gene expression.
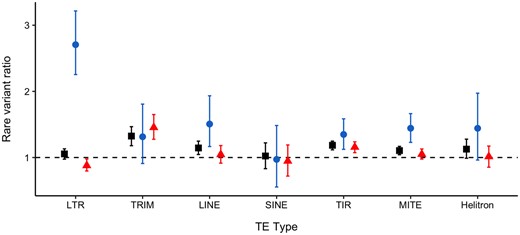
Ratio of average number of rare variants in expression outliers relative to nonoutliers for different TE types. Square—all outliers; circle—expression-decreasing outliers; triangle—expression-increasing outliers.
Genic Insertions Cause the Strongest Expression Decrease
If TEs affect gene expression by disrupting gene regulatory regions, then there should be a strong effect caused by TEs upstream of the gene. However, the strongest correlation with extreme gene expression occurred when considering TEs inserted into genes (supplementary fig. S8, Supplementary Material online; R2 = 0.524). Upstream TEs had a lower overall effect than genic insertions; interestingly they were only significantly overenriched in increased expression outliers, with no significant effect in decreased expression outliers (fig. 4). This is somewhat similar to observations in A. thaliana, where upstream insertions showed a more symmetrical effect on expression than insertions inside or downstream of genes (Stuart et al. 2016). The upstream effect was only significant for TEs within 100 bp of the transcription start site (TSS) (fig. 4, supplementary fig. S9, Supplementary Material online), consistent with previous results suggesting that the greatest abundance of upstream conserved noncoding sites (CNSs) were 200 bp away from the TSS (Haudry et al. 2013). Similarly, upstream SNP eQTLs were most abundant within 1 kb from the TSS (closer intervals were not tested) (Josephs et al. 2015). One possible explanation for the weaker and more symmetrical overall effect of insertions upstream of genes is that a major effect of TE insertions into regulatory sequence is an effect on expression noise, rather than a specific downregulation. Recent work on de novo mutational effects in regulatory regions in yeast (Metzger et al. 2016) suggests many more mutations have an effect on the variance in gene expression than on the expression mean. Testing whether TEs increase variance in gene expression is difficult to implement with rare insertions, however below we examine this possibility with common TEs.
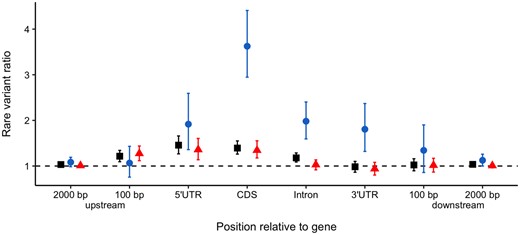
Ratio of average number of rare variants in expression outliers relative to nonoutliers for TEs upstream of, in, and downstream of genes. The up- and down-stream categories are nonoverlapping. Square—all outliers; circle—expression-decreasing outliers; triangle—expression-increasing outliers.
Intragenic TEs appear to cause the strongest shift in expression, so we further categorized these by the genic region of insertion. TEs in all genic regions were significantly overenriched in low expression gene outliers, with the strongest effect from insertions into coding regions (fig. 4, supplementary fig. S10, Supplementary Material online). In contrast, only TEs into the 5′UTR and coding sites were also significantly overenriched in high expression gene outliers. The 5′UTR contains regulatory sites, so TE insertions may be contributing additional regulatory sites leading to increased transcription of the whole gene. TEs are known to be a large source of promoter and regulatory regions which can be co-opted by the host genome and contribute to the evolution of regulatory networks (Chuong et al. 2017; Hirsch and Springer 2017). The large effect of TEs in coding region insertions on decreasing gene expression could be due to faster decay of mRNAs with large mutations, for example by the nonsense-mediated decay pathway (Garneau et al. 2007). However, the enrichment of TEs in low expression outliers when they insert into coding sites could be driven by a technical artifact. In particular, exons with nonreference TE insertions will be harder to map and therefore more likely to be dropped, resulting in false lower expression values (see Materials and Methods). This effect should only occur for the exon in which the TE is inserted, not upstream or downstream exons. When considering gene expression broken down into individual exons, there were no significant differences in enrichment of TEs in exons upstream of the insertion, downstream of the insertion and the exon containing the insertion (supplementary fig. S4, Supplementary Material online). Therefore, there is no evidence for technical artifacts which could lead to misinterpretation of results. Furthermore, TEs appear to equally reduce expression of all exons, suggesting that TEs are not causing early transcription breaks. The impact of TEs in introns could be driven by targeted silencing of insertions in introns, as has recently been observed for L1 retrotransposons in humans (Liu et al. 2018).
TE Insertions Show Stronger Enrichment in Expression Outliers than SNPs
Given the evidence for a significant effect of rare TEs on expression variation, we wanted to compare these effects to those of SNPs. Josephs et al. (2015) previously showed that a third of genes had an eQTL in this population of C. grandiflora, and that there is a significant negative correlation between eQTL MAF and effect size, suggesting that purifying selection is mostly responsible for maintaining genetic variation for gene expression. However, they tested SNPs with an MAF >5%, and so the contribution of rare SNP variants to gene expression variation is still unclear.
We explored the effect of rare SNPs with an MAF <3% on gene expression. Overall, these variants are present in much larger number, and are equally likely to cause gene up- or down-regulation (fig. 2B;R2 = 0.517). This is in contrast with a recent study in maize, where SNP variants upstream of genes tended to show greater evidence of downregulation (Kremling et al. 2018). When comparing the ratio of variants in expression outliers versus nonoutliers, SNPs had a smaller effect than TEs (1.04 vs. 1.13, respectively; fig. 2C). As a class of mutation, TEs are 9% more overrepresented in outliers than SNPs. In low expression outliers, there is a considerably greater gap between TE and SNP overrepresentation of 43% (1.48 vs. 1.05 ratio values, respectively; fig. 2C). Both tests of the burden of rare variants on gene expression are genome-wide, made by summing across all genes and all individuals in the population. As such, the results highlight the global impact that both TEs and SNPs have on gene expression variation. The outlier test uses a stringent cutoff of 4 standard deviations (SD) away from the mean to define outliers, so it may be that TEs are on average more likely to cause a large change in expression and are overenriched in this test. SNPs, on the other hand, may be on average more likely to cause a small change in expression and are more important in explaining small variation in expression. Therefore, individual TEs may be strong candidates for having large effects on expression (large-effect QTL), but considering their numbers SNPs are also likely important, with smaller individual effects on average.
A major challenge when comparing SNPs to TEs is detection power. Calling nonreference TEs with short-read data is difficult, especially in outcrossing species where many insertions are heterozygous, leading to more false positives and false negatives than when calling SNPs (Ewing 2015). These power issues could lead to biases in our population frequency estimates. There may be many more rare TEs in the population which the pipeline is not detecting, however, in this case our results would be undervaluing the true effect sizes and are therefore conservative estimates of the impact of rare TEs. The outlier expression test controls for this problem because it calculates a ratio of TE numbers between two groups, both of which have equal detection power, allowing for the comparison of TE and SNP effect size independent of the ability to call these variants. Although we assume throughout that the direction of causality is new TE insertions impacting gene expression, the opposite could be occurring, where gene variants with lower expression are more likely to have a TE inserted nearby due to insertion bias or lower selection pressure. However, because our focus is on rare, sample-specific insertions, this scenario seems considerably less parsimonious, since it requires time for both expression reduction and TE insertion as independent events.
Characterization of Common TE eQTL
Although the overwhelming majority of TEs in our population are rare, there is a subset at higher frequency that can be detected using traditional eQTL methods, allowing us to compare the effects of common TE and SNP variants on gene expression. We detected 7,886 TE insertions found in at least ten individuals, and within 5 kb of a gene. Of these, 88 were significant eQTLs (at a false discovery rate <0.1), suggesting that 1.0% of common TEs (taking into account the false discovery rate) near a gene are impacting gene expression. In contrast, out of 5,507,315 SNPs located within 5 kb of a gene with the minor allele found in at least ten individuals, 38,225 were significant eQTLs (at a false discovery rate <0.1), which is 0.62% of the SNPs tested (Josephs et al. 2015). Therefore, individual common TEs appear to be almost twice as likely as a SNP of comparable frequency to show a significant effect on gene expression.
Linkage disequilibrium (LD) can confound these raw estimates of the percent of common variants near genes that affect expression because there can be several variants in LD which are significant eQTLs but only one is causal. LD is more likely to impact the estimate of the percent of SNPs affecting expression than TEs because SNPs are more densely located in the genome, and many genes have over 50 significant eQTL SNPs, whereas almost all genes with TE eQTLs had only one significant TE eQTL (there were four genes which had two TE eQTLs). Furthermore, LD decays quickly in C. grandiflora (mean R2 = 0.12 between SNPs 100 bp apart) (Josephs et al. 2015), so that TEs near different genes are unlikely to be in LD.
There is also potential LD between significant TE eQTLs and SNP eQTLs, making it hard to distinguish if TE eQTLs are explaining new variation, or are simply in LD with previously described eQTL SNPs. Due to our low power to call heterozygous TEs, it is difficult to phase insertions and easily calculate LD between TEs and SNPs. However, several lines of evidence suggest that common TE eQTLs are explaining gene expression variation that is unrelated to SNP eQTLs. Of the 84 genes with a significant TE eQTL, about one-quarter (20), have no significant SNP eQTL. We find that for 64 genes with both TE eQTLs and SNP eQTLs the P-value of TE eQTLs was lower than the lowest SNP eQTL P-value in 24 cases (38%; supplementary fig. S12, Supplementary Material online). When comparing expression effect size, for 37 genes with both TE and SNP eQTL we found that the TE eQTL had a larger effect size than the SNP eQTL with the lowest P-value (58% of all genes with both TE and SNP eQTL; supplementary fig. S13, Supplementary Material online). Thus, although common TEs are rare and therefore represent a considerably smaller contribution to eQTLs genome-wide, our results suggest that the average TE insertion is more likely to influence expression variation than the average SNP.
One of the hypotheses for how TEs affect gene expression is that they could be increasing expression variance in addition to altering mean expression level. This hypothesis is difficult to test with rare variants; however with common TE eQTLs it is possible to compare the gene expression variance of individuals with a TE versus those without. For each gene, we calculated the mean and coefficient of variation (c.v.) of expression for those individuals with and without a TE. We then compared these values with paired t-tests, to examine whether having a TE was, in general, associated with differences in the mean or c.v. of expression. We found a significant difference between individuals with a TE versus those without (t = 4.614, P = 7.83e−06, mean of the differences = 0.109) in the c.v. of expression. Contrary to the hypothesis that TEs might increase expression variation, individuals with an insertion had a lower average c.v. Lower variance of individuals with an insertion could indicate that TEs that lower expression variance are less deleterious and are therefore able to rise to higher population frequency.
Individuals with a common TE insertion nearby had higher average expression than those without a common TE insertion (t = 5.679, P = 5.88e−08, mean of the differences = 6.44). This result is surprising because, as shown earlier, rare TE insertions disproportionately reduced expression. This difference between the effect of rare and common TEs suggests that expression-increasing TEs which contribute to eQTLs are less deleterious than rare, expression-decreasing TEs, or perhaps even advantageous. Alternatively, this result is also consistent with the runaway enhancer model (Fyon et al. 2015), where TE insertions that increase expression in cis spread more quickly and reach higher population frequencies than TE insertions that reduce expression in cis. This pattern results from expression-increasing insertions acting as dominance modifiers, driving their spread and subsequent fixation. Further analyses to disentangle the relative role of this enhancer runaway process versus other possible sources of differential selection will be important to further understand the nature of selective effects of TEs on gene expression.
Conclusions
We found that selection against disruption of gene function and regulation plays an important role in limiting TE copy number, but we see no evidence for selection against ectopic recombination in a population of C. grandiflora. Rare TE insertions in or near genes strongly downregulate expression and to a smaller extent upregulate expression, with the effect differing by the type of TE and the genic region into which it has transposed. In comparison, SNPs have an overall weaker effect and are equally likely to up- and down-regulate expression. Common TEs are similarly individually overenriched for being eQTLs in comparison to common SNPs, although with the large numbers of SNP variants there is a genome-wide predominance of SNP-based eQTLs. These results highlight the important contribution of TEs to standing genetic and phenotypic variation.
Materials and Methods
Study Organism
The self-incompatible, outcrossing plant C.grandiflora, is a model for using population genomic approaches to make inferences about natural selection due to its low population structure and large effective population size (Ne ≈ 600,000) (Foxe et al. 2009; Slotte et al. 2010; St. Onge et al. 2011). The species is a member of the Brassicaceae family and is native to Northern Greece and Southern Albania. There is evidence of prevalent purifying and positive selection on SNPs in C. grandiflora (Slotte et al. 2010; Williamson et al. 2014).
Genomic Data and Expression
The DNA and RNA data have been previously described by Josephs et al. (2015,, 2017). Briefly, plants were sampled from a single population located near Monodendri, Greece (population Cg-9 in St. Onge et al. 2011). Seeds were collected and grown in the University of Toronto glasshouses and random crosses were performed. The offspring of these crosses were grown in the University of Toronto growth chambers, where leaf tissue was collected and used for DNA and RNA extraction. Whole genome sequencing was done using 100 cycles of paired-end sequencing in a Hiseq 2000 with Truseq libraries (Illumina), resulting in 100 bp paired-end reads. RNA was initially sequenced at the Genome Quebec Innovation Centre in an Illumina HiSeq resulting in 100 bp paired-end (Josephs et al. 2015) and then a further set of individuals were sequenced resulting in single-ended reads (Josephs et al. 2017). For consistency, one read was randomly chosen among the paired-end reads and they were subsequently treated as single-ended. The reference genome used for mapping reads is C.rubella, a close relative of C. grandiflora, which diverged approximately 200,000 years ago (Foxe et al. 2009; Slotte et al. 2013). Sequence divergence between C. rubella and C. grandiflora is comparable to within species sequence diversity in C. grandiflora (Brandvain et al. 2013), making it an acceptable reference genome to map to.
RNA reads were mapped to an exon-only reference generated from the C. rubella reference genome (Slotte et al. 2013; Josephs et al. 2015) using Stampy 1.0.21 with default settings (Lunter and Goodson 2011). A median of 93% of reads were mapped per individual (Josephs et al. 2015,, 2017). Expression level was measured with the HTSeq.scripts.count feature from HTSeq (Anders et al. 2015) and normalized for sequencing depth by dividing read counts by median read count of the entire sample. Genes with a median expression level below five reads per sample before normalization were removed from the analyses.
Calling TEs
We built a new TE library to use with the detection pipeline, with a focus on TEs that show evidence of being recently active. Using pindel (Ye et al. 2009), we found large deletions (>150 bp) in 30 of the C. grandiflora short-read sequenced individuals relative to the C. rubella reference genome. These represent candidate TE insertions that occurred in C. rubella since they are present in the reference genome at those locations but absent from those locations in the C. grandiflora sample. Previous population-level evidence shows no signs of TE loss in C. rubella as compared with C. grandiflora (Ågren et al. 2014) so our approach should not be overly biased by the use of C. rubella as a reference genome and should represent cases of very recent transposition. The PASTEClassifier pipeline (Hoede et al. 2014) allowed us to classify the sequences obtained from the C. rubella reference into TE order based on the hierarchical TE classification system (Wicker et al. 2007). Any sequences that remained unclassified were removed (44% of the initial candidate sequences). The distribution of the remaining 2,900 classified sequences resemble TE distributions in C. rubella and A. thaliana, with retrotransposons, especially LTR retrotransposons being the most represented group, followed by terminal inverted repeat DNA elements (supplementary table S2, Supplementary Material online; Slotte et al. 2013).
We used the RelocaTE2 (Chen et al. 2017) pipeline to detect both reference and nonreference TE insertions in 124 C. grandiflora individuals from our population. Briefly, RelocaTE2 is based on a combined split read and discordant read pairs mapping approach. All fastq files were subsampled down to 70X coverage (over the reference genome) to avoid elevated TE calls in individuals with higher coverage, and 23 individuals with below 70X coverage were removed. RelocaTE2 was run using bowtie2 as the TE aligner, using the custom-built TE library described above, and the C. rubella reference genome with default settings. These settings allow for two mismatches between reads and repeat elements and a length cutoff threshold of ten for junction reads (at least 10 bp have to match to a repeat element and at least 10 bp have to match to the reference). We created two population-level tables of TE insertions; one for “low-confidence” TEs, which included any insertion supported by at least one junction read on one side (upstream or downstream), and another “high-confidence” table which included only insertions supported by junction reads from both sides. Results in the main text come from the high-confidence population TE set, but the low-confidence set was used for comparison (see TE validation section below and supplementary figs., Supplementary Material online). Any insertions called across individuals which were within 50 bp of one another and were of the same TE classification type were considered as the same insertion.
We used bwa (Li and Durbin 2009) and samtools (Li et al. 2009) to align short reads to the reference genome, and then passed these alignments to RelocaTE2 to genotype TE insertions as heterozygous or homozygous. Heterozygous TE insertions will have reads aligning to the reference over the insertion site because one of the homologs does not have a TE.
Although RelocaTE2 can genotype insertions as homozygous or heterozygous, there is some evidence from the TE population frequency spectrum that these calls are not always accurate. When using allele counts (0, 1, or 2 for absent, heterozygous, homozygous) to make a frequency spectrum, there is a staggered pattern which goes away when examining the spectrum using individual count (0 or 1 for presence or absence; see supplementary fig. S1, Supplementary Material online, and fig. 1). This suggests that homozygosity is being overcalled. For all rare variant gene expression analyses (see below), we therefore used individual counts (the count of individuals with at least one TE insertion), effectively ignoring homozygous versus heterozygous calls, however our conclusions were qualitatively the same when performed with allele counts (supplementary fig. S2, Supplementary Material online).
TE Validation
Validating RelocateTE2’s ability to find TEs is important, especially in outbred heterozygous population data where only half of the reads will support a heterozygous TE insertion. RelocaTE2 was previously tested on a rice strain of 20-fold genome coverage of 100 bp paired-end Illumina short reads aligned to the rice genome, and resulted in 93% specificity (the percent of calls which were true positives) (Chen et al. 2017). The C. grandiflora data should have a comparable level of specificity because it has higher coverage than the rice data previously tested; however the expected increased rate of heterozygous insertions may lead to a higher error rate. We used an independent bioinformatics test to estimate the true-positive rate (the proportion of new TEs called by RelocaTE2 that are actually TEs). We ran the SPAdes de novo assembler (Bankevich et al. 2012) on all TE calls on scaffold one for five individuals, chosen for their high coverage to increase the chance of success of the de novo assembler. The high coverage individuals should not bias the true-positive rate estimate because all individuals were subsampled to the same coverage (70X) for TE calling. We assembled all reads mapping to the region 1,000 bp upstream and downstream of the TE insertion call and then aligned the de novo assembly contigs to the TE library using Blast+ on default settings (Camacho et al. 2009). If we identified significant hits to the TE library, we considered the TE call to be a true positive.
The average true positive value across the five individuals was 80% for TEs labeled as high-confidence by RelocaTE2 (see supplementary table S1, Supplementary Material online, for breakdown by individual). The true positive value for nonhigh-confidence TEs was 60%. For subsequent analyses, we therefore focused on the high-confidence calls. Analyses considering both high- and low-confidence calls led to similar results, but with lower significance, consistent with the greater noise contributed by the lower-confidence calls (supplementary fig. S3, Supplementary Material online).
Gene and Genome Annotation
TE insertions into genes were categorized as exonic, intronic, 3′UTR, or 5′UTR based on the C. rubella genome annotation (Slotte et al. 2013). In 38% of the genes, the 5′UTR was unknown. Similarly, 4-fold degenerate SNPs were identified for comparison with the TE site frequency spectrum. CNSs are determined through alignment of nine Brassicaceae species to the C. rubella genome as described in Haudry et al.( 2013) and Williamson et al. (2014). Recombination rate data comes from fitting a third-order polynomial crossover events from an F2 genetic map derived from a cross between a C. rubella and C. grandiflora individual (Slotte et al. 2012; Slotte et al. 2013).
We ran quadratic multiple linear regression models predicting TE frequency from the proportion of coding sites alone, or both coding sites and CNSs using the R lm function (R Development Core Team 2008). We used the ANOVA function to test whether the model with two predictor variables explained more variation than the simpler model.
SNP Data Set
Initial SNP calling and filtering was previously described by Josephs et al. (2015,, 2017). From the 124 individuals used in TE detection, 15 were dropped from further analyses due to an excess of NA SNP genotype calls (over 50,000 NA calls/individual). Any SNPs where more than nine individuals had an NA call were also dropped. The cutoffs were empirically determined as large outliers when plotting histograms of NA calls per individual and NA calls per SNP. All other NA calls were assumed to be homozygous for the reference allele; given the focus on rare variants, this assumption is unlikely to have a strong effect on results.
Burden of Rare Variants Test
The rare variant burden test used for determining the effect of rare variants (both TEs and SNPs) on gene expression was first described by Zhao et al. (2016). Briefly, the rare variant burden test estimates a genome-wide correlation between total rare variant count and gene expression relative to the rest of the population, testing whether individuals with more extreme expression values for a certain gene have more rare genetic variants located near that gene. Individuals are sorted into expression rank bins and the number of rare variants located in and near a gene is summed across all genes in the genome, for each expression rank bin. If there is a burden of rare variants, and having more of them pushes individuals to the extremes of expression (relative to the rest of the population), there will be a quadratic relationship between rare variant count and expression rank. Note that each gene is assessed independently, such that at individual genes, different individuals can end up in the tails of the distribution.
The rare variant burden plots were created using TEs and SNPs with an MAF <3% from all 109 individuals. For all plots, we used TEs and SNPs which were within a gene or 500 bp upstream or downstream. We identified a small subset of genes where some individuals showed extreme numbers of rare SNPs, possibly reflecting alignment errors or paralogous sequences. Any genes where at least one individual had over 40 rare SNPs were removed (874 genes dropped in total).
For plots which considered only a single genic region (5′UTR, exon, intron, or 3′UTR), there may be some bias due to genes where UTRs were not annotated. Note that given the residual uncertainty of exact TE insertion locations (∼50 bp), this means that there will be some noise associated with annotation of insertion position.
Expression Outlier Test
We developed an alternative method to test the effect of rare variants on gene expression which allows for a more direct comparison between the effect of TEs and SNPs. Again, we used all variants with an MAF <3% from the 109 individuals which passed both TE and SNP filtering and which were located within a gene or 500 bp away from a gene.
The test involves determining individuals which are expression outliers, and comparing their number of rare variants with those of nonoutlier individuals, repeated for each gene. Outliers were called as 4 SD away from the mean, where mean and SD were calculated using the expression values of individuals between the first and third quartile. Estimating the mean and SD from individuals between the first and third quartiles reduces bias in these estimates caused by large expression value outliers and nonsymmetrical distributions. As this method underestimates variation (relative to the total sample), an extreme cutoff of 4 SD was used to call outliers. When testing without discrimination between upper and lower outliers, all genes were used except for 11, in which all individuals were within 4 SD of the mean (total of 18,874 genes). When distinguishing between upper and lower outliers, we only considered genes where the mean was at least 4 SD above zero, to ensure it was possible to have lower outliers. After removing genes where all individuals were within 4 SD of the mean, there were 10,290 genes tested for upper outliers and 14,849 genes tested for lower outliers.
For every gene, we computed the number of rare variants per individual to control for differences in number of outliers and nonoutliers among and between genes, and checked for a significant difference by running a Wilcoxon signed rank test using the R wilcox.test function for both TEs and SNPs (R Development Core Team 2008). To determine a per-variant effect size, we calculated the ratio of the mean number of rare variants per outlier individual to the mean number of rare variants per nonoutlier individual across all genes. This ratio expresses how many more variants there are per outlier versus nonoutlier. Taking the difference between the TE ratio and SNP ratio gives a quantitative measure of how much more likely the average TE is to cause an expression outlier versus the average SNP.
We ran 1,000 bootstraps of the ratio using the R boot() package in order to calculate 95% quantile confidence intervals (Canty and Ripley 2017). Thousand permutations were also run to build a null distribution, where the outlier versus nonoutlier label was switched with a 50% probability for every gene.
Expression Outlier by Exon
We performed a slightly altered version of the expression outlier test to control for a possible technical artifact which could lead to the appearance of TE insertions in exons decreasing gene expression. RNA reads that include a TE may be dropped in filtering due to poor mapping, leading to an appearance of reduced overall transcript expression. To test this, we divided total gene expression into individual exon expression. For each gene with a TE insertion in at least one individual in the population, we created three categories: average expression of all exons upstream of the TE insertion, expression of the exon with the TE insertion, and average expression of all exons downstream of the TE insertion. If there was a technical artifact, and RNA reads with TEs were dropped due to poor mapping, we would expect that only exons with TEs had TEs associated with low expression outliers. Upstream and downstream exons would not show TE enrichment in low expression outliers, because their expression would not be affected by poor mapping.
Mapping Local TE eQTLs
The eQTL analysis was done following the methods and using the scripts of Josephs et al. (2015). Briefly, all TEs within the window 5 kb upstream of the TSS and 5 kb downstream of the transcription end site were chosen to be tested. This window size was chosen to be consistent with the previous SNP eQTL study and allow for a direct comparison. Only TEs present in at least ten individuals were considered, to allow for sufficient power to detect a significant association. A Mann–Whitney U test was used to test for an association between TE presence and gene expression level. To correct for multiple testing, a false discovery rate of 0.1 was used as a significance threshold. The expression effect size of TE eQTLs was calculated as the absolute difference between the mean expression value of individuals with a TE insertion and the mean expression value of individuals without a TE insertion, following Josephs et al. (2015).
Coefficient of Variation Analysis
For each gene with a TE eQTL, we separately calculated the c.v. of expression for all individuals with a TE insertion and all individuals without a TE insertion. We then compared these values with a paired t-test, where the pairs are the group of individuals with a TE and the group of individuals without a TE for the same gene. Using this paired t-test design, we can examine whether having a TE is, in general, associated with differences in the c.v. of expression. We ran a similar paired t-test analysis, replacing the c.v. with the mean of expression.
Data Availability
All RNAseq and genomic data are available from the NCBI Sequence Read Archive (bioproject ID: PRJNA275635). Supplementary file S1 (Supplementary Material online) contains all called TEs used in the analyses, their locations, and genotypes for each individual. All codes used for analyses are available at https://github.com/jacau.
Supplementary Material
Supplementary data are available at Molecular Biology and Evolution online.
Acknowledgments
We thank Aneil Agrawal for key recommendations for statistical methods and Rob Ness for important suggestions on data validation. We thank Young Wha Lee, Niroshini Epitawalage, and Amanda Gorton for assistance collecting data. We would also like to thank Yunchen Gong and the Centre for the Analysis of Genome Evolution and Function (CAGEF) for server support. Thomas Bureau, Mathieu Blanchette, Daniel Schoen, Paul Harrison, Alan Moses, Adrian Platts, and Eef Harmsen contributed to the design and implementation of the Value-directed Evolutionary Genomics Initiative (VEGI). This work was supported by the Natural Science and Engineering Research Council of Canada (NSERC) (Discovery Grant to S.I.W. and J.R.S. and Canada Graduate Scholarships support to J.U.) and National Science Foundation (IOS-1523733 to E.B.J.).
References
Ågren JA, Wang W, Koenig D, Neuffer B, Weigel D, Wright SI. 2014. Mating system shifts and transposable element evolution in the plant genus Capsella. BMC Genomics. 15:602.
