


Abstract
Most phylogenetic tree-generating programs produce a fully dichotomous phylogenetic tree. However, as different markers may produce distinct topologies for the same set of organisms, topological tests are used to estimate the statistical reliability of the clades. In this protocol, we provide step-by-step instructions on how to perform the widely used bootstrap test using MEGA. However, a single unstable lineage, also known as a rogue lineage, may decrease the bootstrap proportions in many branches of the tree. This occurs because rogue taxa tend to bounce between clades from one pseudo-replicate to the next, lowering bootstrap proportions for many correct clades. Thus, it is important to identify and exclude rogue taxa before initiating a final phylogenetic analysis; here, we provide this protocol using the RogueNaRok platform.
Protocol
Here, we provide step-by-step instructions on how to perform the widely used bootstrap test for phylogenetic trees using the Molecular Evolutionary Genetic Analysis (MEGA) software (see Hall 2013 for a phylogenetic tree-building protocol). Since its original release, MEGA has become a workbench that includes a wide range of molecular evolutionary analyses in a user-friendly interface (Kumar et al. 2016). MEGA is suitable for students, beginners and professionals and, thus, our choice for this protocol. The name of the test, bootstrap, comes from the idea that generating samples using the same original data set would be as if one were lifting oneself up by pulling one’s own bootstraps (Efron 1979; Felsenstein 1985).
The bootstrap test measures the internal consistency of a molecular data set by analyzing if slightly modified alignments support the same clades. More specifically, it is a resampling test so that, in each cycle, a replicate alignment is built. To generate each replicate alignment, the algorithm samples sites (i.e., alignment columns) from the original full alignment. This is done with replacement until the original number of sites is reached (fig. 1). Hence, for each replicate, some sites from the original alignment will be removed, whereas others will be sampled more than once. A replicate tree will be generated for each replicate alignment. This is usually repeated for 100 times, generating 100 replicate trees.
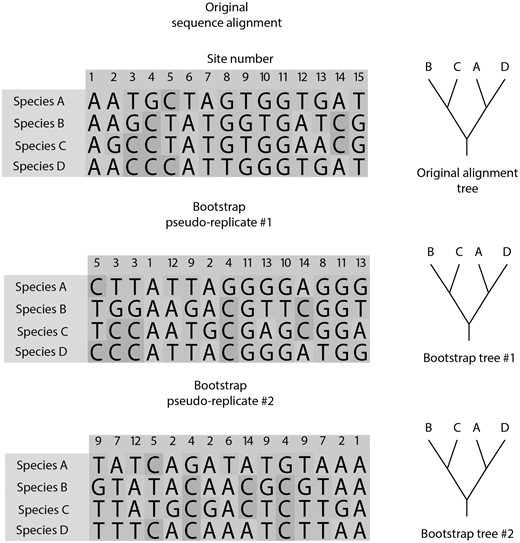
Bootstrap algorithm. For each bootstrap alignment replicate, columns from the original alignment are samples with replacement until the same number of columns from the original alignment is reached. For each alignment replicate, a replicate phylogeny is built. The bootstrap value is the proportion of replicate phylogenies that recovered a particular clade from the original phylogeny that was built using the original alignment.
The bootstrap value for a clade is the proportion of the replicate trees that recovered that particular clade (fig. 1). These values may be mapped on a bootstrap consensus tree, which is built by summarizing all replicate trees using a consensus method. Alternatively, bootstrap values are placed on the original tree that is built using the original full alignment (Results of the bootstrap test in MEGA include these two options in different flaps.)
The number of replicates relates to the precision of the test, which is the degree that the bootstrap support, obtained using a finite number of replicates, is expected to match the value that would be attained using an infinite number of replicates (Hillis and Bull 1993). It has been suggested that the typical 100 or even 500 replicates may not be sufficient to well explore the sampling space (Hedges 1992; Stamatakis 2015), but it is possible to determine the number of replicates that produces stable bootstrap values (see Pattengale et al. 2010).
On the other hand, the accuracy of the test is related to the probability that a well-supported clade belongs to the true tree. In fact, the bootstrap test yields the repeatability of the data; that is, the probability of retrieving the same clade using an independent data set (other molecular markers, morphology, etc.). Therefore, a 90% bootstrap value in a phylogeny using a mitochondrial gene is associated with a 90% probability of recovering the same clade using a nuclear gene for the phylogenetic analysis. Using simulations and empirical tests, it has been demonstrated that the bootstrap test is a conservative estimate of the probability that the clade belongs to the true tree (Sitnikova et al. 1995; Russo 1997).
Nevertheless, the accuracy of the bootstrap test may significantly decrease in case of high levels of incomplete lineage sorting (see Kubatko and Degnan 2007 and Mirarab et al. 2016 for details). In such cases, different genes may have distinct evolutionary histories due to ancestral polymorphism, recombination within a locus, etc. Hence, bootstrap test results must be taken with caution, particularly, when using a single DNA marker. We recommend the use of the bootstrap test for phylogenies using multiple markers.
Step 1—the Generation of Bootstrap Replicate Trees for RogueNaRok
Rogue taxa are unstable lineages that assume different positions comparing phylogenetic trees in a given tree set (Aberer and Stamatakis 2011; Aberer et al. 2013), such as those generated by a bootstrap test. The presence of one rogue lineage may be sufficient to lower the bootstrap values of many correct clades as the rogue taxa bounces between clades from one replicate to the next. In fact, a given taxon is considered a rogue lineage if, when pruned from the data set, an increase in the overall support values is detected or a better-resolved consensus tree is produced from the tree set. Hence, we suggest removing these taxa before the final bootstrap analysis in MEGA.
In this protocol, we have selected the RogueNaRok program that detects rogue taxa in a set of unrooted and fully bifurcating trees using a graphical user interface (Aberer and Stamatakis 2011; Aberer et al. 2013). The rogue detection algorithm, however, demands the set of individual replicate (i.e., bootstrap) trees, which MEGA does not provide. Hence, we will use the user-friendly PhyML (Guindon et al. 2010) only to generate this tree set. It is beyond the scope of this protocol to discuss tree-building methods and, here, we only indicate the basic steps to generate the tree set required by RogueNaRok (for more details on phylogenetic reconstruction, see Nei and Kumar 2000; Lemey et al. 2009; Hall 2011, 2013).
On the PHYML page, the user must upload a sequence alignment in FASTA format, selecting the type of molecular data (DNA or protein) (http://www.atgc-montpellier.fr/phyml; last accessed June 18, 2018). As an example, we have selected a passerine data set that includes 25 sequences and 12 kb (passerines.phy from Supplementary Material) from Selvatti et al. (2015). After uploading the data set, the user should opt for the Smart Model Selection (SMS) (Lefort et al. 2017) to automatically determine the best substitution model for the alignment. In this case, the user must also specify the statistical criteria (Bayesian Information Criterion [BIC] or Akaike information criterion [AIC]; see Sullivan and Joyce 2005 and Lemey et al. 2009, for model selection details).
As the starting tree, the user may select the default BioNJ tree-building method (Gascuel 1997), which is an improvement over the traditional Neighbor-Joining algorithm (Saitou and Nei 1987). The BioNJ tree may be rearranged using the faster Nearest-Neighbor-Interchange (NNI) algorithm to search for the Maximum Likelihood tree. When the Bootstrap test is selected, a window is enabled allowing the user to stipulate the number of replicates; the default is 100 (fig. 2).
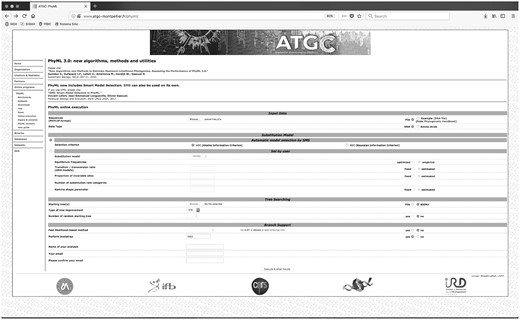
PhyML 3.0 page overview. The data set (passerines.phy) has been included for analyses. Once the bootstrap test is selected, a window opens allowing the user to enter the number of replicates.
Once the user presses Execute & Email Results button, the analysis begins and a link to the job status page appears on the screen. After the analysis is finished, the Status page switches to a Results page, on which the user may Download all results as a compressed file that includes the bootstrap tree set (passerine_bootstrap.trees from Supplementary Material).
Step 2—Preparing Data for Rogue Analysis Using RogueNaRok
Once the bootstrap tree set is ready, the user must go to the RogueNaRok online server page (http://rnr.h-its.org/about; last accessed June 18, 2018) and click on the Submit Job tab to input the tree set using the Bootstrap Tree Set button. At this point, the user may also include a Best Known Tree, which could be the maximum likelihood tree or the consensus Bayesian tree obtained from the concatenated matrix so that the optimization process may use this tree as a reference. The Ignored Taxa option may be used to forcefully ignore some important lineages that are not to be considered rogues. The user may add a Job Description and an E-mail to receive an automatic notification when the job is completed. After submission, the page will automatically refresh, and it will open the Workflow session, the main RogueNaRok analysis page.
On this session, the menu on the left, Configure Rogue Taxon Search, allows the user to choose the main parameters for the rogue search algorithm (fig. 3). The Threshold parameter controls the identification and the sensitivity of the rogue search. In this case, the Strict Consensus Search option will only consider to be a rogue lineage, if, when removed, it yields a new clade that is present in all the trees of the tree set. This is the option that eliminates the minimum number of rogues. In the Majority Rule Search option, rogue taxa will be considered those that, if removed, result in a clade that is present in at least half of the trees in the set. On the other hand, using the Extended Majority Rule option, the program considers all clade gains, regardless of their frequency in the tree set, as long as it improves the resolution of the consensus tree built from the tree set. This improvement is iterative, as it is done until no more improvement in the consensus is found. The user may also set the Consensus Threshold so that different frequencies of clade gain may be used. Finally, you may input a Best Tree Estimate to optimize branch support on this tree as a reference rather than on the consensus of the tree set.
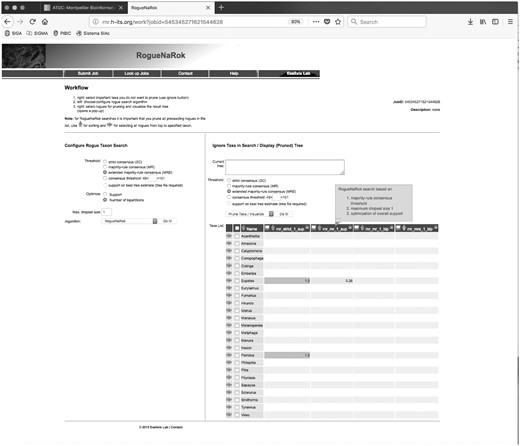
RogueNaRok results page. Four different runs of the program were executed and the results are shown in the four columns. Eupetes and Petroica were considered rogues.
Other features on the left menu include the Optimize (button), which will select the algorithm to appraise the consensus improvement. Namely, for each taxon, the test result will be listed as a score that indicates how the pruning of that particular taxon improves the number of resolved nodes (Optimization: Number of bipartitions) or the average support values (Optimization: Support) in the consensus tree. The higher the score is, less stable the lineage is.
The Maximum Dropset size option allows you set how many taxa will be simultaneously considered for pruning. The default value is 1, the faster but the least exhaustive option, as it only identifies a single lineage per run. However, it is possible that a group of taxa becomes rogue only if simultaneously pruned. In order to test for this case, the user may input higher dropset size values so that more taxa will be tested simultaneously, with an increased computational burden. Even though it would be best to test the influence of different dropset values on the results (Wilkinson and Crotti 2017), it seems that small values, up to 2 (for majority-rule consensus) or 4 (for strict consensus), are sufficient (RogueNaRok on-line manual, Aberer et al. 2013).
Other software is available for rogue taxon identification (see Wilkinson and Crotti 2017), but only RogueNaRok has a GUI and user-friendly online service (http://rnr.h-its.org/about; last accessed June 18, 2018). In this page, the user may also choose two other Algorithms for the rogue identification analysis apart from RogueNaRok. One is the Leaf Stability Index that measures the node stability based on quartet frequencies (Thorley and Wilkinson 1999) and the other is the Taxonomic Instability Index that uses unweighted patristic distances to evaluate node stability (Maddison and Maddison (2018).
Step 3—the Rogue Identification Analysis Using RogueNaRok
After selecting all the parameters on the left menu, select the RogueNaRok Algorithm and click on the Do it! button. The program will start, and it might take a few minutes to several hours to complete, depending on the selected parameters and data size. Once the analysis is complete, it refreshes the page, with the RogueNaRok results appearing as a column below a menu (Ignore Taxa in Search/Display (Pruned) Tree) that appears on the right.
On the right-hand menu, one will see the list of all the taxa in the data set, and may (again) forcefully ignore specific taxa for pruning by ticking the squares by each taxon name. We recommend that RogueNaRok is run without this option first to explore all potential rogues in the data set before deciding which taxa to ignore, as ignoring lineages a priori may bias one’s final results. We also suggest multiple runs varying parameters in each run in order to select the appropriate taxa to be pruned (see Wilkinson and Crotti 2017). Each new run will be added as a new column that lists the score for each taxon.
For instance, in this example, we have performed four times the rogue identification analyses for the passerine data set (fig. 3). The details of each analysis are found in the first line of each analysis column (sup for support based optimization, bip for bipartitions based optimization, mr for majority-rule consensus, etc.). The user may also pass the mouse prompt to get additional information on the analysis. For this data set, the results indicate that Eupetes and Petroica are rogues considering strict consensus gain of support (first column). Nevertheless, if a majority-rule consensus analysis is requested, only Eupetes remains a rogue (second column). If, on the other hand, the optimization is performed using bipartition gains on the consensus (rather than support values), no rogues are found in this data set (last two columns).
It should be noted that taxon pruning must be exercised with caution as it increases support (or consensus resolution) at the expense of the taxon sampling coverage (Aberer et al. 2013). Hence, the taxon sampling must be well balanced with the biological problem to be addressed using the phylogeny. On the other hand, the fact that a lineage has been identified as a rogue is a result nonetheless, as it means that the data available is not sufficient to resolve its phylogenetic position. For systematic purposes, it might be worth considering it an incertae sedis when pruning it from the final analysis.
After deciding on which taxa to be pruned, the user must click on the box of these taxa under the Prune/Visualize taxa option on the menu on the right. As the final RogueNaRok result is the consensus tree after rogue pruning, the user must also select the consensus type (Threshold) to be shown and click on the Do it! button. The consensus tree will appear, in the Newick format, in the Current tree window.
The final step is to visualize the consensus after pruning. The RogueNaRok online service also generates a java-based built-in tree viewer (Archaeopteryx). If the user wishes to visualize the results in this interactive tree viewer, the browser must have the most recent version of java, must allow pop-ups and must enable JavaScript for the RogueNaRok website. Please note that the consensus tree that RogueNaRok provides, after rogue pruning, simply excludes the pruned taxa from the original tree set and should not be used as phylogenetic results. In this sense, it is extremely important to run the alignment and phylogenetic analyses with the new taxon sampling once the taxon set has been redefined with the rogue analysis.
For more computer-intensive analyses and more flexible option configurations, please refer to the downloadable, command line-based version (https://github.com/aberer/RogueNaRok). We have included a PERL script that automatically generates the bootstrap trees in PhyML and uses them in a basic rogue search in RogueNaRok (detailed instructions are given in the boot_rogue_pipeline.pl file in the Supplementary Material).
Step 4—Open Multiple Alignment File in MEGA
The user must then perform the multiple alignment using the new taxon set (see Hall 2013), select the model of evolution and choose the tree-building method to be used before the bootstrap test. It is beyond the scope of this protocol to provide instructions for these steps, as they are available elsewhere (see Hall 2013). Thus, we have realigned our data set after excluding the rogues Eupetes and Petroica. To perform the bootstrap test, the user must open the alignment file (passerines.meg from Supplementary Material) in MEGA’s main window using the option Open a File/Session.
The program asks if input sequences are amino acids, nucleotide, protein or pairwise distance data. MEGA also allows for the user selection of characters for missing data (default is ?), alignment gap (default is -) and identical symbol (default is .). If nucleotide data is selected, a second window will appear asking if sequences are protein-coding. Select the appropriate options for your sequences, and MEGA will then be ready to analyze your data.
Step 5—Bootstrap Test in MEGA
From the Phylogeny menu, select one of the following options: Construct and Test Maximum-Likelihood tree, Construct and Test neighbor-joining tree, Construct and Test maximum parsimony tree, Construct and Test UPGMA tree or Construct and Test Minimum-Evolution tree, depending on your reconstruction method of choice. In MEGA, the algorithm used to generate each pseudo replicate trees always follows the same user-defined protocol to generate the original phylogenetic tree. (In other programs, however, the bootstrap test may follow a distinct—and faster—protocol to generate pseudo replicate topologies for maximum likelihood algorithm.) An Analysis Window will open. The yellow color indicates that there are alternatives for that particular line. In the Test of phylogeny line, MEGA gives two choices for neighbor-joining and minimum-evolution trees, the Bootstrap test and the Interior branch test, whereas for the other remaining phylogenetic methods, only bootstrap may be selected.
To perform the bootstrap test, the user must select the number of bootstrap replicates. The default in MEGA is 500, but 1,000 is preferred (but see Hedges 1992, for a 2,000 replicates rationale). As MEGA finishes the bootstrap test, two flaps appear on the page. The front flap is the result of the bootstrap test using the original tree that was built using the original alignment. On the other hand, the back flap shows the bootstrap consensus tree, which is a consensus of the bootstrap replicate trees. In this consensus tree, clades produced in <50% of the bootstrap replicates are collapsed. Legends for the original and consensus trees are readily provided below the tree that the user may edit, print, copy, save to a file or display in a new window.
We show the bootstrap test results on the passerine data set using the original data set (24 taxa and 12 kb) and using a data set excluding the rogue lineages (Eupetes and Petroica). The bootstrap support difference is remarkable, when comparing values for a particular clade (fig. 4a and b). In all cases, the bootstrap values usually increased, in one case, from 78 to 99 (Passerides clade). The exception was the Eupasseres clade (Suboscines plus Oscines) that slightly decreased bootstrap support from 52 to 51, when rogues were removed.
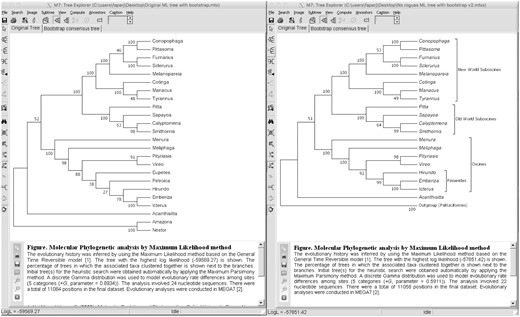
Bootstrap test results using Maximum likelihood in MEGA. (a) Bootstrap results using the original data set (with rogues). (b) Bootstrap results using the data set excluding the rogues (Eupetes and Petroica) that show improvement in bootstrap values for most clades.
Step 6—Presenting the Tree
Here, we will focus on the many tools that MEGA provides to present a tree with bootstrap support. The horizontal menu above the bootstrap tree allows the user to save (format .mts), to print, to select different displays of the tree (topology only, radiation, rectangle and circle formats, compute consensus, etc.) and to compute divergence times. An information (i) button provides the full instructions of the steps and choices used to produce this tree, such as evolutionary model, number of bootstrap replicates, tree-building method and gaps/missing data treatment.
Finally, the tree options menu allows the user to choose tree styles. These options are divided into five different flaps: the tree flap (branch thickness, taxon separation, tree width), the branch flap (line width, display bootstrap values, branch lengths and divergence times), the labels flap (display taxon names, select color and symbol codes for taxon names), the scale flap and the cut-off flap. This latter flap is particularly useful as it allows the user to determine cut-off bootstrap values so that lower support values will be portrayed as unresolved polytomies in the condensed tree. Using the labels flap, the user may convert taxon names to italic, for instance (see fig. 4b).
The vertical menu left to the tree allows swapping and flipping of the branches, the first and third (red) buttons on this menu. These are helpful if two trees must be presented side by side or they must be shown as the most similar possible. Additionally, since tree-building methods usually produce unrooted trees, the green (second button) option allows the user to root the tree.
The pink button is also very useful as it may be used for compressing/expanding branches of large phylogenetic trees. MEGA allows the user to define the name (Outgroups) of an Amazona plus Nestor clade compressed using this tool (fig. 4b). The red and blue button presents more tools to aid the visualization and editing of the tree. There are three flaps: Property (allows the user to define names, line thickness and shapes to be associated with particular clades); Display (vertical alignment, brackets or lines options for name groups); and Image (display user-selected images to be associated with clades). The remaining buttons define other visualization techniques for the tree. In all cases, an interior branch of the tree must be selected before pressing the colored buttons by using the arrow button.
As previously mentioned, MEGA allows the user to save the tree in the .mts format to be used in the future using the first (blue) button in the menu. Other formats are also available using the Image menu such as .emf, .pdf, .png and .tiff. The user may also Export the tree in the Newick format using the File menu that may be used in the Figtree program (http://tree.bio.ed.ac.uk/software/figtree/) that provides additional features for publication images.
Acknowledgments
This project was funded by Coordenação de Aperfeiçoamento de Pessoal de Nível Superior (CAPES grant #1668367; Brazilian Education Ministry) and Conselho Nacional de Desenvolvimento Científico e Tecnológico (CNPq grant #308387/2015-5; Brazilian Science, Tecnology and Communications Ministry) funding agencies that granted fellowships to A.P.S and C.A.M.R., respectively.
