


Abstract
Although the mapping of codon to amino acid is conserved across nearly all species, the frequency at which synonymous codons are used varies both between organisms and between genes from the same organism. This variation affects diverse cellular processes including protein expression, regulation, and folding. Here, we mathematically model an additional layer of complexity and show that individual codon usage biases follow a position-dependent exponential decay model with unique parameter fits for each codon. We use this methodology to perform an in-depth analysis on codon usage bias in the model organism Escherichia coli. Our methodology shows that lowly and highly expressed genes are more similar in their codon usage patterns in the 5′-gene regions, but that these preferences diverge at distal sites resulting in greater positional dependency (pD, which we mathematically define later) for highly expressed genes. We show that position-dependent codon usage bias is partially explained by the structural requirements of mRNAs that results in increased usage of A/T rich codons shortly after the gene start. However, we also show that the pD of 4- and 6-fold degenerate codons is partially related to the gene copy number of cognate-tRNAs supporting existing hypotheses that posit benefits to a region of slow translation in the beginning of coding sequences. Lastly, we demonstrate that viewing codon usage bias through a position-dependent framework has practical utility by improving accuracy of gene expression prediction when incorporating positional dependencies into the Codon Adaptation Index model.
Introduction
The initial investigations into the usage of synonymous codons occurred nearly 40 years ago (Fiers et al. 1975; Ikemura 1981). Since then, a large body of work has shown that bias in codon usage is widespread across diverse taxa (Sharp et al. 2005) and related to a variety of factors including genomic base composition (Chen et al. 2004), mutational bias (Lind and Andersson 2008; Hershberg and Petrov 2010), and selection for or against particular sequence motifs that are used as control elements to differentially degrade or traffic mRNAs to particular areas of the cell (Itzkovitz et al. 2010; Li, Oh, et al. 2012). Additionally, different species of tRNA vary in their gene copy number, overall expression level, and affinities for their target codons (Ikemura 1981; dos Reis et al. 2004; Rocha 2004). Under the assumption that elongation rates may be diffusion limited in at least some cases, it has long been speculated that codon usage bias may impact both the speed and accuracy of translation. This, however, remains a controversial topic with experimental support on both sides (Sørensen and Pedersen 1991; Li, Oh, et al. 2012; Takahashi et al. 2012; Charneski and Hurst 2013).
The consequences of codon usage bias are equally as diverse as their origins. Computational studies have shown that codon usage bias may play a role in gene transfer between species (Tuller, Girshovich, et al. 2011) and protein folding (Pechmann and Frydman 2012). Additionally, there is experimental support showing that an understanding of codon usage bias is important for viral defense and vaccination (Coleman et al. 2008; Bahir et al. 2009; Li, Kao, et al. 2012), resistance to environmental fluctuations in amino acid levels (Elf et al. 2003; Subramaniam et al. 2012), temporal or cyclic control of gene expression (Frenkel-Morgenstern et al. 2012; Xu et al. 2013; Zhou et al. 2013), cotranslational protein folding (Zhang et al. 2009), and recombinant protein production (Kudla et al. 2009; Welch et al. 2009). Although the majority of studies assume that codon usage bias is uniform along the length of genes, several reports dating back to the 1980s showed that codon usage bias in particular gene regions is distinct from others (Liljenstrom and von Heijne 1987; Bulmer 1988; Chen and Inouye 1990; Eyre-Walker and Bulmer 1993, 1995; Qin et al. 2004; Cannarozzi et al. 2010; Bentele et al. 2013; Goodman et al. 2013) including clusters of “suboptimal” or “rare” codons at the beginning of genes (Ohno et al. 2001; Tuller, Carmi, et al. 2010; Pechmann and Frydman 2012).
There have been several proposed mechanisms as to why rare codons are enriched in the 5′-region of genes, with one positing that a region of slow translation (a “translational ramp” or “bottle-neck”) at the beginning of genes helps to keep ribosomes evenly spaced and avoid collisions (Vind et al. 1993; Tuller, Carmi, et al. 2010). In parallel to this line of research, several computational and experimental reports in recent years have also highlighted the importance for reduced secondary structure surrounding the start codon (Kudla et al. 2009; Gu et al. 2010; Tuller, Waldman, et al. 2010; Zhou and Wilke 2011; Keller et al. 2012), particularly for prokaryotic gene expression. More recently, researchers have drawn a critical link between codon usage and mRNA secondary structure and showed that the choice of synonymous codons can influence secondary structure (Tuller, Veksler-lublinsky, et al. 2011; Bentele et al. 2013; Goodman et al. 2013) and that codon usage bias in the 5′-region of genes may modulate translation initiation in addition to elongation.
However, most studies to date have analyzed aggregate measures of codon usage (codon adaptation index [CAI], tRNA adaptation index, etc.) that mask the potentially important contributions of individual codons. To illustrate why this may be problematic, we note that the decreased “translational efficiency” (for which codon and/or tRNA adaptation indices are often a proxy) in the beginning of gene sequences may simply be the result of one or two amino acids having inverted preferences in this region as opposed to a global phenomenon whereby all amino acids select “slow” codons to modulate translation rate. This distinction could be critical for testing mechanistic hypotheses about evolutionary/mutational origins of codon usage bias as well as in designing recombinant proteins for optimal expression.
Further, most published studies also rely on bins of codons or an unnatural delineation between gene regions (i.e., the first ten codons vs. the rest of the gene) whose physical basis or statistical rationale is rarely discussed. Lastly, although researchers have known about the positional dependence of codon usage bias for years, to our knowledge all statistical models of codon usage bias fail to account for this effect. Thus, there is a disconnect between this knowledge in principle and its usage in practice.
To address these gaps, we sought to investigate position-dependent codon usage bias through a rigorous quantitative framework with a focus on the model organism Escherichia coli. We validate previous observations about heterogeneous codon usage with regard to position and expand on the established link between base composition, codon usage, and mRNA structure. Further, we use model selection to determine a functional form to individual codon usage biases and observe an unexpected heterogeneity of parameters that should serve as a crucial test for any proposed mechanistic explanations relating to the origins of codon usage bias. We demonstrate that our revised understanding of codon usage bias, viewed through a position-dependent framework, can be simply incorporated into existing codon usage models and used to increase predictability in gene expression. Finally, we show preliminary support that our results are likely not unique to E. coli by demonstrating that the position-dependent exponential decay model more accurately describes codon usage biases in a variety of organisms.
Results
Codon Usage Bias Is Not Uniform with Regard to Position
To test whether there is position-dependent bias in codon usage preferences at the genome scale, we performed a  test on 4,139 protein-coding genes from E. coli (NCBI/GenBank: NC_00913.2). Briefly, we aligned all the coding sequences at their start codon and partitioned the codons into ten position-dependent gene regions, such that each bin contained approximately 130,000 total codons (fig. 1A, see Materials and Methods). To account for uneven gene lengths and maintain a similar number of codons per bin, as illustrated in figure 1A, bin width is progressively wider at distal sites. Within these bins, we counted the occurrences of individual codons and compared those counts to the expected mean and standard deviation calculated from a null model derived by using a synonymous codon shuffling algorithm. This method preserves overall codon usage and amino acid structure within each gene allowing us to quantify codon usage bias at all positions rather than simply codon usage. We then calculated the
  statistic and determined the statistical significance of the observed values.
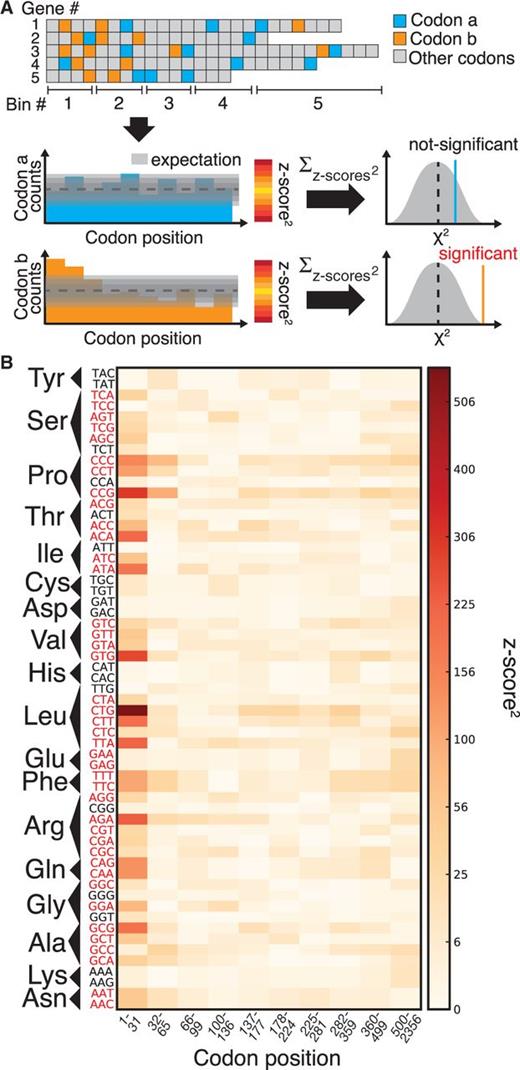
Codon usage bias is not uniform with regard to intragenic position. (A) This cartoon schematic shows one codon that is used evenly throughout the toy gene set (codon a, blue) and one codon that is not (codon b, orange). To statistically verify this, we align all genes at the 5′-region, group each codon into position-dependent bins, compare codon usage in each bin to random expectation, and sum the deviations over all bins. (B) Squared z scores of codon usage for Escherichia coli as a function of position. Codons on the y axis are grouped according to the amino acid they code for and are labeled red if their usage bias is significantly nonuniform ( ). Results for each bin are depicted according to the quadratically scaled color bar, and the ten bins are arranged from 5′ to 3′.
For 41 out of a possible 59 redundant codons, we found statistically significant ( ) heterogeneous codon usage bias using this method (fig. 1B, red codons). Further, visual analysis of the squared z scores for each bin reveals that the observed deviations from uniformity are predominantly occurring in the 5′-region of genes, whereas there appears to be comparatively little heterogeneity in codon usage bias at distal sites. To make sure that these findings were robust and do not rely on a particular statistical test or binning scheme, we tried two different binning schemes (50 and 100 bins, 41 and 38 significant codons respectively, supplementary fig. S1, Supplementary Material online) and we performed three separate statistical tests for individual codons (all of which were compared against a synonymous shuffling null model): The position of median codon occurrence, the area under the curve (AUC) of the cumulative distribution of codon usage with regard to position, and the size of the largest deviation from expectation in the cumulative distributions (see Materials and Methods). Using these tests, neither of which require data binning, we found that 24 out of 59 codons had significantly nonuniform codon usage bias in at least three out of the four tests and that 19 codons were significantly nonuniform in all four of our tests (see Materials and Methods and supplementary table S1, Supplementary Material online).
An Exponential Decay Model Most Accurately Describes Patterns of Codon Usage Bias
 relative to uniform) that an exponential decay model:
 , and x refers to the codon position relative to the start site with the start codon being equal to x = 1. Each parameter is specific to the individual codon and amino acid, hence the parameter subscripts
  . For clarity, however, we will simply refer to these parameters in the general sense as a, c, and τ. The model parameters have straightforward interpretations: a + c represents codon probability at the start codon, c is the asymptotic value that codon probability approaches, and τ is a measure of the distance over which the decay occurs. In figure 2A, we show example fits comparing the goodness of fit of the exponential decay and uniform models for the two phenylalanine codons. Further, in figure 2B, we show fits in the 5′-region (first 100 codons) for aspartic acid, phenylalanine, and glutamine to illustrate the heterogeneity of data and the best-fitting forms for several 2-fold redundant amino acids (see supplementary figs. S2–S18 and Supplementary Data and Supplementary Data, Supplementary Material online, for log-likelihood and AIC values for each codon). Although aspartic acid exerts no positional dependency (pD, which we mathematically define later), glutamine deviates sharply within a relatively short region of the gene sequences, whereas phenylalanine codons show a much slower decay with regard to position. The observation for aspartic acid and other amino acids such as histidine (supplementary fig. S5, Supplementary Material online) may be explained by the fact that the dominant codon at the genome-scale ends in a T (Bentele et al. 2013) and is therefore unlikely to be further enriched in the beginning of gene sequences. In both of these cases, aspartic acid and histidine, the dominant codon in highly expressed genes is also in contrast to the dominant codon in the genome, but because highly expressed genes are relatively few in number, the impact of this may be may be masked by genome-scale aggregation.
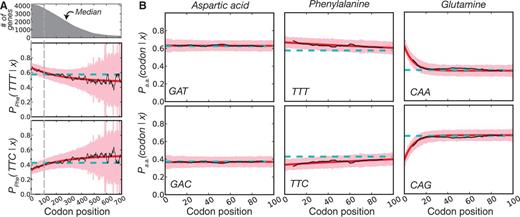
The functional form of codon usage bias. (A) For the amino acid phenylalanine, we show the conditional probability of observing a codon as a function of position (black line, smoothed with a sliding window of eight codons). We also show the best-fitting exponential model (red) with corresponding 95% confidence intervals (pink) and the uniform model (cyan, confidence intervals not shown for clarity). The survival curve of Escherichia coli gene lengths is highlighted at the top to illustrate the basis for increasingly wide-confidence intervals due to data sparseness at distal sites. (B) Data for three different 2-fold redundant amino acids as in (A) but with the x axis extending only to 100 codons to highlight heterogeneity in the 5′ region.
From this data, we also wish to make two further notes. First, if we restricted our analysis to a set of codon positions (e.g., the first 20, 50, and 100), we would possibly miss valuable information: Although 20 codons may be sufficient to encapsulate the positional heterogeneity for glutamine, it would be insufficient to faithfully evaluate phenylalanine. Second, this figure makes clear that the exponential decay model is not likely to be the simplest model, in terms of the number of parameters, to describe every individual amino acid. This can be seen by looking at aspartic acid: The exponential model fits the data very well, but the uniform model appears to fit equally well and does so with two fewer parameters. However, the uniform and linear models are simply unable to fit certain data (e.g., glutamine) making the exponential model a more general choice. For our model selection, we ask which model fits best for the set of all codons and arrive at the exponential decay model even though the fit is not necessarily the best/simplest for each individual codon (though it is the best for the overwhelming majority, see supplementary tables S2 and Supplementary Data, Supplementary Material online). In fact, the heterogeneity of parameters that we observe between amino acids was striking and unanticipated.
Intragenic Heterogeneity of Codon Usage Bias Is More Pronounced in Highly Expressed Genes
 (Taniguchi et al. 2010) to categorize low and high abundance proteins based on the top and bottom quartile of expression (see Materials and Methods, supplementary fig. S19, Supplementary Material online, for expression distribution). This delineation allows for sufficient separation of proteins, such that there should be no overlap between these two bins and each bin still encompasses enough genes, such that we have high confidence in the fits. Although this data set only contains measurements for
  of the E. coli proteome, it is the largest proteome level data set for E. coli that we are aware of and covers a wide distribution of expression levels. We separately calculated the best-fitting exponential parameters for each codon in each gene set. Using the three parameters of equation (1), we define a single metric—herein referred to as “pD”—that encapsulates the degree and magnitude of the heterogeneity in usage bias for a codoni into a single number (fig. 3A):
 obeys equation (1) with the parameter values obtained through maximum likelihood fits (see Materials and Methods). Essentially, our pD metric is an integral of the exponential function that is bounded by the median gene length, a limitation that we impose so as to have a high degree of confidence in the codon probability data, which gets increasingly noisy at distal sites. Positive values of pD correspond to codons used more frequently in the beginning of gene sequences, and negative values of pD correspond to codons used less frequently in the beginning relative to the end of genes.
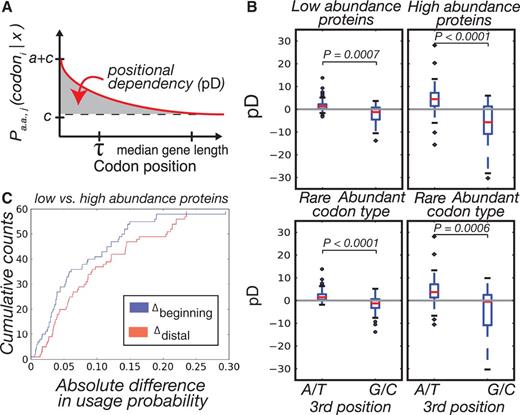
The effect of gene expression on position-dependent codon usage bias. (A) Illustration of the pD metric and exponential parameters. (B) pD of codons in the genes of low- and high-abundance proteins split according to codon prevalence (top) and third position base (bottom). We observe a significant difference in absolute pD of the codons between the two gene sets and differences within each gene set according to rare and abundant codons. Within gene sets, we also observed significant differences in pD between codons that end in A/T versus those that end in G/C. (C) For each codon, we took the absolute difference in codon probabilities between the low- and high-abundance protein data sets and did so at two different points, the beginning of sequences and the median. Shown are the cumulative distributions of these differences.
We compared the absolute values of pD for all codons in lowly and highly expressed genes and saw that highly expressed genes have significantly greater pD in their codon usage bias compared with lowly expressed genes (Wilcoxon signed-rank test,  ). Further, within both low and high expressing genes, we divided codons into two sets, which we term as “rare” and “abundant,” according to their usage within a reference set of highly expressed genes (Sharp and Li 1987). By this definition, rare codons are those whose frequency is less than random expectation in the reference set, and abundant codons are used at a frequency greater than expectation. We found a highly significant difference in pD values between these two codon sets within highly and lowly expressed genes (Wilcoxon rank-sum test,
  and
and  ; fig. 3B, top). Namely, the rare codons have positive values of pD and thus are enriched in the beginning of genes. This difference also persists when we use other metrics, such as the tRNA adaptation index (dos Reis et al. 2004), to classify codons (supplementary fig. S20, Supplementary Material online) and other delineations of lowly and highly abundant proteins such as the bottom and top 50% of protein abundances (supplementary figs. S19 and Supplementary Data, Supplementary Material online).
We also split codons into sets according to the identity of the third position base: A/T or G/C (fig. 3B, bottom). Again, the difference between these sets was significant for both low- and high-abundance protein sets ( and
and  , respectively) suggesting that the base composition of codons may play a role in determining the pD of codons and that this phenomenon is equally important in lowly and highly expressed genes.
 ) are smaller in magnitude when compared with the absolute differences in codon probabilities at a distal site (
 ) (Wilcoxon signed-rank test,
  ). Thus, in E. coli, lowly and highly expressed genes are more similar in their codon usage biases at the beginning of gene sequences than at distal sites. Assessing the generality of this finding will require high-quality proteome level data sets for other organisms that can be used to replicate this analysis.
Codon Usage Directly Affects mRNA Structure
To investigate the mechanistic basis for our findings, we next considered the effect of codon usage on mRNA structure. Several recent studies have illustrated that minimal secondary structure surrounding the start codon is important for translation initiation (Kudla et al. 2009; Gu et al. 2010; Bentele et al. 2013; Goodman et al. 2013). Throughout the rest of the mRNA sequence, this constraint does not exist, and, in fact, strong mRNA structure may be important for regulating mRNA half lives (Lenz et al. 2011). Given that structural demands are position dependent, we sought to determine whether codon choice affects structure and thus whether this constraint may be a factor promoting position-dependent codon usage bias (Tuller, Veksler-lublinsky, et al. 2011; Bentele et al. 2013; Goodman et al. 2013).
We therefore investigated the base pairing probability for each nucleotide in each gene within the high abundance protein set (calculated from the Boltzmann ensemble of structures, see Materials and Methods). We show that compared with synonymously shuffled null-model counterparts, actual genes have significantly less structure in the 5′-region (Wilcoxon rank-sum test on positions +5 to +15,  , fig. 4A). Additionally, we developed a synonymous shuffling method that preserves positional frequencies of codons (and thus GC content at each position) within the gene set (see Materials and Methods) and saw that this method also leads to significantly less pairing probability in this region (
 ) compared with the null model but still higher probability compared with actual genes (
 ). This method suggests that the codons enriched in the 5′-region of genes are less likely to participate in strong structural interactions.
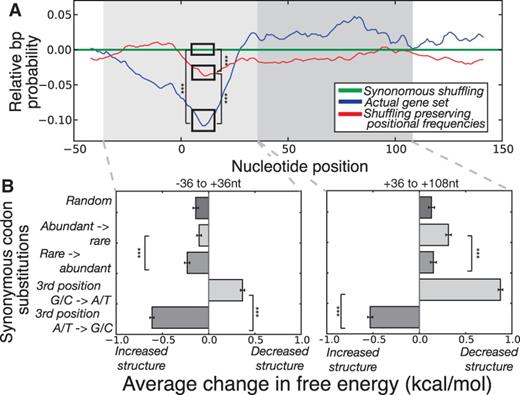
The link between codon usage bias and mRNA structure. (A) We folded a 200mer (−50 to +150 nt, relative to the start codon) region for each gene in the high abundance protein set and extracted the individual base pair probabilities. For clarity, we illustrate median pair probabilities relative to the null model created by synonymous shuffling within genes (green). Actual genes (blue) and an alternative gene set created by shuffling synonymous codons between genes in a manner that preserves positional biases (red) have significantly less structure in the 5′ region (Wilcoxon rank-sum test on raw data,  for all cases illustrated). (B) We calculated the effect on folding energy of single synonymous codon substitutions in the genes of high abundance proteins. Left: The effect of substitutions in the 5′ region (−36 to +36 nt, relative to the start codon) is variable depending on the nature of the codon. Right: The same analysis for a region distal to the start codon (+36 to 108 nt). For all cases illustrated, error bars represent standard error of the mean and
  according to Wilcoxon rank-sum test.
Because evolution is an iterative process, we sought to understand changes to structure in response to different types of mutations. We thus looked at the effect of all possible single synonymous substitutions in the first 12 codons on the folding energy of the −36 to +36 region of mRNAs from the highly abundant proteins (see Materials and Methods). In figure 4B (left), we show that random mutations in this region are likely to increase structure, again verifying a selective bias for minimal mRNA structure around the start codon. As we expected, single synonymous substitutions from G/C → A/T ending codons are more likely to decrease or maintain the structural properties of mRNA compared with third position A/T → G/C substitutions, which result in increased structure (Wilcoxon rank-sum test,  ) (Park et al. 2013). Interestingly, we also find that synonymous mutations from abundant → rare codons are less likely to introduce structure in the 5′-region compared with mutations from rare → abundant codons (Wilcoxon rank-sum test,
  ) suggesting that the usage of rare codons helps to maintain minimal secondary structure in this region, likely a result of their base composition which supports recent findings (Bentele et al. 2013; Goodman et al. 2013).
We repeated the above mutation simulation for a region distal to the initiation codon (+36 to +108, mutating the 12 codons from +72 to +108 region for direct comparison to our findings in the initiation region). At these distal sites, we confirmed that random mutations tend to decrease structure (fig. 4B, right). In contrast to the 5′-region, distal gene regions are more likely to tolerate substitutions which preserve their strong structure (i.e., substitution to G/C rich and/or abundant codons). This analysis supports our hypothesis that synonymous codon choice affects mRNA structure and that requirements for reduced structure in the 5′-region of transcripts may result in selection for a unique codon set. As opposed to previous studies (Tuller, Veksler-lublinsky, et al. 2011) that investigated structural robustness with regard to transcriptional fidelity, we show that robustness of the gene sequences to different substitutions depends on the position along a gene as well as the type of substitution. This likely has a mechanistic basis in translation initiation where mRNA structure around the start codon is potentially a rate-limiting barrier. Because most RNA structure is the result of local interactions, this effect should be applicable within a narrow window of codons/nucleotides that surround the start codon.
Position-Dependent Bias in tRNA Usage
The previous results, along with several recent studies (Bentele et al. 2013; Goodman et al. 2013), lend clear support for the hypothesis that mRNA structural constraints play an important role in shaping codon usage patterns. However, the parameter heterogeneity observed in figure 2, and in particular the large τ values—the length that it takes codon usage bias to reach its asymptotic value—that we found for some codons, suggests that mRNA structure alone is likely insufficient to explain all of the observed positional dependencies.
In most cases, the 2-fold redundant amino acids are read by one tRNA species via wobble-rule base pairing, so the results presented in figure 2 essentially represent variation in codon usage given a particular tRNA. Interestingly, we note that in E. coli K12, the only 2-fold redundant amino acid to have two different tRNA anticodons is glutamine, the amino acid with the sharpest pD in figure 2. To test for the possibility of a translational ramp or bottleneck consisting of slowly translated codons at the 5′-end, we turned to 4-fold degenerate amino acids, which are frequently read by at least two different tRNA species (one that predominantly reads purines [A and G] and another that reads pyrimidines [T and C] according to wobble-base pairing). pD in these groups of codons would represent between tRNA variation in codon usage as opposed to the within tRNA variation that we previously observed for 2-fold redundant amino acids.
If AT/GC content variation is the main driver of codon usage patterns with regard to position, we expected that grouping the purines and the pyrimidines separately would lead to relatively uniform usage patterns with regard to position for these separate “tRNA-classes,” though we expect the class of codons read by rarer tRNAs to be less frequent overall as has been previously observed (Ikemura 1981). However, because the tRNAs that read these two groups of codons are often present at different concentrations, if there is a benefit to slow translation in the 5′-region, we would expect codons that are predominantly read by the less abundant tRNAs to be enriched in this region. What we observe for nearly all cases is that the rarer tRNA group (quantified by the cumulative gene copy number of the cognate tRNAs [tRNAGCN]) is indeed enriched in the beginning of coding sequences (fig. 5). Further, the position-dependent usage of codons read by different tRNA species occurs over a relatively long range and not the narrow window that would be expected to influence mRNA secondary structure around the start codon. We repeated the above analysis for 6-fold redundant amino acids and reach the same conclusion (supplementary fig. S22, Supplementary Material online). Although we did not observe any instance of codon groups read by abundant tRNAs being enriched at the 5′-end, there are several cases, such as for the amino acids threonine and serine, where we do not observe either enrichment or depletion of codon groups even though tRNA gene copy numbers are heterogeneous. While further investigation might resolve some of these differences, these data nevertheless suggest that in addition to structural requirements, codons read by rare tRNAs are enriched at the 5′-end of genes.
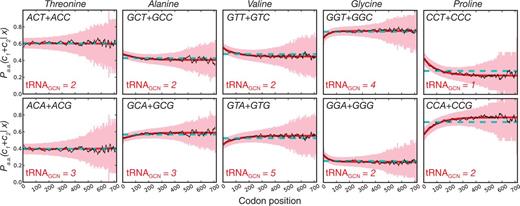
pD in codon groups and its association with cognate-tRNA gene copy number. For all 4-fold redundant amino acids, we group codons into separate sets under the assumption that single tRNA species are more likely to read codons within these groupings according to wobble-base pairing than between groupings. We illustrate conditional probabilities as in figure 2 and highlight the gene copy number of the cognate tRNAs for each group (tRNAGCN) to show that codons read by the rarer tRNAs are enriched in the 5′ region.
Intragenic Codon Usage Bias Can Be Used to More Accurately Predict Gene Expression
Our findings support a new understanding of codon usage bias: that codon preferences vary with regard to intragenic position, that this variation is partially but not entirely based on the structural requirements of mRNA, and that intragenic variation is particularly pronounced in highly expressed genes. Others have noted (Gu et al. 2010), and our analysis corroborates, that there are differences in both codon usage and mRNA structure between lowly and highly expressed genes at the beginning of coding sequences. Here, however, we have shown that the magnitude of codon usage bias differences between lowly and highly expressed genes at the beginning of genes is smaller than the equivalent differences at distal sites—suggesting that the pressure for minimal mRNA structure in the region surrounding the start codon is relatively stronger than the need for efficient or accurate translation of individual codons. In lowly expressed genes, selection for accurate or efficient translation may be dwarfed by other evolutionary processes such as biased mutation and genetic drift. However, in highly expressed genes, the balance of these forces may be tipped in favor of selection for individual codons (fig. 6A). If this is indeed the case, accounting for heterogeneity in codon usage preferences should improve the accuracy of existing codon usage bias models.

Accounting for position-dependent codon usage leads to superior estimates of gene expression levels. (A) Our model posits that selection for reduced mRNA structure around the start codon acts strongly on all sequences relative to disruptive processes such as genetic drift and mutational biases. However, preference for accurate and efficient translation is a second and weaker effect that is largely apparent in highly expressed genes and becomes stronger distal sites. (B) Rather than to calculate the CAI for each gene, we aligned genes at the start codon and calculated the CAI score for each position in either the reference set or genome. The dip in adaptedness after the start codon for both data sets (blue) is corrected by using exponential fits to the codon usage in the reference set (red). (C) For two data sets of transcript abundances (Taniguchi et al. 2010; Shiroguchi et al. 2012) and two data sets of protein abundances (Lu et al. 2007; Taniguchi et al. 2010), we show that the R2 correlation coefficient between the CAI and gene expression data is increased when using exponential fits to calculate the CAI as opposed to the traditional uniform assumption. Top, raw values; bottom, % increase. Error bars show standard deviation from 10,000 bootstrap resampled sets (paired t-test,  for all cases).
There are many strategies to identify and quantify codon usage bias (dos Reis et al. 2004; Qian et al. 2012); here, we attempt to incorporate these positional dependencies into one of the most popular methods: the CAI (Sharp and Li 1987). The CAI relies on a reference set of highly expressed (Sharp and Li 1987) or highly biased (Carbone et al. 2003; Raiford et al. 2010) genes to determine a coefficient for each codon that is based on the frequency of codon usage in the reference set. The coefficient takes a single value for each codon in the classical approach corresponding to the uniform assumption of codon usage bias. In contrast, we fit our exponential decay model, equation (1), to the same reference gene set and use these position dependent functions in place of the single value approach (see Materials and Methods).
First, we observed that the reference set of genes has highly skewed codon usage biases (supplementary fig. S23, Supplementary Material online) and show that calculating the CAI at each position within the reference set (rather than for each gene) leads to a noticeable dip in CAI shortly after the start codon (fig. 6B, blue dashed line). To understand why this result is slightly paradoxical, it is important to note the rationale behind the CAI: the model is a distance metric that calculates how well the codon usage patterns of a given gene match the codon usage patterns of a reference set of genes that are known to be highly expressed. However, we have shown here that the codon usage patterns of the reference set are inadequately described by a single number for each codon, and therefore, we hypothesize that the distance metric should account for position-dependent codon usage. This hypothesis makes a strong prediction: if the position-dependent codon usage biases are of physiological relevance, accounting for this should lead to more accurate predictions of gene expression. However, if the position-dependent codon usage biases that we observe in the reference set are overfitting to noise or are simply of no consequence, we would expect our predictions of genome-wide transcript and protein abundances to be worse.
We thus utilize our exponential fits to the reference (training) set to come up with a position-dependent array of coefficients for each codon, termed the position-dependent CAI (pdCAI) model. One caveat with this methodology is that we limit our analysis to the final codon position of the longest gene in the reference set, as we are unable to say how codon preferences in our reference set of genes might extrapolate past this point. Thus, for a given test-set gene, we only include the codons up to position 705 in our calculation of the pdCAI (though we note this cutoff encompasses the entirety of  of endogenous E. coli genes [fig. 2A, top]). Otherwise, we follow the same mathematics and logic behind the original CAI and show that, as expected, our pdCAI (or spatial CAI) model corrects the dip in codon adaptedness for both the reference set and the whole genome when the calculation is performed in a way that treats all codons of a given position as a gene (fig. 6B, red lines).
It is still unclear whether our correction leads to superior estimates of physiologically interesting properties. Namely, the usage of a rare codon early in a gene sequence will boost the genes overall CAI score in our model, whereas this usage will be penalized by the standard CAI. In figure 6C, we show that in two distinct data sets of E. coli transcript abundances (Taniguchi et al. 2010; Shiroguchi et al. 2012) as well as two distinct data sets of protein abundances (Lu et al. 2007; Taniguchi et al. 2010), our pdCAI model makes more accurate predictions than the traditional approach with percent increases in the range of 10–25% (bootstrap resampling followed by paired t-test, for all cases  ). Further, in addition to providing robust improvements in predictive power across several data sets, this increase in predictive power is also robust to an entirely different choice of reference set (Carbone et al. 2003) (see supplementary fig. S24, Supplementary Material online).
Discussion
The pervasive understanding of codon usage bias assumes that rare codons are suboptimal, and their usage is thus minimized in coding sequences, particularly those of highly expressed genes. Our work suggests that this notion of globally “optimal” or “suboptimal” codons is misguided and that observed codon preferences are actually the result of contrasting forces, the magnitude of which varies significantly with distance from the start codon. A codon may at once be optimal with regards to translational efficiency and/or accuracy, but suboptimal with regard to secondary structure, all of which makes a blanket term of “optimality” problematic in light of ours and other recent results (Cannarozzi et al. 2010; Bentele et al. 2013; Goodman et al. 2013).
By modeling individual codon probabilities, we uncover a unifying functional form to codon usage bias. We find an unexpected heterogeneity in the easy-to-interpret parameters for the exponential decay function for different codons within E. coli. These results question the utility and validity of defining the 5′-region by an arbitrary window of codons surrounding the start codon and treating this region as “distinct.”
We draw a link between codon usage and mRNA structure and support previous findings by showing that the conflicting demands for and against mRNA structure at different positions likely contributes to synonymous codon selection (Tuller, Veksler-lublinsky, et al. 2011; Bentele et al. 2013; Goodman et al. 2013). By itself, this is a rather unsurprising fact because RNA secondary structure is the result of base pairing interactions, and synonymous codons are composed of different bases. However, statistical investigations to support this assertion have until very recently been lacking. Our methodology is distinct and complementary to several recent studies that have investigated this link, and we draw largely similar conclusions: Codon choice has a clear impact on secondary structure and empirical codon usage biases reflect competing demands for and against secondary structure at different gene positions (Tuller, Veksler-lublinsky, et al. 2011; Bentele et al. 2013; Goodman et al. 2013).
In contrast to these recent studies that focus on the prominent role of mRNA structure in shaping 5′-codon usage biases, we also show that mRNA structural constraints are likely inadequate to account for the heterogeneity in codon usage biases that we observe. Nucleotides distal to the start codon are unlikely to participate in secondary structure around the initiation region, which made the observation that several codons vary in their usage at relatively distal sites seem paradoxical. However, we show that codons read by less abundant tRNAs are also enriched in the 5′ of coding sequences. This finding could be interpreted as support for the translational bottle-neck hypothesis, whereby enrichment of rarely used codons in the beginning of coding sequences could serve as a mechanism to space out ribosomes during translation so as to avoid collision. Another possible mechanism for the observed positional dependencies stems from the fact that different tRNAs vary in their misreading rates (Shah and Gilchrist 2010). Errors in translation are likely to be more costly at sites distal to the start codon, and this could lead to stronger selection with increasing gene length (Stoletzki and Eyre-Walker 2007). Teasing apart these two possibilities will require further investigations.
We note that although position-dependent codon usage bias had previously been observed, the majority of literature on codon usage bias has either ignored this fact or treated it as relatively inconsequential (Gingold and Pilpel 2011; Plotkin and Kudla 2011). Our framework allows position-dependent codon usage biases to be incorporated into existing models, which we demonstrate here by redefining the popular CAI. Our aim here is not to develop a model to predict protein abundances with maximal accuracy. Rather, we aim to show that the increased accuracy that we see is supportive of the fact that the 5′ usage of rare codons in the reference set and in the genome at large is likely beneficial in some regard. Additionally, this result allows us to show that positional dependencies are far from inconsequential, and that they can be accounted for with relatively simple changes to existing models. We anticipate that more thoroughly investigating the pdCAI model with regard to different reference set choices and possible perturbations regarding how to most efficiently treat the decreasing confidence of our reference set fits at distal codon positions (which is particularly problematic for small gene sets) may result in further improvements. All of the predictive improvements that we report are of endogenous transcript/protein levels, but the CAI model is frequently used in evaluating and designing recombinant proteins. The improvements that we demonstrate may, therefore, have utility in this field as well, though proper evaluation will require careful experimental controls to account for confounding issues such as mRNA structure around the start codon.
Additionally, although we focused here on intraorganism codon usage biases, the findings presented are likely not unique to E. coli. Toward this end, we repeated our model selection analysis on 18 other microbial genomes randomly chosen to sample diverse taxa and found that the exponential decay model of codon usage bias is systematically selected as a better fit to the data than the uniform model (fig. 7A, supplementary table S4, Supplementary Material online). Although this fact alone may be unsurprising given known differences in AT/GC skews at the 5′-end of genes, further investigation of how pD varies with organismal GC content, genome size, average gene lengths, and so on may reveal unexpected patterns. Additionally, we note as one example that the distribution of τ values for E. coli vary over a much larger range than equivalent values from Pseudomonas aeruginosa (fig. 7B). Values of τ on the order of 10–100 are most likely indicators of the structural importance of mRNA, and because P. aeruginosa is a relatively G/C-rich organism, we hypothesize that enrichment of A/T rich codons in the beginning of genes could conceivably account for the majority of pD that is observed for this organism. Conversely, large τ values (e.g., >103) are the result of codons with little or no pD, of which there are far more in E. coli than P. aeruginosa. The generality of our method and the ease of parameter interpretation suggest that comparative genomics investigations into interspecies parameter heterogeneity may yield novel insight into the forces that shape and constrain microbial genome evolution.
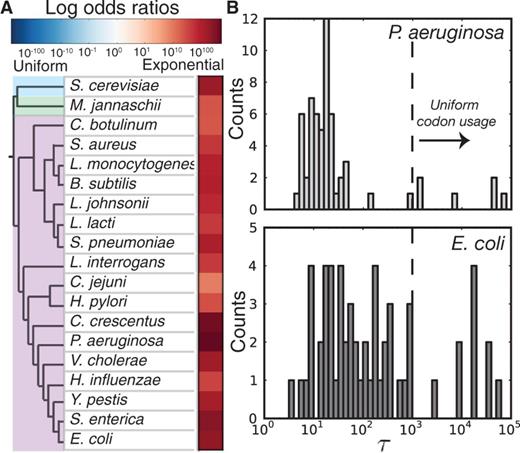
Position-dependent codon usage bias in multiple organisms. (A) The observed log odds ratios for the exponential decay model fits relative to uniform model for different organisms. (B) The distribution of τ values for E. coli and P. aeruginosa highlights potential differences in the evolutionary forces that have shaped the respective genomes.
The effect of specific sequence features on a given gene’s expression level is highly context dependent (Salis et al. 2009), and a multitude of factors shape the usage of codons within genes—many of which are undoubtedly particular to individual regulatory contexts or protein specific constraints (Frenkel-Morgenstern et al. 2012; Pechmann and Frydman 2012; Kosuri et al. 2013; Mutalik et al. 2013; Xu et al. 2013; Zhou et al. 2013). However, we have uncovered a clear global pattern of codon usage within genes that is dependent on location and is partially related to differential requirements for mRNA structure. We anticipate that our results will be highly relevant in the field of synthetic biology and in genome engineering applications for which organism-specific sequence design is an important consideration. Further, the quantitative description of codon usage biases that we have outlined here can help to serve as a testing ground for evolutionary investigations into the complex origins of codon usage bias within and between species.
Materials and Methods
![formula]() Test of Significance for Uniformity in Codon Usage Bias
Test of Significance for Uniformity in Codon Usage Bias
 value:
 according to Bonferroni multiple-testing correction, which is calculated from the number of tests (59) at a significant P value
  .
.Binning Schema
First, we lined genes up at the start codon and searched for an initial bin width that would contain approximately 130,000 codons (the entire E. coli genome contains approximately 1,300,000 codons, thus ten equal-sized bins required approximately 130,000 codons per bin). The algorithm starts with codon position one of all genes and if there are less than 130,000 codons then we add position two, etc. Once we found a bin width that contains more than 130,000 codons, we compare the bin with the previous width and choose the bin size that is closest to the target number (in this example: 130,000). We then start our next bin at the next position and iterate until the entire genome is partitioned with each codon position occurring in one and only one bin. In figure 1B, the first bin encompassed positions 1–34 of all genes, and bins were progressively wider at distal regions to account for fewer genes and thus less data at these sites. It should be noted that one potential limitation of the  arises when bins contain fewer than five counts. In our published bin scheme, however, every bin for every codon has far more than actual ten observations. Further, not content with selecting a bin scheme arbitrarily, we investigated a variety of other target bin numbers and sizes and found that these did not affect the results of figure 1 (supplementary fig. S1, Supplementary Material online).
Scrambling Genes to Determine Expectation
For each gene, we followed a commonly used synonymous codon shuffling algorithm where codons that code for the same amino acid were randomly shuffled within genes. Thus, in a scrambled genome, each gene codes for the same amino acids and does so using the same frequency of each codon. This procedure allows us to preserve possible selection for or against particular codons or GC content within particular genes and to isolate the variable of interest, which in our case is the deviation of spatial uniformity in codon usage bias. The expected counts in figure 1 were calculated from 200 scrambled genomes.
We also developed a novel synonymous codon shuffling method that we used to interrogate mRNA structure in figure 4: Rather than shuffle synonymous codons within a gene, we allow for shuffling of codons between genes as long as the codons occur at the same position. This method preserves the amino acid structure of each gene but not codon usage within genes. Rather, the method preserves positional codon frequencies of the gene set while introducing a similar number of codon changes per gene. Thus, were we to conduct the analysis in figure 1 using this as a null model, counts per bin for each codon would be identical between all shuffled genomes as well as in the actual genome.
Other Statistical Tests of Codon Usage Bias
We performed three other statistical tests to determine whether any given codon was significantly nonuniform in its usage bias. All of the following required lining the genes up at the start codon as before but neither require binning of codons, which was necessary for the  test.
test.
In the median test, we simply asked (for each codon) at which codon position the median codon in the genome occurs at. Thus, if a codon appears 1,000 times, we wanted to know at what position the 500th codon falls. We did this for the 200 scrambled genomes and found a discrete uniform distribution that allowed us to measure the deviation from the mean of this distribution that was observed in the actual genome. A median closer to the start than expected would imply that this codon occurs more frequently in the beginning of genes than random expectation. The significance of this deviation was calculated via a two-tailed significance test.
In the AUC and the d-value tests, we relied on a cumulative distribution function (CDF) of codon counts where the x axis is the absolute codon position rescaled to 1 and the y axis is cumulative counts of the codon of interest rescaled to 1. If a codon occurred equally throughout the genome and all genes were of equal length, then perfect uniformity in usage would result in a diagonal line in the CDF and the AUC would equal 0.5. A codon occurring more in the beginning would have an AUC more than 0.5, whereas a codon occurring at the end of genes would have an AUC less than 0.5. However, because genes are not of equal length, the AUC was far greater than 0.5 due to the fact that few genes are represented at distant codon positions. However, we again assessed the significance of the actual genome findings by comparing against the AUC for 200 scrambled genomes, which resulted in a normal distribution of values to test our observed value against.
Lastly, using the CDF of scrambled genomes, we determined the “average” CDF and found the absolute value of the largest deviation from this average CDF when plotted against the actual genome (the largest y axis deviation regardless of where it occurred). Unlike the median and AUC tests, the distribution of the randomized genomes was not normal because they were absolute values but a one-tailed test allowed us to determine the significance of the actual genome compared with the expectation from 200 scrambled genomes. Crucially, we observed a large degree of overlap between these tests with the χ2 test being the most conservative estimate and the d value the least (supplementary table S1, Supplementary Material online).
Maximum Likelihood Estimation of Model Parameters
 . We considered uniform, linear, step function, and exponential models for this codon usage probabilities. These models, each consisting of i functions (one for each codon i) of model parameters
  and location x, are defined as:


 as a,
as a,  as τ, and
  as c in the main text.
 , giving rise to the probability density function):
 and
and  are the vectors comprising nik and Njk for all codon locations k.
 for each of the four models by finding the parameter set that maximizes this log likelihood:
Model Selection

 is the maximized likelihood for the estimated model. AIC is a relative measure of information loss caused by using the model to describe reality. The model with the minimum AIC value is the most likely model to minimize information loss compared with the underlying true process (Burnham 2004). The relative probability
  of model M minimizing the information loss is given by:
For all data sets of all organisms we investigated, we calculated the AIC value for each of the four tested models. First, we fit the codon usage probability function using MLE to each codon. We obtained the log likelihood for the entire model by summing the log likelihoods of the individual fits. The total number of free parameters is the number of codons times the parameters in the model for a single codon. After calculating the AIC values in this manner, we also calculated relative odds of each model to minimize information loss according to equation (14).
mRNA Structural Calculations
All free energy calculations were calculated using the RNAfold method of ViennaRNA (Hofacker 2003) with default parameters. To extract the Boltzmann distribution of sequences, we used RNAsubopt (Hofacker 2003) and the −p 1000 flag.
For mutation studies, we used the transcript sequences of the 500 highly expressed genes. For each gene, we iterated through the codons within a region of interest (either 0 to +36 nt, or +72 to +108 nt), and if it matched the identified criteria (i.e., in the rare set), we swapped it to a synonymous counterpart with the desired criteria (i.e., in the abundant set). With one swap per gene, we refolded and calculated the minimum free energy (MFE) of the structure and subtracted this from the original MFE for that sequence to determine the change in free energy from this substitution. We repeated this process for all applicable codons within the entire gene set to arrive at the distributions in figure 4.
For pair probability calculations, we created five separate scrambled genomes and aggregated the results to compare the actual pair probabilities to those calculated from scrambled sequences. We fold each gene (−50 to +150 relative to start) and for each base calculate the number of sequences out of 1,000 which that the base is paired. For each position, we thus have a distribution of values (one value representing the pair probability from each gene for that position) that we compare to the distribution created using synonymous shuffling algorithms.
Protein and Transcript Expression Data
We downloaded the publicly available data sets of protein abundances in E. coli, calculated from single molecule fluorescence counting of Taniguchi et al. (2010) and mass-spectrometry of Lu et al. (2007), and used the former data set to classify proteins as low and high abundance due to the greater size of the data set. After mapping genes back to the genome, we were left with a data set of 1,001 protein abundances that we split according to either the quartiles or median expression. Additionally, data of transcript abundances were downloaded from Taniguchi et al. (2010) and Shiroguchi et al. (2012) and again filtered for genes that we were able to map back to the genome. All of these data sets encompass only a subpopulation of the transcriptome/proteome, but because each experimental technique has unique biases and limitations that restrict the subpopulations that they can measure, it is not safe to assume that genes which could not be quantified are either lowly or unexpressed. We thus only include genes for which measurements from the data set in question exist.
Calculation of the CAI
 ) with a position dependent function
  . The function used here is the maximum likelihood estimation of the exponential decay function for each codon. The relative synonymous codon usage (RSCU) in our pdCAI is then:
Additionally, based on the original formulation of the CAI, we use the RSCU of codons in the reference set to determine rare and abundant codons (Sharp and Li 1987). RSCU values less than 1 are categorized as rare and greater than 1 are categorized as abundant.
Calculation of the tRNA Adaptation Index

Acknowledgments
The authors thank E. Sontheimer, J. Brickner, and K. Tyo for discussions and critical reading of the manuscript. This work was supported by the National Institutes of Health (Grant Number R00GM081450), the National Science Foundation (Grant Number MCB-0943393), the David and Lucile Packard Foundation (2011-37152), and the National Institutes of Health training grant in Cellular and Molecular Basis of Disease (2-T32GM008061-31) to A.J.H.
References
Author notes
†These authors contributed equally to this work.
Associate editor: Yuseob Kim
