


Abstract
Misregulation of gene expression is often observed in interspecific hybrids and is generally attributed to regulatory incompatibilities caused by divergence between the two genomes. However, it has been challenging to distinguish effects of regulatory divergence from secondary effects including developmental and physiological defects common to hybrids. Here, we use RNA-Seq to profile gene expression in F1 hybrid male larvae from crosses of Drosophila melanogaster to its sibling species D. simulans. We analyze lethal and viable hybrid males, the latter produced using a mutation in the X-linked D. melanogaster Hybrid male rescue (Hmr) gene and compare them with their parental species and to public data sets of gene expression across development. We find that Hmr has drastically different effects on the parental and hybrid genomes, demonstrating that hybrid incompatibility genes can exhibit novel properties in the hybrid genetic background. Additionally, we find that D. melanogaster alleles are preferentially affected between lethal and viable hybrids. We further determine that many of the differences between the hybrids result from developmental delay in the Hmr+ hybrids. Finally, we find surprisingly modest expression differences in hybrids when compared with the parents, with only 9% and 4% of genes deviating from additivity or expressed outside of the parental range, respectively. Most of these differences can be attributed to developmental delay and differences in tissue types. Overall, our study suggests that hybrid gene misexpression is prone to overestimation and that even between species separated by approximately 2.5 Ma, regulatory incompatibilities are not widespread in hybrids.
Introduction
Interspecific hybrids have a wide range of fitness values and display diverse phenotypes. In plants, hybridization can be important in adaptation and speciation (Rieseberg and Willis 2007; Soltis and Soltis 2009). Animal hybrids, however, often display deleterious incompatibility phenotypes such as sterility and lethality (reviewed in Maheshwari and Barbash 2011). Hybrids with Drosophila melanogaster have been intensively studied due their ease of manipulation and suite of incompatibilities (Barbash 2010). F1 daughters of D. melanogaster females crossed to D. simulans males are fully viable at lower temperatures, progressively lethal at higher temperatures, and are completely sterile. The F1 sons are fully lethal, dying as larvae. Strikingly, all of these incompatibility phenotypes can be at least partially suppressed by mutations in the X-linked D. melanogaster gene Hybrid male rescue (Hmr).
Hmr encodes a putative DNA- or chromatin-binding protein that localizes to heterochromatin and represses expression of selfish DNA repeats including transposable elements and satellite DNAs (Thomae et al. 2013; Satyaki et al. 2014). Population genetic studies demonstrate that Hmr has diverged under positive selection in both D. melanogaster and D. simulans (Barbash et al. 2004). Antagonistic interactions with selfish elements are therefore a potential cause of the rapid evolution of Hmr. However, it is unclear how this heterochromatic function in pure species relates to hybrid lethal activity. In fact, whether Hmr function is the same in parental species and their F1 hybrids remains a long-standing question in hybrid incompatibility studies (Maheshwari and Barbash 2011).
Gene expression analyses have been applied to D. melanogaster/D. simulans and other hybrids with distinct objectives in mind. One is to gain a better understanding of the physiological and developmental differences between hybrids and parental species. For example, D. melanogaster/D. simulans female hybrids show a reduced expression of female-biased genes, consistent with their lacking functional ovaries (Ranz et al. 2004). Other studies have found downregulation of male-biased genes in sterile hybrid sons (Michalak and Noor 2003; Haerty and Singh 2006; Moehring et al. 2007; Llopart 2012). A second goal has been to identify genes that significantly differ from parental levels, to find candidate genes that have undergone regulatory divergence (Ranz et al. 2004; Landry et al. 2005; Lai et al. 2006; Renaut et al. 2009). The ability to quantitate allele-specific expression in hybrids further allows one to distinguish the relative roles of cis- and trans-regulatory evolution (Wittkopp et al. 2004; Graze et al. 2009; McManus et al. 2010).
In addition, several gene expression analyses have attempted to identify specific regulatory pathways where misexpression causes or contributes to hybrid incompatibility. Hybrid male sterility has been extensively studied and has revealed that sterility can often occur with only few genes misregulated, especially for hybrids of closely related species in the D. simulans species complex (Michalak and Noor 2003; Haerty and Singh 2006; Moehring et al. 2007). Hybrid lethality is less well characterized by genome-wide approaches. To address the extent of misregulation specifically associated with hybrid lethality, a microarray study compared gene expression in lethal and viable D. melanogaster/D. simulans hybrids and found only a handful of genes different between the two (Barbash and Lorigan 2007). However, because hybrids often have gross physiological defects, rarely can these studies disentangle direct misregulation from effects that are downstream consequences of the incompatibility phenotype.
Here, we analyze RNA-Seq data in D. melanogaster/D. simulans hybrid males to contrast the role of Hmr in pure species and hybrids, to determine the expression differences in hybrids that are associated with Hmr-induced lethality, and to characterize aberrant gene expression that is inherent to hybrids irrespective of lethality. First, we identify genes misregulated in Hmr mutants relative to wild-type D. melanogaster male larvae (mel-Hmr– and mel-Hmr+, respectively) and genes differentially expressed between viable Hmr– and lethal Hmr+ hybrid larvae (hyb-Hmr– and hyb-Hmr+, respectively). Comparing these gene lists allows us to determine the functional overlap of Hmr in the D. melanogaster and hybrid backgrounds. Second, we distinguish the expression of the D. melanogaster and D. simulans alleles in hybrids, to determine allele-specific differences. Third, we evaluate the extent to which development contributes to the observed expression differences between hybrids. Fourth, we identify regulatory differences in putative Hmr targets between the species. Finally, we integrate the hybrid analyses with studies of gene expression divergence between D. melanogaster and D. simulans. Altogether, we find that 1) Hmr does not maintain pure-species function in hybrids, 2) viable (Hmr–) hybrids are associated with an excess of genes where only the D. melanogaster allele is downregulated, and 3) after accounting for development and tissue differences and intraspecific divergence, the number of genes in hybrids that are nonadditive or expressed outside of the parental range is surprisingly low.
Results
Hmr Has Different Effects on D. melanogaster and Hybrid Genomes
To identify genes regulated by Hmr in D. melanogaster, we compared the transcript level between mel-Hmr– and mel-Hmr+ male larvae. Although very few genes (n = 40) are significantly different, they show a strong bias with 30 upregulated and only 10 downregulated in mel Hmr– (fig. 1A). The extent of upregulation ranges from 1.53-fold to 8.10-fold. In this set of 40 candidate Hmr targets, genes located in pericentric heterochromatin are significantly overrepresented when compared with the whole genome (9/40 = 22.5%; Fisher’s exact test [FET] P = 6.40e-4). With the exception of one, all of these heterochromatic genes are upregulated in mel-Hmr–. These results differ from analyses in ovaries, where heterochromatic genes are slightly downregulated in Hmr mutants (Satyaki et al. 2014). It is unclear whether this is because of sex-specific differences and/or differences between germline and somatic gene regulation. We note though that both studies agree on the relatively weak effect Hmr has on protein-coding genes, in contrast to its major effects on transposable element expression.
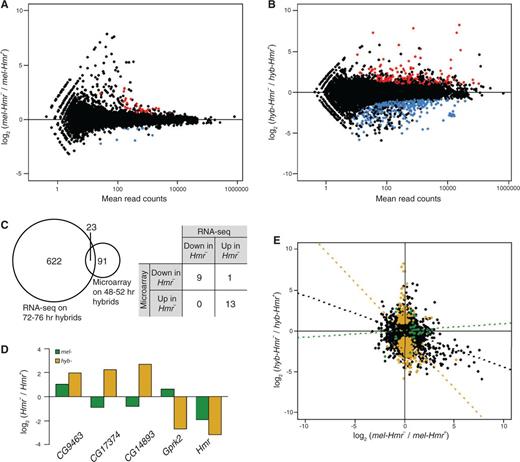
Differential expression between Hmr+ and Hmr– in Drosophila melanogaster and hybrid male larvae. (A) Each dot represents the log2 of the fold difference in expression of each gene in mel-Hmr– relative to mel-Hmr+, plotted against the expression level calculated as mean number of reads. Red indicates genes significantly upregulated and blue significantly downregulated in mel-Hmr–. (B) Same analysis as in part (A), for hyb-Hmr– relative to hyb-Hmr+. (C) Left, overlap of differentially regulated genes between hyb-Hmr– and hyb-Hmr+ identified in this RNA-Seq study and in a previous microarray study (Barbash and Lorigan 2007). Right, comparison of the direction of change for the 23 overlapping genes. (D) Comparison of the direction of change for the five genes that are significant in both (A) and (B). Green, mel-Hmr– relative to mel-Hmr+; yellow, hyb-Hmr– relative to hyb-Hmr+. (E) Correlations between fold differences of the mel (A) and hyb (B) comparisons for the whole transcriptome (black, Pearson’s r = −0.257), for genes significantly misregulated in mel-Hmr– from (A) (green, r = 0.079), and for genes significantly different between hybrids from (B) (yellow, r = −0.310).
A strikingly different pattern is observed when we compared hyb-Hmr+ with hyb-Hmr– male larvae. Not only are many more genes differentially regulated (n = 622) between the hybrids than between pure species, the opposite bias is observed: significantly fewer genes are upregulated than downregulated in hyb-Hmr– (210 upregulated vs. 412 downregulated, P = 8.383e-09 FET; fig. 1B). Furthermore, only 23 (3.70%) of the differentially regulated genes are heterochromatic, which is not significantly different than the genome-wide proportion of heterochromatic genes (FET, P = 0.1143). Barbash and Lorigan (2007) used microarrays to compare expression of the same two hybrid genotypes but at an earlier developmental time. They identified a substantially smaller set of 91 genes differentially regulated between the hybrids. Although only 23 are shared between the data sets, the microarray and our experiments agree on the direction of misregulation, with the exception of one gene (fig. 1C). Gene ontology terms identified here include chitin- and cuticle-related processes (table 1).
Gene Ontology Terms Overrepresentated among Genes Differentially Expressed between Lethal and Viable Hybrids.
| Gene Ontology Terms | No. | Genes |
|---|---|---|
| Biological Processes | ||
| Chitin metabolic process, amino sugar metabolic process, glucosamine-containing compound metabolic process, and aminoglycan metabolic process | 19 | Mur2B, CG8192, obst-G, CG10154, CG10140, obst-F, CG7298, CG6996, CG14608, Cht5, CG14880, CG7714, CG7715, CG6403, CG13643, Muc26B, Muc96D, CG32284, obst-H |
| Cellular anion homeostasis, cellular acyl- CoA homeostasis, anion homeostasis | 5 | CG8814, CG8629, CG15829, CG5804, CG8628 |
| Cellular Components | ||
| Extracellular region | 62 | Argk, Gld, Lsp1alpha, Lsp2, y, Drs, PebIII, pnut, cher, Ag5r, Lcp65Ag1, Mur2B, TotA, prc, CG9400, CG5177, spz3, CG8192, CG5550, yellow-d2, Ilp2, obst-G, CG10154, CG10140, Ilp8, obst-F, CG7298, CG6996, Spn77Bc, CG11131, CG14608, beat-Vb, Cht5, CG14880, CG7714, CG7715, burs, Ccap, CG13618, CG11852, TwdlP, TwdlO, TwdlN, CG6403, CG14258, Obp99a, Obp99d, Obp99b, capa, CG13643, Muc26B, Peritrophin-15a, yellow-e, TotC, Muc96D, CG32284, QC, TwdlX, Twdlalpha, NLaz, obst-H, Cpr47Eg |
| Contractile fiber | 8 | Actn, Mp20, Prm, Mlp84B, Pglym78, Scgdelta, CG14207, Mhc |
| Contractile fiber part, myofibril | 7 | Actn, Prm, Mlp84B, Pglym78, Scgdelta, CG14207, Mhc |
| Extracellular matrix | 11 | Mur2B, prc, CG5550, Muc68Ca, TwdlP, TwdlO, TwdlN, Muc26B, Muc96D, TwdlX, Twdlalpha |
| Sarcomere | 6 | Actn, Prm, Mlp84B, Pglym78, CG14207, Mhc |
| Molecular processes | ||
| Structural constituent of chitin-based cuticle, structural constituent of cuticle | 32 | Lcp4, Edg91, Ccp84Ag, Ccp84Ab, Ccp84Aa, Lcp65Ag2, Lcp65Ag1, Lcp65Af, Lcp65Ac, Acp65Aa, Cpr49Ag, Cpr49Ah, Cpr50Cb, Cpr56F, Cpr62Bb, Cpr62Bc, Cpr64Ad, Cpr65Ec, Cpr67Fa2, Cpr73D, Cpr76Bb, Cpr78Cb, TwdlP, TwdlO, TwdlN, Cpr100A, Cpr65Aw, TwdlX, Twdlalpha, Cpr31A, Cpr47Eg, Lcp65Ag3 |
| Chitin binding, carbohydrate derivative binding | 20 | Mur2B, CG8192, obst-G, CG10154, CG10140, obst-F, CG7298, CG6996, CG14608, Cht5, CG14880, CG7714, CG7715, CG6403, CG13643, Muc26B, Peritrophin-15a, Muc96D, CG32284, obst-H |
| Diazepam binding | 5 | CG8814, CG8629, CG15829, CG5804, CG8628 |
| Structural molecule activity | 48 | Act87E, Lcp4, Prm, Edg91, Ccp84Ag, Ccp84Ab, Ccp84Aa, Mlp84B, Lcp65Ag2, Lcp65Ag1, Lcp65Af, Lcp65Ac, Acp65Aa, Mur2B, Scgdelta, CG1368, Cpr49Ag, Cpr49Ah, Cpr50Cb, Cpr56F, Cpr62Bb, Cpr62Bc, Cpr64Ad, Cpr65Ec, Cpr67Fa2, Muc68Ca, obst-G, CG10154, Cpr73D, Cpr76Bb, obst-F, CG7298, CG6996, Cpr78Cb, RpL24-like, TwdlP, TwdlO, TwdlN, Cpr100A, Muc26B, Muc96D, Cpr65Aw, TwdlX, Twdlalpha, Cpr31A, Cpr47Eg, Lcp65Ag3, Mhc |
| Structural constituent of chitin-based larval cuticle | 10 | Lcp4, Ccp84Ag, Ccp84Ab, Ccp84Aa, Lcp65Ag2, Lcp65Ag1, Lcp65Af, Lcp65Ac, Cpr56F, Cpr64Ad |
| Fatty-acyl-CoA binding | 5 | CG8814, CG8629, CG15829, CG5804, CG8628 |
Expression of X-linked genes is especially susceptible to misregulation in hybrid males as a result of hemizygosity and potential breakdown of dosage compensation (Laurie 1997; Orr 1997). If directly related to hybrid lethality, then one might expect overrepresentation of X-linked genes in comparisons between hybrid genotypes. We observed no enrichment of X-linked gene misexpression, however, consistent with the previous microarray study (Barbash and Lorigan 2007). In fact, of the genes downregulated in hyb-Hmr–, the number of X-linked genes is significantly underrepresented (n = 24, FET, P < 0.0001).
Hybrid incompatibility may arise either through Hmr regulating the same targets in hybrids that it normally regulates within D. melanogaster or, alternatively, by regulating a distinct set of genes in hybrids. To distinguish between the two possibilities, we looked for genes that are differentially regulated in both mel-Hmr– and hyb-Hmr–, when compared with their respective Hmr+ samples. Strikingly, only four genes (other than Hmr) overlap and only one of them (CG9463) shows the same direction of change (fig. 1D). Moreover, the fold changes between the hybrid and D. melanogaster comparisons are not correlated, either for the differentially regulated genes or genome wide (fig. 1E). Hmr therefore has essentially nonoverlapping effects on the hybrid versus D. melanogaster genomes, strongly suggesting that Hmr has neomorphic function in the hybrid genetic background.
The D. melanogaster Alleles Are More Sensitive to the Presence of Hmr
Because Hmr has rapidly evolved in the two lineages (Barbash et al. 2004), Hmr, its cofactors, and its targets may have coevolved separately in D. melanogaster and D. simulans. Therefore, the observed hybrid differences may reflect differential regulation of the D. melanogaster and D. simulans alleles. As hybrid males contain only Hmr from D. melanogaster since it is X-linked, one might expect the presence or absence of Hmr to affect the regulation of D. melanogaster autosomal alleles (Amel) more than D. simulans autosomal alleles (Asim) in hybrids. To test this possibility, we determined the species-of-origin for each read, allowing us to distinguish between the expression level of Amel and Asim at all sites with orthology in the genome assemblies of the two species (see Materials and Methods). We then compared the allele-specific expression of autosomal genes and looked for those where only one of the two alleles is differentially regulated between hyb-Hmr+ and hyb-Hmr– (fig. 2A and B). For the majority of genes different between hybrids, both alleles are affected. Strikingly, however, of the genes downregulated in hyb-Hmr–, Amel-specific regulation is in significant excess; 177 genes have Amel-specific downregulation, whereas only 76 have Asim-specific downregulation (P = 0.0012, FET; fig. 2B). In contrast, of genes upregulated in hyb-Hmr–, similar numbers show upregulation of only Amel or only Asim (n = 58 and 46, respectively; P = 0.487). The specificity of the effect on Amel strongly suggests that allele-specific effects are not caused by lethality or developmental differences in hybrids.
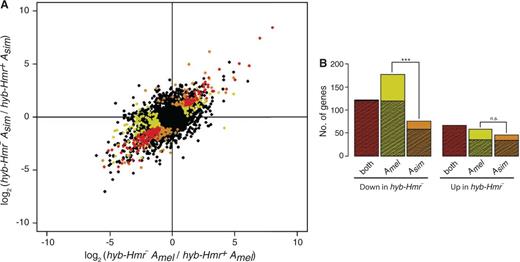
Allele-specific regulation in hybrids. (A) Amel-specific expression difference between the hybrids plotted against Asim-specific expression difference. Genes where both alleles are significantly different are indicated in red. Genes where only Amel significantly differs are marked yellow and only Asim significantly differs are marked orange. (B) Number of significant genes from (A) are plotted. Hatched areas represent the genes deemed different between the hybrids regardless of allele-specific expression (i.e., differentially expressed genes in fig. 1B).
Variable Growth Rates Account for a Large Portion of the Differential Expression in Hybrids
Both lethal and viable hybrid males develop more slowly than the pure species, but lethal hybrids have an even slower growth rate than viable hybrids (Bolkan et al. 2007). Pure species are at third larval instar at 72–76 h after egg laying (AEL), but the developmental progress of hybrids is less clear. To assess the developmental stage of the hybrids and how much developmental differences contribute to the observed differential expression, we utilized modENCODE RNA-Seq data sets from multiple developmental stages of D. melanogaster (Graveley et al. 2011). Although the data sets are from different genetic backgrounds, we reasoned that the transcriptomes of our samples should be most similar to the modENCODE sample of the closest developmental stage. As expected, mel-Hmr+, mel-Hmr–, and sim-Hmr+ are most highly correlated with the second L3 stage, termed puff stages 1 and 2 (L3.PS1-2; fig. 3A). In contrast, both hybrids are most highly correlated with the first L3 stage, collected at 12 h postmolting (L3.12hr), demonstrating a slower growth rate. Notably, hyb-Hmr– is slightly but significantly more similar to L3.PS1-2 than hyb-Hmr+ is, indicating an additional developmental delay in the lethal genotype (fig. 3A and supplementary fig. S1, Supplementary Material online). We conclude that although both hybrids reach L3 at 72–76 h (AEL), hyb-Hmr– is approaching L3.PS1-2, whereas hyb-Hmr+ has only just entered L3.
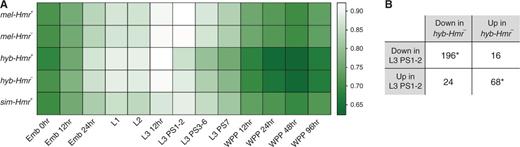
Developmental staging of samples based on ModENCODE data sets. (A) Shades in the heatmap represent correlation (Spearman’s ρ) of the samples to modENCODE developmental stages including embryos (Emb); first, second, and third larval instars (L1, L2, and L3); puff stages of L3 (PS); and white prepupae (WPP). (B) A total of 304 genes are different between hybrids (from fig. 1B) as well as between L3.12hr and L3.PS1-2. For these genes, the directions of change in the two comparisons are summarized. Numbers that are significantly higher than the genomic average are labeled (*P < 0.05, ***P < 0.0001; FET).
To identify genes differentially expressed due to the discrepant developmental progress, we looked for overlap between the 622 genes different between hyb-Hmr+ and hyb-Hmr–, and those different between L3.12hr and L3.PS1-2 in the ModENCODE data (fig. 3B). Of the 412 genes downregulated in hyb-Hmr–, 196 (47.6%) are downregulated in L3.PS1-2. Reciprocally, of the 210 upregulated in hyb-Hmr–, 68 (32.4%) are upregulated in L3.PS1-2. Both numbers are significantly higher than the random expectation (P < 2.2e-16 and P = 0.02053, respectively). These numbers are likely underestimates, because as noted above, hyb-Hmr+ and hyb-Hmr– do not precisely match L3.12hr and L3.PS1-2, respectively. These results demonstrate that a large proportion of the expression differences between the two hybrid genotypes is due to the growth delay in the dying hyb-Hmr+. Consistent with this conclusion is the fact that overrepresented GO terms include those associated with differences in larval stages (table 1).
Because hyb-Hmr– is closer developmentally to the parents than hyb-Hmr+ is, we expected gene expression in hyb-Hmr– to reflect this similarity. Indeed, the average expression difference between mel-Hmr+ and hyb-Hmr+ is significantly greater than the difference between mel-Hmr+ and hyb-Hmr– (Wilcoxon rank sum test, P < 2.2e-16; fig. 4A top). This is further exaggerated when we looked at only those genes that are different between the hybrids (Wilcoxon rank sum test, P < 2.2e-16; fig. 4A bottom).

Expression of hybrids relative to parental expression. (A) The distribution of absolute expression difference when mel-Hmr+ is compared with hyb-Hmr+ (indigo) and with hyb-Hmr– (pink) for all genes (top), and for only those genes different between the hybrids (bottom). In both sets, hyb-Hmr+ is significantly more different to mel-Hmr+ than hyb-Hmr– is. ***P < 0.0001. (B) For each gene downregulated in hyb-Hmr–, its expression in hyb-Hmr+ (indigo) and hyb-Hmr– (red) is plotted relative to the additive expectation centered at 0 in a row. Gray bars around 0 demarcate the range where the expression in hybrids is similar to additivity, set as ±1/4 of the difference between hybrids for each gene. Genes are ordered based on the difference between the additive level and the average expression of the hybrids. (C) Same as (B) but for genes upregulated in hyb-Hmr–. (D) Based on (B) and (C), genes are placed into categories according to their expression relative to the additive level: both hybrids are overdominant (both >) or both underdominant (both <); one hybrid genotype is within the additive range (“∼hyb-Hmr–” or “∼hyb-Hmr+”); or one hybrid is underdominant, whereas the other is overdominant (inter.).
Additivity is a simple null hypothesis where hybrid gene expression is expected to be the average of the two parental species. A potential explanation of differential gene expression between the hybrid genotypes is that one hybrid class deviates from additivity. We therefore analyzed all the differentially expressed genes relative to the additive expectation estimated by averaging expression levels of mel-Hmr+ and sim-Hmr+ for autosomal genes and mel-Hmr+ only for X-linked genes (see Materials and Methods). For the majority of the 412 genes downregulated in hyb-Hmr–, the expression in hyb-Hmr– is closer to the additive expectation than the expression in hyb-Hmr+ (fig. 4B and D). Similarly, the 210 genes upregulated in hyb-Hmr– show expression in hyb-Hmr– that more closely reflects additivity (fig. 4C and D). These results clearly indicate that hyb-Hmr+ deviates from the expected additive level substantially more than hyb-Hmr–. This departure from additivity in hyb-Hmr+ is consistent with the developmental differences documented above, and more generally, these results recapitulate that a major cause of differential expression between hybrids is the dissimilarity of hyb-Hmr+. In addition, we note that for 177 genes, one hybrid genotype is underdominant, whereas the other is overdominant (“inter.” in fig. 4D), suggesting that there is misregulation in both hybrids, but of opposite directions.
Candidate Hmr Targets Are Highly Repressed in D. simulans
The rapid divergence of Hmr between D. melanogaster and D. simulans raises the question of whether its functions in the respective species have also diverged. Direct examination of Hmr function is not possible in D. simulans because no mutants are available. However, if Hmr has diverged in function, we would expect differences in the regulation of its targets. Therefore, we compared between species the expression of the 40 candidate Hmr targets we identified in figure 1A. To guard against mapping biases skewing the results in favor of the better annotated D. melanogaster genome, we included only genic sequences with unambiguous orthology between the species (see Materials and Methods), which reduced the number of candidates to 31. Strikingly, almost all (n = 26, 83.9%) show significant interspecific differences (fig. 5A), revealing a significant overrepresentation of genes with divergent expression relative to the entire genome (P = 4.09e-06, FET). Of particular interest, 20 of the 26 genes are expressed lower in sim-Hmr+ than mel-Hmr+, 19 of which are repressive targets of D. melanogaster Hmr (fig. 5B). These results suggest that genes repressed by Hmr in D. melanogaster experience an even stronger silencing in D. simulans. Five of the genes repressed by Hmr are expressed higher in D. simulans, potentially representing genes that are no longer under Hmr regulation. We conclude that expression of Hmr target genes has drastically diverged between the species, likely as a consequence of Hmr’s rapid divergence, and that the repression of many of these genes has either weakened in the D. melanogaster lineage or strengthened in the D. simulans lineage.
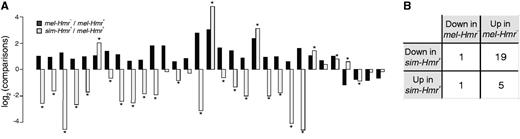
Expression of candidate Hmr targets in Drosophila simulans. (A) Expression differences of mel-Hmr– versus mel-Hmr+ (black) and sim-Hmr+ versus mel-Hmr+ (gray) are plotted for 31 of the candidate Hmr targets from figure 1A. Genes with significant interspecific differences are labeled by *. (B) Summary of the direction of change for genes in (A) with a significant interspecific difference.
Hybrid-Specific Expression Differences Are Limited
To determine expression differences specific to hybrids and not associated with hybrid lethality, we identified 5,675 genes that differ in expression by less than 1.3-fold between hyb-Hmr– and hyb-Hmr+ (and are not significant in fig. 1B). We then analyzed these genes relative to the parental species in three different approaches (table 2). First, we compared expression of these genes with each of the parents. When compared with mel-Hmr+, 974 (17.2% of total) genes have hybrid-specific differences; 663 (68.1% of total) are up-regulated in hybrids, whereas only 311 (31.9%) are down-regulated. More genes (1,238) are identified when compared with sim-Hmr+, but the bias between up- and downregulated is reduced. Second, we compared these genes with the additive expectation. The bias persists but the number of genes differentially regulated is substantially reduced to only 513 (9%). This reduction is not due to underpowered statistical tests as the hybrid expression level is indeed most similar to the additive level (supplementary fig. S2, Supplementary Material online). Therefore, comparisons solely to the parental species exaggerate hybrid misregulation. Genes whose expression has diverged between the parental species are particularly prone to this overestimation, as the additive level substantially differs from expression of both parents (supplementary table S2, Supplementary Material online). Third, we determined genes with transgressive expression, that is, expressed outside of the parental range. This criterion is the most stringent for classifying “misregulation.” Only 225 (4%) genes fall under this category, and the bias for upregulation in hybrids persists.
Hybrid-Specific Expression.
| Expression Comparisons | Differentially Expressed Genes | |||||||
|---|---|---|---|---|---|---|---|---|
| All Differentially Expressed | Up in Hybrids | Down in Hybrids | ||||||
| N | Percentage | Development Genes (% of Diff. Expressed)a | n (% of Diff. Expressed)b | X-Linked (% of Up in Hybrid)c | n (% of Diff. Expressed) | X-Linked (% of Down in Hybrid)c | Testes Genes (% of Down in Hybrid)d | |
| Hybrids vs. mel-Hmr+ | 974 | 17.2 | 275* (28.2) | 663** (68.1) | 30** (4.5) | 311 (31.9) | 26* (7.9) | 160** (51.4) |
| Hybrids vs. sim-Hmr+ | 1,238 | 21.8 | 333* (26.9) | 695* (56.1) | 149* (21.4) | 543 (43.9) | 129* (23.8) | 137 (25.2) |
| Hybrids vs. additive expectation | 513 | 9.0 | 168* (32.7) | 336** (65.5) | 40 (11.9) | 177 (34.5) | 23 (13.0) | 94** (53.1) |
| Transgressive | 225 | 4.0 | 81* (36.0) | 163** (72.4) | 21 (12.9) | 62 (27.6) | 11 (17.7) | 46** (74.2) |
Note.—A total of 5,675 genes with similar expression in hybrids are compared with the parents and additive levels. Transgressive refers to genes outside the parental range of expression.
aFET for enrichment of genes different between L3 12hr and L3 PS1-2; random expectation = 23.1%.
bSignificance test for bias of direction when compared with downregulated genes.
cFET for enrichment/depletion of X-linked genes; random expectation = 15.3%.
dFET for enrichment of testis-biased genes; random expectation = 26.6%.
*P < 0.01.
**P < 1e-5; FET.
Between approximately 27% and 36% of the differentially expressed genes are also different between L3.12hr and L3.PS1-2. A substantial proportion of genes downregulated in hybrids are enriched in adult testis expression (table 2), reflecting the fact that hybrids have atrophied gonad discs. These results demonstrate that many apparent expression changes between hybrids and pure species reflect developmental differences of hybrids rather than hybrid-specific gene misregulation. Finally, we asked whether there is an excess of X-linked genes with differential expression in hybrids. When compared with mel-Hmr+, we observed a depletion of X-linked genes. However, the sim-Hmr+ comparison yielded an enrichment of X-linked genes. This discrepancy is unsurprising, because the hemizygous X in the hybrids is of D. melanogaster origin. Indeed, when compared with the additive level, the X is neither enriched nor depleted. Overall, our results indicate that after accounting for developmental and tissue differences, gene expression differences in hybrids are surprisingly modest.
Discussion
Expression Profile in Hybrids
Interspecific hybrids have been long studied because they often manifest hybrid incompatibilities that cause reproductive isolation between species. More recently, hybrids have been widely used as a genetic background for investigating gene expression divergence. However, interpreting and analyzing gene expression in hybrids presents challenges. First, because hybrid gene expression is the combination of the two parental-species alleles, determination of expression level is prone to ascertainment biases because the assembly qualities of the two species are typically not equivalent, and/or hybridization probes are designed based on only one of the parental genomes. Second, comparisons of hybrids to parental species are plagued by developmental and physiological defects that are common in hybrids. The net effect is that genes with true regulatory differences are difficult to distinguish from an amalgam of tissue- and developmental stage-specific expression differences. Third, the expected hybrid expression level can be hard to predict for genes that have diverged in expression between species. These analysis challenges may contribute to previous estimations that the proportion of the genome misregulated in hybrids can be as high as 89% (Ranz et al. 2004).
Here, we attempt to account for these issues when examining gene expression in D. melanogaster/D. simulans hybrids. To accurately quantitate expression, we analyzed RNA-Seq reads for species-specific SNPs to determine the allele-specific expression for all orthologous sites (Degner et al. 2009; McManus et al. 2010; Graze et al. 2012). Using data sets describing developmental stage differences among wild-type larvae and tissue-specific gene expression, we evaluated the extent that developmental delay and gonadal degeneration in hybrids contribute to differential expression. For comparison to parental expression, we used several metrics including transgressive expression (Llopart 2012) and deviation from additivity.
We found that wild-type hybrids (hyb-Hmr+) have substantial differences from the parental species (fig. 3 and supplementary fig. S3, Supplementary Material online). Some of these differences are due to hybrid incompatibility rather than regulatory divergence, because viable hyb-Hmr– hybrids are closer in expression to the parental species. Furthermore, hyb-Hmr+ is more similar to earlier larvae than hyb-Hmr–, demonstrating that developmental delay is also contributing to gene expression differences. After accounting for these factors, we find that most genes in hybrids conform to additivity and only a limited number are misregulated. These results are surprising considering that D. melanogaster and D. simulans are relatively old species with synonymous divergence of approximately 10% (Begun et al. 2007). We conclude that regulatory incompatibilities may not be as wide spread as previously thought (Ranz et al. 2004; Haerty and Singh 2006).
Using a similar framework with RNA-Seq, McManus et al. (2010) examined the transcriptome of adult female hybrids between D. melanogaster and D. sechellia and found extensive nonadditivity. Although the discrepancy could result from the different species pairs used (and/or different sexes), we find this unlikely as D. sechellia and D. simulans are closely related sister species. Instead, we suggest two other more likely causes. First, the difference may reflect the life stages investigated. Regulation of gene expression is under stronger purifying selection during development than in adulthood (Castillo-Davis and Hartl 2002; Davis et al. 2005). As a consequence, regulatory incompatibilities may be less likely to accumulate in larvae compared with adults. Second, the hybrid adult females likely have significant physiological differences compared with their parent species because they lack ovaries, which may increase nonadditive gene expression when whole adults are sampled.
X-Chromosome Misregulation
The X-chromosome has distinct properties from the autosomes. Its smaller effective population size and hemizygosity in males result in a faster rate of evolution than the autosomes, the so-called fast-X effect (Vicoso and Charlesworth 2006). Additionally, the X accumulates more hybrid sterility loci than the autosomes, known as the large-X effect (Presgraves 2008). One might therefore expect that hybrids have an excess of X-linked misregulation, but the results are mixed. Sterile hybrid male mice show a disproportionate amount of X-linked upregulation (Good et al. 2010), but sterile Drosophila hybrid males show the opposite, with X-linked misregulation underrepresented (Lu et al. 2010; Llopart 2012). These differences between species might reflect different processes of sex chromosome silencing in the male germline. For example, although there is some dispute on the issue, the X-chromosome does not appear to be strongly silenced in the Drosophila male germline (Mikhaylova and Nurminsky 2012). Our results here show that hybrid male larvae have neither a higher nor lower proportion of X-linked genes that differ from additivity. Additionally, the lethality induced by the X-linked Hmr is also not associated with more differences among X-linked genes. Together, these findings suggest that increased X-linked misregulation is not a rule in hybrid males.
Discrepancies and Similarities with Microarray Data
A previous microarray study revealed few genes differentially expressed between lethal and viable hybrids (Barbash and Lorigan 2007). In this study, RNA-Seq offered several advantages, including unbiased determination of allele-specific expression. This allowed us to identify many more genes and observe allele-specific effects on gene regulation in hybrids. However, overlap between the two studies is small both in terms of GO terms enriched and specific genes. One likely explanation is that our samples were from older larvae than in the previous study, such that different sets of developmental genes may be affected. Additionally, developmental differences between lethal and viable hybrids will likely become exacerbated over time, resulting in a larger set of differentially regulated genes in our current study. Nonetheless, nearly all genes shared between the two experiments show the same direction of change, potentially revealing genes implicated in causing hybrid lethality. Overall, the small number of genes identified suggests that hybrid lethality is neither caused by nor causes significant changes in gene regulation.
Hmr Function in Hybrids
We find a small set of genes upregulated in mel-Hmr–, indicating that Hmr functions as a negative regulator in D. melanogaster. In contrast, we find that more genes are downregulated in hyb-Hmr–, reflecting an activating role for Hmr in hybrids. This result is unlikely to be due to developmental differences between the hybrids, because one would expect to see a similar directional bias in the modENCODE data when comparing different developmental stages. However, no such bias exists (n = 1,870 and 1,726 for genes up and down in L3.PS1-2 when compared with L3.12hr, respectively; P = 0.09398, FET). Additionally, candidate targets of Hmr identified in D. melanogaster are not differentially expressed between the hybrids. Therefore, our results indicate that the repressive effect of Hmr is not maintained in hybrids.
This difference between Hmr function in D. melanogaster versus hybrids was also apparent in an analysis of TEs (Satyaki et al. 2014). Hmr is required for TE repression in wild-type D. melanogaster, yet much higher TE expression occurs in hyb-Hmr+ compared with hyb-Hmr–. Together with our findings here, these results strongly argue that Hmr has neomorphic function in the hybrid and that the associated hybrid lethality is a gain-of-function phenotype, as suggested by earlier genetic analyses (Barbash et al. 2000; Orr and Irving 2000). One scenario for this gain of function is that Hmr protein acquires new binding partners in the hybrid background, allowing it to localize to new targets and reverse its repressive activity. This is supported by the observation of mislocalization of Hmr protein in hybrids (Thomae et al. 2013). Given that Hmr is required to repress a wide range of heterochromatic repeats (Satyaki et al. 2014), hybrid lethality and the observed misregulation may result from alterations in heterochromatin that affect chromosome function.
Hmr’s activating effects in hybrids is particularly intriguing, in light of our observation that hybrids have significantly more upregulation when compared with the additive expectation. We speculate that the overexpression may be detrimental to hybrids, either broadly affecting the stoichiometry of many complexes and pathways or through misexpression of a small set of genes with large effects. The partial mitigation of this effect through downregulation of some genes in Hmr– hybrids may therefore be requisite for hybrid viability.
The Role of Hmr in Allele-Specific Regulation in Hybrids
We showed that in the absence of Hmr in hybrids (hyb-Hmr–), the D. melanogaster alleles of many genes are downregulated, whereas the D. simulans alleles are unchanged. Because this excess is exclusive to D. melanogaster alleles, it seems unlikely to reflect general misregulation associated with hybrid death. One possible cause of this pattern is intraspecific regulatory differences in developmental genes. Because hyb-Hmr+ has just reached stage L3 while hyb-Hmr– is approaching puff stage 1 of L3, the observed mel-specific regulation may be revealing a set of genes that are differentially expressed between the two developmental time points only in D. melanogaster but not in D. simulans. This differential pattern likely results from cis-regulatory differences between the species, because both alleles are exposed to the same set of trans-factors in hybrids (Wittkopp et al. 2004).
An alternative possibility is that Hmr causes allele-specific activation in hybrids. If true, it again points to a neomorphic hybrid function because the genes affected are not regulated by Hmr in pure species. Additionally, this allele-specific regulation may indicate that the interacting partner is of D. melanogaster origin. One possibility is that it is X-linked as genetic studies have suggested that, in addition to Hmr, incompatibility genes on the D. melanogaster X are required for fully penetrant hybrid lethality (Barbash et al. 2000). We suggest that such HI genes may be contributing to the allele-specific patterns that we observed.
Divergence of Hmr Regulation and Function
We observed 2.5-fold higher expression of Hmr in D. simulans male larvae compared with D. melanogaster (supplementary fig. S4A, Supplementary Material online). This result is consistent with Northern blot analysis of mixed-sex larvae (Barbash et al. 2003) and also is apparent, albeit to a lesser extent (1.78-fold higher, supplementary fig. S4B, Supplementary Material online), in RNA-Seq analysis of white prepupae (Ni et al. 2012). Interestingly, the opposite result is seen at the protein level, with D. melanogaster being higher than D. simulans (Thomae et al. 2013). The discrepancy between protein and RNA levels strongly argues that Hmr levels are controlled by a complex combination of transcriptional and posttranscriptional effects, and that this regulation has changed drastically between the species. These differences are likely to be due at least in part to cis-regulatory divergence because the flanking noncoding regions of Hmr show evidence of adaptive evolution (Barbash et al. 2004).
At face value, lower protein level in D. simulans predicts weaker suppression of Hmr targets. However, to the contrary, we find that most of the genes repressed by Hmr in D. melanogaster experience a significantly stronger silencing in D. simulans (fig. 5). One possibility is that the stronger repression of the targets is the result of protein coding differences between the Hmr orthologs, either through stronger binding affinity to the targets or stronger recruitment of associated factors. Genetic assays have revealed that Hmr has diverged with respect to its hybrid lethal activity, as D. simulans Hmr does not cause lethality to hybrid males (Barbash et al. 2004). Our results provide further evidence of the functional consequences of the rapid divergence of Hmr between the two species, which is likely the product of both protein-coding and expression-level differences.
Given Hmr’s role in regulation of repetitive sequences, its stronger repression of targets in D. simulans has intriguing implications for the evolution of heterochromatin in the two species. Because stronger repression reduces TE and satellite DNA activity, the difference in repressive capabilities of the Hmr orthologs may contribute to a stronger defense system against selfish elements in D. simulans. This proposal is consistent with the significantly higher TE and satellite DNA content of D. melanogaster compared with D. simulans (Dowsett and Young 1982; Lohe and Brutlag 1987; Lerat et al. 2011). Furthermore, it underscores that defense against selfish DNA plays a pivotal role in the evolution of genome size and architecture.
Materials and Methods
Nomenclature
Hybrid, D. melanogaster, and D. simulans genotypes are designated with the prefixes hyb, mel, and sim, respectively. For example, hyb-Hmr– refers to Df(1)Hmr–/Y F1 hybrid males.
Fly Stocks and Sample Collection
The crossing scheme to make Hmr+ and Hmr– hybrids followed that used in Barbash and Lorigan (2007). Samples were collected as described in Satyaki et al. (2014). Briefly, virgin females from the Df(1)Hmr–, y w v/FM7i, P{w+ mC =ActGFP}JMR stock (abbreviated as Hmr–/FM7i, GFP) and a background-matched stock with Hmr+ genotype, y w v/FM7i, P{w+ mC =ActGFP}JMR (abbreviated as Hmr+/FM7i, GFP) were crossed to v/Y D. simulans males. Hybrid larval sons not carrying the balancer were selected by their y– mouth hook and absence of GFP. To generate mel samples, Hmr–/FM7i, GFP and Hmr+/FM7i, GFP virgin females were crossed to FM7i, GFP/Y males. Larval sons not carrying the balancer were selected by y– and GFP–. To generate sim samples, y w D. simulans virgin females were crossed to v/Y D. simulans males. Larval sons were selected by y–. Two replicates were collected for every larval genotype, each containing more than 30 larvae pooled from two or more crosses.
Library Preparation and Sequencing
RNA was extracted using Trizol. cDNA libraries were generated with the TruSeq Kit (Illumina). All samples were barcoded and sequenced on one lane of Illumina HiSeq 2000, single end 100 bp. The number of reads generated for each sample is listed in supplementary table S1, Supplementary Material online. Illumina sequence data are available from the National Center for Biotechnology Information website under BioProject number PRJNA236022.
Sequence Alignment and Determining Species-of-Origin
For the D. melanogaster samples and modENCODE data sets (raw sequences downloaded from the modENCODE website), reads were aligned uniquely to D. melanogaster reference r.546 (Flybase) using Tophat, allowing up to two mismatches (Trapnell et al. 2009). The read counts of D. melanogaster samples generated this way were only used for comparing mel-Hmr+ and mel-Hmr– in figure 1. All other analyses involving the D. melanogaster, D. simulans, and hybrid samples utilized read counts generated after species-of-origin calls described below, to ensure that read counts from all samples are comparable and to minimize mapping biases.
To determine species-of-origin, reads were uniquely mapped to D. melanogaster (Release 5.46) and D. simulans (Hu et al. 2012) references separately, allowing for up to 4 bp of mismatches per 100-bp read using Tophat. For each read that aligned to both references, we used custom Perl scripts to compare the number of mismatches it has to the two genomes and designated the reference with the fewer mismatches to be the species-of-origin. Reads mapping to both species with more than two mismatches were discarded. Reads mapping equally well to both references were designated as ambiguous and used for analyzing total expression of a gene but excluded from allele-specific expression analyses. After subjecting the pure-species sequences to this pipeline, we identified the positions of strain-specific polymorphisms that could lead to incorrect species-of-origin calls. Reads containing these polymorphisms in the hybrid samples were then designated as ambiguous. Because annotation of the D. simulans genome is lower resolution than D. melanogaster, we annotated reads of D. simulans origin using the D. melanogaster mapping coordinates and annotation from FlyBase (McQuilton et al. 2012). A small number of reads failed to align to one genome, which likely results from either high levels of divergence between species or gaps in one of the two references. To avoid artifacts associated with the latter scenario, we realigned these reads uniquely to modified references of the two species that have been curated to contain only orthologous exons present in both assemblies (Kelleher E, personal communication). Reads failing to map to this set of orthologous regions were discarded. Reads with a species-of-origin designation from the two approaches were then summed for the final allele-specific counts. The tally of allele-specific read counts is listed in supplementary table S1, Supplementary Material online.
Data Analyses
All analyses were carried out in RStudio version 0.98.495 (http://www.rstudio.com/) with R version 3.0.2. The species-of-origin counts were used only for allele-specific analyses. Otherwise, the species-of-origin and ambiguous counts were totaled for each gene. Normalization of samples, fold change, and significance of differential expression were determined using the DESeq package (Wang et al. 2010). Genes with fold change of greater than 1.5 and false discovery rate adjusted P value of less than 0.1 were considered significantly different. To determine genes differentially expressed between modENCODE stages, FET was used instead of DESeq because the modENCODE data are unreplicated (Marioni et al. 2008; Auer and Doerge 2010). Because FET is more prone to false positives, a stricter cutoff was used where genes were deemed significantly different if the FDR-adjusted P value is less than 0.001 and the fold change is greater than 2.
Heterochromatin and euchromatin boundaries are designated as in Satyaki et al. (2014). The additive expectations for each gene were calculated as the average of normalized (by DESeq) mel-Hmr+ and sim-Hmr+ expression for autosomal genes and as only mel-Hmr+ expression for X-linked genes. The set of genes highly expressed in the testes was downloaded from Flybase using the RNA-Seq search tool “expression by tissue” using modENCODE data. To determine genes with hybrid specific misregulation (table 2), we first identified genes that are not significantly different and with fold difference of less than 1.3 between hyb-Hmr– and hyb-Hmr+. These genes are deemed hybrid-specific misregulations if the expression in one or both of the two hybrids is significantly higher or lower by >1.5-fold compared with either one of the parental or additive levels. Genes were deemed transgressive if the expression is significantly greater or lower than both parents by 1.5-fold.
Acknowledgments
The authors thank Amanda Manfredo for help with library preparations, Julien Ayroles for advice on allele-specific sequence calls, P. Satyaki for insightful discussions, and the anonymous reviewers for helpful comments. This work was supported by NIH GM074737 to D.A.B. and NIH AI064950 to A.G.C., and a Cornell Center for Comparative and Population Genomics (3CPG) graduate fellowship to K.H.-C.W.
References
Author notes
Associate editor: Doris Bachtrog
