


Abstract
Identifying genes influenced by natural selection can provide information about lineage-specific adaptations, and transcriptomes generated by next-generation sequencing are a useful resource for identifying such genes. Here, we utilize a spleen transcriptome for the house finch (Haemorhous mexicanus), an emerging model for sexual selection and disease ecology, together with previously sequenced avian genomes (chicken, turkey, and zebra finch), to investigate lineage-specific adaptations within birds. An analysis of 4,398 orthologous genes revealed a significantly higher ratio of nonsynonymous to synonymous substitutions and significantly higher GC content in passerines than in galliforms, an observation deviating from strictly neutral expectations but consistent with an effect of biased gene conversion on the evolutionary rate in passerines. These data also showed that genes exhibiting signs of positive selection and fast evolution in passerines have functional roles related to fat metabolism, neurodevelopment, and ion binding.
Discovering genes influenced by natural selection is central for studying evolutionary processes. The ability to generate transcriptomes in almost any species of interest together with the development of tools for detecting selection provides means to identify such genes (Bonneaud et al. 2008; George et al. 2011). A commonly applied method is testing for selection using the ratio, numbers, and patterns of nonsynonymous and synonymous substitutions in coding regions. This approach has been shown to be efficient for discovering genomic regions, or functional classes of genes, selected in specific lineages (Kosiol et al. 2008; Künstner et al. 2010; Nabholz et al. 2011). Importantly, however, neutral forces affecting the fixation rate, such as biased gene conversion (BGC) (Marais 2003), can result in patterns similar to adaptive evolution or relaxed constraint. It is therefore crucial to investigate a potential role of such neutral forces in driving substitution patterns in different lineages before drawing conclusions on rates of adaptive evolution (Berglund et al. 2009). RNA-Seq also provides a cost-effective way to characterize transcriptomics without genome annotation (Wang et al. 2009) and for exploring how differences in life history among lineages can affect rates and patterns of genome evolution (Lynch 2007).
Birds are useful for studying selection and the influence of life history variation on patterns of genome evolution. Their abundance and ease of field study have yielded extensive data on a rich variety of phenotypic traits and behavior (Clutton-Brock and Sheldon 2010; Sætre G.P. and Sæther S.A. 2010). Pilot studies in avian comparative genomics have identified naturally selected genes (Axelsson et al. 2008; Nam et al. 2010) and estimated differences in selection intensity (Axelsson and Ellegren 2009; Künstner et al. 2010) among genes and in specific lineages, but in these studies a relatively small number of genes were analyzed across all species. Transcriptomes have been characterized in birds before, but these have not been used to conduct comparative analyses to investigate patterns of molecular evolution between bird lineages (Santure et al. 2011; Peterson et al. 2012).
Here, we utilize a novel spleen transcriptome for the house finch (Haemorhous mexicanus) together with three previously available avian genomes (turkey [Meleagris gallopavo], chicken [Gallus gallus], and zebra finch [Taeniopygia guttata]) (fig. 1) to 1) investigate whether changes in evolutionary rates and patterns of natural selection in different bird lineages can be explained by differences in life history traits as suggested by studies in mammals (Welch et al. 2008) and 2) identify genes that may have facilitated lineage-specific adaptations. As an oscine passerine (songbird), the house finch, together with the zebra finch (also a songbird) and the turkey provide important novel anchoring points for targeted searches for positively selected genes (PSG) and estimates of substitution rates at terminal and ancestral branches within passerines and galliforms—comparisons that have received little attention thus far.
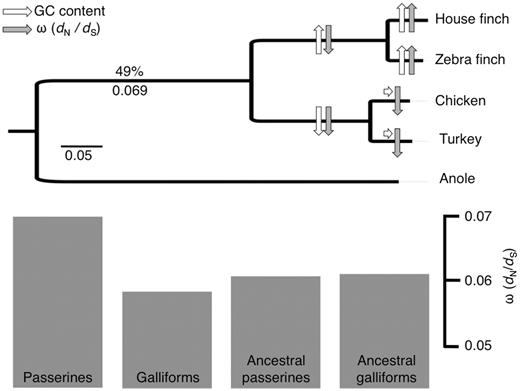
A phylogenetic tree showing the taxa included in the study. The GC content and the ω (dN/dS) for the ancestral avian branch is given above and below the branch and in white and gray, respectively; arrows indicate increase (arrow up), decrease (arrow down), or approximate constancy (horizontal arrow) in these parameters for each subsequent branch. The bar plot at the bottom shows the ratio of nonsynonymous to synonymous mutations (dN/dS or ω) for terminal and ancestral passerine and galliform branches, averaged across genes.
Results
We analyzed the coding sequence of 4,398 gene orthologs, a gene set representing approximately 25% of previously annotated avian genes (ICGSC 2004). Averaged across all 4,398 genes, the zebra finch branch had a significantly higher ratio of nonsynonymous to synonymous substitutions, ω, than the house finch (P = 6.3 × 10⁻¹⁶), and terminal passerine lineages had a significantly higher average ω compared with terminal galliform lineages (P < 10−16). Average ω was almost identical in the ancestral passerine and galliform lineages and was higher in terminal than in ancestral passerines branches, whereas ω was higher in the ancestral branch than in the terminal branches for galliforms (table 1 and fig. 1). To investigate a potential role of BGC on ω, we estimated the evolution of GC content across the six species using a nonhomogeneous model (Galtier and Gouy 1998; Boussau and Gouy 2006) and found that GC content has increased in the passerines and decreased in the galliforms from the avian ancestor (overall and third position GC content are given in table 1, fig. 1, and supplementary fig. S1, Supplementary Material online).
The Estimated Substitution Rates for Synonymous Sites (dS), the Average Ratio of Nonsynonymous to Synonymous Substitutions (ω), Overall GC Content (GC), GC in Third Codon Positions (GC3) and the Number of Fast Evolving Genes (FEG) and Positively Selected Genes (PSG) and Number of Overlapping Genes between Classes FEG and PSG.
| Lineage | dS | ω (dN/dS) | GC | GC3 | FEG | PSG | Overlapping |
|---|---|---|---|---|---|---|---|
| House finch | 0.050 | 0.064 | 0.51 | 0.57 | 52 | 10 | 1 |
| Zebra finch | 0.044 | 0.076 | 0.51 | 0.56 | 65 | 34 | 8 |
| Chicken | 0.049 | 0.056 | 0.47 | 0.51 | 47 | 191 | 20 |
| Turkey | 0.052 | 0.060 | 0.46 | 0.51 | 40 | 111 | 15 |
| Ancestral passerines | 0.169 | 0.061 | 0.50 | 0.56 | 151 | 29 | 1 |
| Ancestral galliforms | 0.148 | 0.061 | 0.46 | 0.51 | 37 | 25 | 2 |
| Ancestral avian | 0.267 | 0.069 | 0.49 | 0.52 | 58 | 24 | 0 |
To identify genes that might be candidates for lineage-specific adaptations, we focused on the following two gene sets: 1) genes that have experienced a higher ω in specific lineages in comparison with the rest of the tree (fast evolving genes [FEG]), and 2) genes that have specific codons influenced by positive selection only in a particular branch (PSG). In total, we identified 827 genes (18.8%) exhibiting signatures of selection somewhere in the bird tree (table 1). We found significantly more FEG in ancestral passerines than in ancestral galliforms (P < 10−16), whereas no significant difference was observed for PSG at these branches. We also compared the terminal branches for passerines with those for galliforms and found slightly more FEG in passerines compared with galliforms, but significantly more PSG in galliforms than in passerines (P < 10−16). A subset (n = 14) of genes was identified in both FEG and PSG and among these we identified gene functions related to fat metabolism (e.g., ZDHC16) and neurodevelopment (e.g., STXBP1 and EPHB3) in the terminal passerine lineages (supplementary tables S1 and Supplementary Data, Supplementary Material online).
After correcting for multiple testing, only two lineages (house finch and ancestral passerines) showed enrichment of specific gene ontology (GO) terms in any gene class, and only for FEG. Again, fat metabolism was an over-represented term in the house finch lineage and genes related to ion binding were over-represented in the ancestral passerines lineage (table 2).
Summary of the Over-Represented GO Terms in Different Lineages.
| Lineage/Gene Class | Category/GO ID | GO Term | Annotated | Significant | Expected | P Value | Corrected P Value |
|---|---|---|---|---|---|---|---|
| House finch/FEG | BP/GO:0006072 | Glycerol-3-phosphate metabolic process | 9 | 4 | 0.11 | 2.20e−6 | 1.18e−2 |
| House finch/FEG | BP/GO:0006071 | Glycerol metabolic process | 16 | 4 | 0.19 | 3.00e−5 | 5.35e−2 |
| House finch/FEG | BP/GO:0019400 | Alditol metabolic process | 16 | 4 | 0.19 | 3.00e−5 | 5.35e−2 |
| House finch/FEG | CC/GO:0009331 | Glycerol-3-phosphate dehydrogenase complex | 7 | 3 | 0.09 | 7.00e−5 | 5.12e−2 |
| Ancestral passerine/FEG | MF/GO:0046872 | Metal ion binding | 666 | 49 | 25.57 | 9.40e−7 | 5.58e−4 |
| Ancestral passerine/FEG | MF/GO:0043167 | Ion binding | 667 | 49 | 25.61 | 9.90e−7 | 5.58e−4 |
| Ancestral passerine/FEG | MF/GO:0043169 | Cation binding | 667 | 49 | 25.61 | 9.90e−7 | 5.58e−4 |
| Ancestral passerine/FEG | MF/GO:0004872 | Receptor activity | 168 | 18 | 6.45 | 5.40e−5 | 2.28e−2 |
| Ancestral passerine/FEG | MF/GO:0008270 | Zinc ion binding | 441 | 33 | 16.93 | 7.80e−5 | 2.64e−2 |
| Ancestral passerine/FEG | MF/GO:0046914 | Transition metal ion binding | 511 | 36 | 19.62 | 1.20e−4 | 2.90e−2 |
| Ancestral passerine/FEG | MF/GO:0005488 | Binding | 2,803 | 123 | 107.62 | 1.20e−4 | 2.90e−2 |
Note.—Only genes from the FEG class were significant and only in the house finch and the ancestral passerine lineages. Columns represent the given GO category and identification number (category/GO ID), GO term, the number of annotated genes within that term (annotated), the number of FEG detected (significant), the number of expected genes (see Extended Materials and Methods in supplementary information, Supplementary Material online) from the specific GO class (Expected), the significance level from the Fisher’s exact test (P value) and the level of significance after correcting for multiple tests with false discovery rate (FDR) <0.05 (corrected P value). MF, molecular function; CC, cellular component; BP, biological process.
Discussion
We utilized RNA-seq data from a wild bird species, the house finch, in combination with previously available vertebrate genome sequences, to provide novel insights into molecular evolution in birds, including lineage-specific and temporal variation in rate of adaptive evolution. Because of the difficulty of achieving sufficient statistical power when analysing large gene sets with a small number of species, whether estimating selection in genes using ω or testing for over-representation of GO terms among genes showing evidence for adaptive evolution, the gene set flagged here likely constitutes only a fraction of the genes that have been influenced by directional selection during the evolution of these lineages. Our list of adaptively evolving genes likely includes those genes showing strongest signals of selection, and we fully expect additional studies in birds to add to this list and to pinpoint more exactly the points in time when specific genes have been influenced by natural selection.
Both the absolute substitution rate and ω are influenced by a multitude of factors that affect the rate of mutation and the rate of fixation, including metabolic rate, generation time, and effective population size (Welch et al. 2008). Longevity, age of sexual maturity, and hence, generation time is on average longer in galliforms than in passerines (de Magalhaes and Costa 2009) and galliforms are significantly larger bodied than passerines (supplementary fig. S2, Supplementary Material online, Dunning 2008), implying smaller effective population sizes for galliforms than passerines (White et al. 2007). Furthermore, both species of galliforms included in this study have been subject to strong artificial selection during domestication, which in theory could increase ω, either as a consequence of strong selection on domestication traits or via accumulation of slightly deleterious mutations due to low effective population size (relaxed constraint). The time scale of domestication seems too short for relaxed constraint to generate a significant effect in our study, where we compare very divergent lineages, but it is possible that rapid fixation of derived or initially rare nonsynonymous mutations in some genes can generate a signal of positive selection (cf. Rubin et al. 2012). As a consequence of the earlier mentioned factors, we expected the value of ω to be higher in galliforms than in passerines (cf. Welch et al. 2008). However, our data do not support this, instead suggesting that passerine lineages had a significantly higher average ω compared with galliform lineages. This observation contrasts with the situation in mammals, where there is a clear negative relationship between effective population size and ω (Welch et al. 2008), presumably driven by accumulation of slightly deleterious mutations.
Several previously suggested factors affecting evolutionary rates could account for differences in ω among bird lineages. If we accept that most novel nonsynonymous mutations are neutral or slightly deleterious (Eyre-Walker and Keightley 2007), this would imply that passerines have had on average smaller long-term effective population sizes than galliforms (Ohta 1992; Lynch 2007), that body temperature in passerines has been on average lower than in galliforms, thereby providing a less stringent thermal window for protein function (Mindell et al. 1996) or that protein evolution in passerines is part of a more general syndrome of fast evolution (Fitzpatrick 1988; Kochmer and Wagner 1988). A reasonable alternative is that a genomic force affecting the rate of fixation has altered the pattern and rate of amino acid substitution in birds as compared with mammals. One strong candidate of such factor is BGC. BGC mimics selection by favoring specific alleles (G and C over A and T) and the strength of the effect can vary among genomic regions with different recombination rates and/or different nucleotide composition (Berglund et al. 2009; Lartillot 2012). It is plausible that fixation of slightly deleterious nonsynonymous changes by BGC can over-ride purifying selection in lineages with larger effective population sizes and higher population recombination rates (Romiguier et al. 2010; Lartillot 2012). Our observation of a higher GC content in passerines than in galliforms confirms previous observations (Nabholz et al. 2011) and is consistent with BGC being a significant force in shaping evolutionary patterns in species with large population sizes (Welch et al. 2008). In addition, our data suggest that the GC content in the avian ancestor was lower than in the amniote ancestor, a trend that has been observed in other recent studies (Fujita et al. 2011).
We derived absolute substitution rates (synonymous substitutions [dS] per year) by applying the mean divergence time of all available estimates in timetree.org (Hedges and Kumar 2009) and found that the ancestral branches (both the branch leading to ancestral birds and the branches leading to passerines and to galliforms) had higher substitution rates than terminal branches. However, when evaluating the effect of different calibration points on absolute rates for the four nodes in the avian part of the tree (supplementary fig. S3, Supplementary Material online), we found that absolute rate estimate intervals were extremely wide in both galliforms and passerines, underscoring the need for further and more accurate calibration points within birds.
Our analyses yielded a list of 827 genes (18.8%) showing evidence of selection somewhere in the bird tree (table 1); some of these are briefly discussed here. We found genes related to fat metabolism, neurodevelopment, and ion binding to be positively selected and/or fast evolving in passerine lineages. With regard to fat metabolism, birds are known to have a unique ability to rapidly utilize fat as an energy resource (Butler and Woakes 1990), an adaptation to long-distance migration that is especially pronounced in small migratory passerines (Lundgren and Kiessling 1986; Jenni-Eiermann and Jenni 1991). For the categories neurodevelopment and ion-binding, there is no obvious link between lineage specific traits and gene function, but they constitute natural targets for further comparative and functional studies in passerines (Fidler et al. 2007; Mueller et al. 2011).
We chose the spleen because it produces diverse immune transcripts, data that can facilitate ongoing studies of host–pathogen interactions in the house finch (Bonneaud et al. 2011, 2012; Backström et al. 2013) but using transcriptomes from several tissues might increase the likelihood of identifying targets of natural selection. In addition, more taxon-rich data sets will soon be available. These too will increase the power to detect specific gene regions influenced by positive selection and BGC and ultimately will help clarify the genetic basis of lineage-specific adaptations in different avian clades (Kosakovsky Pond et al. 2011; Kumar et al. 2012).
Acknowledgments
This work was supported by the Swedish Research Council (VR Grant: 2009-693) to N.B. for postdoctoral research, National Science Foundation (NSF Grant DEB-IOS 0923088) to G.H. and S.V.E., and Harvard University Milton Grant to S.V.E. The authors are grateful for helpful comments on earlier versions of this manuscript, both from the subject editor and from three anonymous reviewers.
References
Author notes
†These authors contributed equally to this work.
‡Present address: Department of Evolutionary Biology, Uppsala University, Uppsala, Sweden
Associate editor: Michael Nachman
