


Abstract
Cichlid fishes have evolved tremendous morphological and behavioral diversity in the waters of East Africa. Within each of the Great Lakes Tanganyika, Malawi, and Victoria, the phenomena of hybridization and retention of ancestral polymorphism explain allele sharing across species. Here, we explore the sharing of single nucleotide polymorphisms (SNPs) between the major East African cichlid assemblages. A set of approximately 200 genic and nongenic SNPs was ascertained in five Lake Malawi species and genotyped in a diverse collection of ∼160 species from across Africa. We observed segregating polymorphism outside of the Malawi lineage for more than 50% of these loci; this holds similarly for genic versus nongenic SNPs, as well as for SNPs at putative CpG versus non-CpG sites. Bayesian and principal component analyses of genetic structure in the data demonstrate that the Lake Malawi endemic flock is not monophyletic and that river species have likely contributed significantly to Malawi genomes. Coalescent simulations support the hypothesis that river cichlids have transported polymorphism between lake assemblages. We observed strong genetic differentiation between Malawi lineages for approximately 8% of loci, with contributions from both genic and nongenic SNPs. Notably, more than half of these outlier loci between Malawi groups are polymorphic outside of the lake. Cichlid fishes have evolved diversity in Lake Malawi as new mutations combined with standing genetic variation shared across East Africa.
Introduction
Adaptation requires genes to vary across individuals. Rapid adaptive radiation, which iterates adaptation and speciation, thus requires a deep pool of variants that can be screened by selection. Because most modes of natural selection remove genetic variation from within and sharpen genetic divergence between populations, evolutionary biologists have sought to understand the source(s) of continued genetic polymorphism in radiation (Streelman and Danley 2003; Seehausen 2004). Theory suggests that new mutations alone are insufficient to fuel extensive radiation, because the "waiting time" to mutation is simply too long (Gavrilets 2003; Bolnick 2004). Such consideration runs counter to a focus on new mutation as a driving force in adaptation (Enard et al. 2002). Alternatively, allelic diversity may persist in populations as standing variation, via the dual processes of 1) retention of ancestral polymorphism and 2) hybridization (Barrett and Schluter 2008). Recent study in fishes (sticklebacks, Colosimo et al. 2005; cichlids, Loh et al. 2008; Seehausen et al. 2008; Roberts et al. 2009), butterflies (Reed et al. 2011) and humans (Green et al. 2010) highlights the important role of standing variation in the adaptive divergence of closely related organisms.
Despite the growing appreciation of standing variation as a contributor to adaptation from both empirical (above) and experimental angles (Burke et al. 2010; Johansson et al. 2010), few studies have examined genome-wide patterns of allele sharing across an adaptive radiation. Early reports suggested very little shared polymorphism between humans and chimpanzees since their divergence 5–7 Ma (Asthana et al. 2005), and more recent analyses of this species pair have explained most "coincident polymorphism" as "coincident mutation" at fast-evolving nucleotide sites (e.g., CpG; Hodgkinson et al. 2009; Hodgkinson and Eyre-Walker 2010). Thus far, explorations of drosophilid genomes (Clark et al. 2007) have focused more on differences than similarities (but see Nowell et al. 2011).
The cichlid fishes of eastern Africa’s lakes and rivers, which include an estimated 2,000 species, present an opportunity to study the causes and consequences of shared genetic variation across a large number of recently evolved lineages. The bulk of East African cichlid species live in one of three large lakes (fig. 1). Lake Tanganyika houses the oldest assemblage (10–28 My old) of approximately 250 morphologically and behaviorally diverse species. Lake Malawi may contain as many as 900 cichlid species, evolving over the last 1–5 My. Finally, Lake Victoria and neighboring lakes (Albert, Edward, George, Kyoga, and Kivu) comprise the Victoria "superflock" of ∼600 species, originating in the last 150,000 to 1 My. Remarkably, almost all the cichlids found in these assemblages are endemics (species estimates and ages come from the following: Kornfield and Smith 2000; Verheyen et al. 2003; Salzburger et al. 2005; Genner et al. 2007; Turner 2007).
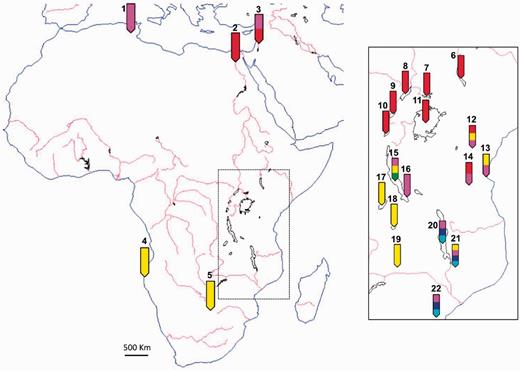
A map of Africa shows the location of sampling and inferred African cichlid genetic clusters. The section of the main figure within the dotted box is expanded and displayed in the right solid box. Numbered arrows specify locations where cichlid samples were collected: 1, Tunisia; 2, Egypt; 3, Kinneret; 4, Cunene; 5, Lisikili; 6, Lake Turkana; 7, Lake Kyoga; 8, Lake Albert; 9, Lake Edward; 10, Lake Kivu; 11, Lake Victoria; 12, Nyumba; 13, Bagamoyo; 14, Ilonga; 15, Lake Tanganyika; 16, Kalambo; 17, Lake Mweru; 18, Lake Bangweulu; 19, Kafue; 20, Lake Malawi; 21, Lake Chilwa; and 22, Mozambique. Colors on labels (not to scale) correspond to genetic clusters of figure 4: light blue, Malawi mbuna; dark blue, Malawi non-mbuna; red, Victoria superflock; pink, Astatotilapia cichlids; yellow, Tanganyika and riverine Haplochrominii and Tropheinii; and green, older Tanganyika tribes.
African lake cichlids have captivated the attention of evolutionary biologists because of the speed, diversity, and convergent patterns of their radiation (Streelman and Danley 2003; Kocher 2004; Seehausen 2006; Salzburger 2009). For example, morphologically similar forms found across lakes Tanganyika, Malawi, and Victoria were once thought to be close relatives, until genetic methods demonstrated that endemic species within each lake formed largely monophyletic groups (Meyer et al. 1990; Kocher et al. 1993). Cichlids (perhaps as many as 200 species) also inhabit the many small lakes, rivers, and marshes of Africa. It is possible that river cichlids have played an important role in the lacustrine radiations of East African cichlids. Nishida (1991) and Salzburger et al. (2005) conceive of Lake Tanganyika as a “reservoir” or source of African cichlid lineages and therefore rivers as dispersal conduits between lakes and geographic regions. Recent data suggest similarly that river cichlids may have seeded and/or contributed to the famously studied lake cichlid adaptive radiations (Verheyen et al. 2003; Joyce et al. 2011).
Because of the recent evolutionary origin of most species, the genomes of East African cichlids are quite similar. Within each major lake, this has been explained by incomplete lineage sorting and hybridization (Lake Malawi, Moran and Kornfield 1993, Mims et al. 2010; Lake Victoria, Nagl et al. 1998, Seehausen et al. 2008; Lake Tanganyika, Takahashi et al. 2001, Koblmüller et al. 2010). Studies have exploited background levels of genetic homogeneity and allele sharing between species or lineages with divergent phenotypes to identify "outlier" loci implicated in adaptive evolution (Loh et al. 2008; Seehausen et al. 2008; Roberts et al. 2009, 2011; Sylvester et al. 2010; Loh et al. 2011). Such morphological and behavioral diversity built from genomic similarity makes African cichlids prime models of the mapping function between genotype and phenotype (Kocher 2004; Streelman et al. 2007; Kuraku and Meyer 2008).
In this study, we address the origins of genetic variation among East African cichlids. We focus on a set of ∼200 single nucleotide polymorphisms (SNPs), the majority of which were ascertained via survey sequencing of five Lake Malawi species (Loh et al. 2008), genotyped in a diverse set of 576 cichlid samples from lakes and rivers throughout Africa. We observed widespread sharing of polymorphism outside of the lineage from which SNPs were ascertained. Bayesian and principal component analyses of genetic structure across Africa and coalescent simulation suggest that river cichlids have contributed significantly to the genomes of lake species. Malawi groups exhibit strong genetic divergence for approximately 8% of SNPs, and more than half of these segregate in other lacustrine and/or riverine assemblages. Our analysis paints a complex picture of East African cichlid evolution and implicates river species as "transporters" of genetic variation across the region.
Results and Discussion
Genotypic Data and Ascertainment Bias
We genotyped 280 SNPs in a selection of 576 cichlid samples representative of diversity across East Africa (table 1 and supplementary table S1, Supplementary Material online). Loci were discarded if genotyping failed in more than 25% of samples, in (rare) cases of monomorphism, or unexpectedly high heterozygosity suggestive of nonspecificity. Malawi SNPs were confirmed by genotyping as predicted in the five survey-sequenced genomes (Loh et al. 2008); Malawi SNP loci were thus excluded when these polymorphisms represented rare alleles in sequenced individuals or if genotyping failed in more distantly related lineages. Thirteen DNA samples were removed because they did not produce robust genotypic data. The remaining 123,297 genotypes (219 SNPs in 563 samples, 95.3% success) were used for subsequent analyses. The data consisted of 180 “Malawi SNPs” (111 genic and 69 nongenic), 21 “Victoria SNPs,” 9 “Tanganyika SNPs,” and 9 “burtoni SNPs” (see Materials and Methods and table 1). Because these SNPs were identified from species belonging to separate lakes and river systems, we expected the data to exhibit ascertainment bias. Indeed, the lineage from which SNPs were ascertained showed higher average heterozygosity than other lineages (supplementary fig. S1, Supplementary Material online). The disproportionate distribution of SNPs, with a majority identified from Lake Malawi cichlids, also produced bias in the information content obtained from genotyping, evinced by 1) our observation of longer branch lengths in phylogenies for the evolutionarily younger Malawi lineage compared with older Tanganyika tribes (not shown) and 2) greater discriminatory power in genetic principal component analysis (PCA; supplementary fig. S2, Supplementary Material online). As this study is primarily focused on the sharing of Malawi SNPs across East Africa (and is not designed, for instance, to estimate genetic divergence between lineages), ascertainment bias is not expected to affect the main conclusions we draw.
Genotyping Success of Sampled SNPs Indexed by Ascertainment Source.
| SNP Source | Total Number Genotyped | Failed, Low Quality, Monomorphic, or Excessive Heterozygosity | Informative SNPs |
|---|---|---|---|
| Malawi SNPs: nongenic | 91 | 22 | 69 |
| Malawi SNPs: genic | 123 | 12 | 111 |
| Victoria SNPs | 28 | 7 | 21 |
| Tanganyika SNPs | 21 | 12 | 9 |
| burtoni SNPs | 17 | 8 | 9 |
| Total | 280 | 61 | 219 |
Sharing of Genetic Polymorphism in East African Cichlids
Previous results demonstrated that SNPs identified by comparison of five individuals segregate widely across Malawi species (Loh et al. 2008). Here, we investigate whether the trend of shared polymorphism extends outside of this species flock. More than 50% (94/180) of Malawi SNPs exhibit polymorphism in other cichlid lineages (fig. 2 and table 2). Similar levels of polymorphism sharing are observed in both subsets of Malawi genic and nongenic SNPs. We repeated this analysis for the much smaller collection of Victoria (18) and Tanganyika (9) SNPs and found consistent proportions of shared polymorphism outside of the ascertained lineage (data not shown). The “burtoni SNPs” (9), originally identified from a single species present both in Lake Tanganyika and nearby rivers, did not segregate in Malawi or Victoria superflock cichlids.
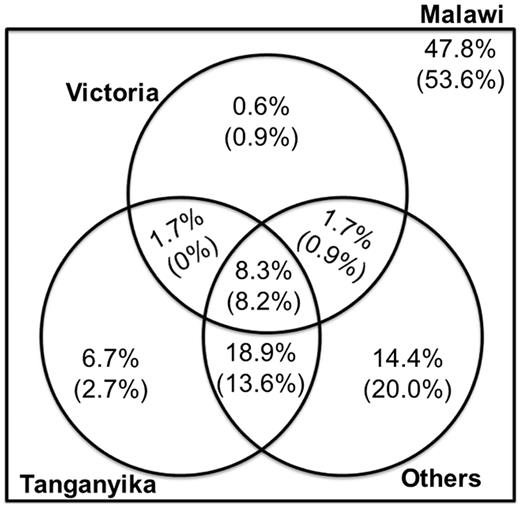
A Venn diagram shows the pattern of coincident polymorphism for Malawi SNPs, shared with other East African groups. The number in parentheses corresponds to non-CpG SNPs. For illustration, 47.8% of Malawi SNPs are polymorphic only within endemic Malawi species; 8.3% are variable in Malawi cichlids, Tanganyika cichlids, Victoria superflock cichlids, and other river haplochromine cichlids. Overall, 52.2% of Malawi SNPs exhibit polymorphism shared with cichlids outside of the endemic Malawi flock.
Distribution of Malawi SNPs Sorted by the Number of Other Lineages "Present" for Polymorphism (See fig. 3 for Examples).
| Number of Lineages (Outside Malawi) that Are Also Polymorphic | 9 | 8 | 7 | 6 | 5 | 4 | 3 | 2 | 1 | 0a |
|---|---|---|---|---|---|---|---|---|---|---|
| Number of Malawi SNPs | 1 | 1 | 2 | 1 | 7 | 7 | 16 | 20 | 37 | 2 |
| Cumulative number of Malawi SNPs | 1 | 2 | 4 | 5 | 12 | 19 | 35 | 55 | 92 | 94 |
| Cumulative percentage over 180 Malawi SNPs | 0.6 | 1.1 | 2.2 | 2.8 | 6.7 | 10.6 | 19.4 | 30.6 | 51.1 | 52.2 |
aThese two loci are alternatively fixed in distinct evolutionary lineages of African cichlids, outside of Malawi (e.g., fig. 3D). Although we infer the origin of polymorphism to predate the Malawi flock in these cases, the loci are technically not polymorphic within any group.
We explored several biological mechanisms that could explain high levels of shared polymorphism for Malawi SNPs. Allele sharing might be explained by independent mutations at sites prone to variation. It is well known that methylation of cytosines at CpG sites is widespread in vertebrate genomes (Suzuki and Bird 2008). Unstable methylcytosines are capable of spontaneous deamination, which can lead to a high rate of C-to-T (and G-to-A) transitions. We thus removed all SNPs that could be produced by CpG mutations and continued to observe high polymorphism sharing (46% of loci) in non-CpG SNPs (fig. 2).
Recent reports have described cryptic variation in the human mutation rate that could be responsible for coincident polymorphism between humans and chimpanzees (Hodgkinson et al. 2009, Hodgkinson and Eyre-Walker 2010). For instance, Hodgkinson and Eyre-Walker (2010) observed a 15-fold excess of A-T-coincident SNPs, compared with expected rates of transitions and transversions. Shared SNPs in our analysis did not depart from the overall average distribution of transitions and transversions (χ2 test; P = 0.481). Therefore, although our data set is considerably smaller, we observe no evidence of mutational variation unique to shared polymorphisms.
A straightforward way to consider whether coincident polymorphism is caused by independent mutation is to examine the evolutionary distribution of shared SNPs with respect to phylogenetic history. To this end, we inferred the origin of each of the 180 Lake Malawi SNPs on a consensus phylogram (fig. 3; Salzburger and Meyer 2004; Salzburger et al. 2005; Genner et al. 2007; Wagner et al. 2012). Table 2 summarizes the distribution of 94 shared SNPs based on the number of lineages outside of Lake Malawi that is "present" for polymorphism. Fifty-five of these coincident SNPs exhibited polymorphism in at least two non-Malawi lineages (example in fig. 3, column B). This could mean that at least three independent mutations (including within Lake Malawi) occurred at exactly the same nucleotide position to produce the shared variation, but we find this explanation unlikely. Among the 37 Malawi SNPs found to be polymorphic in only one other lineage outside of Lake Malawi, 28 were variable within the presumed sister clades to Malawi, comprising the Lake Victoria superflock or riverine Astatotilapia (example in fig. 3, column C). For several SNPs, fixation of alternate alleles was observed among non-Malawi lineages (example in fig. 3, column D). In these instances, we infer the origin of polymorphism before lineage divergence and alternate fixation.
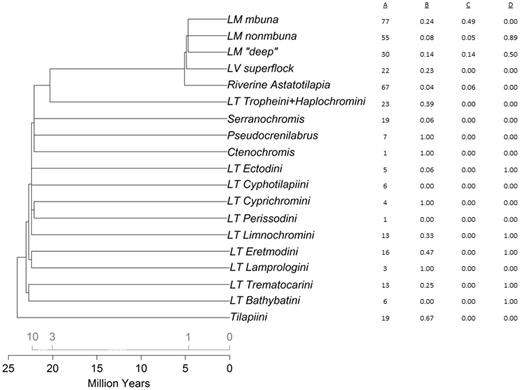
The distribution of polymorphism for Malawi SNPs across a phylogram of East African cichlid lineages. Column A shows the number of coincident Malawi SNPs (out of 94) that are shared with each lineage. Columns B–D show minor allele frequencies for exemplar SNPs; B, SNP Aln112626_241 exhibits widespread polymorphism in 8 of 12 lineages outside of Lake Malawi; C, SNP Aln116141_779 shares polymorphism with river haplochromines; D, SNP Aln104822_926 is not polymorphic within each of the Lake Tanganyika tribes, but fixation of alternate alleles suggests early origin of the polymorphism. The tree topology is modified from published reports (Salzburger and Meyer 2004; Salzburger et al. 2005; Genner et al. 2007). The chronogram (bottom scale) is synthesized from recent analyses (Genner et al. 2007; Wagner et al. 2012); earlier reports (Salzburger and Meyer 2004; Salzburger et al. 2005) suggesting more recent divergence times are summarized on the top scale.
Taken together, the data suggest that shared polymorphism in Malawi SNPs is generally not the product of independent mutation and is therefore better explained by segregation of ancestral polymorphism and/or gene flow (hybridization) between lineages. Notably, the percentage of shared polymorphism between Malawi and Tanganyika cichlids (25.6%, excluding overlap with Victoria) was considerably higher than that observed between Malawi and Victoria superflock fishes (2.3%, excluding overlap with Tanganyika, fig. 2). This reflects geography (fig. 1) more than phylogeny (fig. 3).
Our finding of extensive polymorphism sharing across lakes sheds new light on the oft-observed evolution of similar traits across East African cichlids, such as morphologies (predatory body design, fleshly lips, nuchal humps, horizontal striping etc.; Kocher et al. 1993), behaviors (bower building; Goodwin et al. 1998), or even molecular changes (rhodopsin gene substitutions; Sugawara et al. 2005). Our data raise the possibility that such textbook examples of convergent evolution could be the result of deeply rooted molecular parallelism.
Genetic Structure of Cichlid Fishes across East Africa
A striking observation from figure 3 is that polymorphism is shared by lineages thought to have diverged many millions of years ago (Genner et al. 2007). This presents a set of dilemmas. First, few polymorphisms are expected to persist this long under models of neutrality, and the effects of balancing selection are localized (Asthana et al. 2005). In particular, the large evolutionary effective population sizes necessary to explain the retention of shared polymorphism for longer than 2 My should also generate considerable nucleotide diversity within species, but this is not evident (Loh et al. 2008). Second, recent direct gene flow between species from different Great Lakes is unlikely, as the basins are geographically distinct and hundreds of miles apart (fig. 1). Past analyses have suggested that nonendemic, river cichlids might have contributed to lake cichlid genomes (Loh et al. 2008; Joyce et al. 2011; Schwarzer et al. 2012). We therefore used the SNP data to investigate genetic structure across African cichlids, paying particular attention to the clustering of river species.
We applied a Bayesian analysis using STRUCTURE (Pritchard et al. 2000) and found that our data were best described by K = six genetic clusters (see Materials and Methods; mean ln probability of data = −28,353.7). The inferred ancestry of each of the 563 cichlid samples was calculated and reported as the fraction assigned to each of the six clusters (fig. 4, supplementary table S1, Supplementary Material online, for individual identification). We observed two general patterns of inferred ancestries. A majority of the cichlids exhibited a pattern of singular ancestry (one solid color in fig. 4). The remaining cichlid samples had admixed or mosaic ancestry patterns, with genetic contributions from two or more of the six genetic clusters.
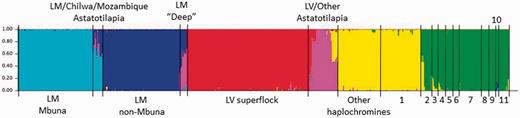
Bayesian assignment of cichlid samples to six genetic clusters. The chart comprised 563 individual vertical bars, each representing a single cichlid sample, proportionally colored based on assignment to genetic clusters (this plot is expanded in supplementary fig. S4, Supplementary Material online, where individual numbers correspond with those in supplementary table S1, Supplementary Material online). Black vertical bars split the chart into segments where each segment labels a group of samples. LM, Lake Malawi; LV, Lake Victoria; LT, Lake Tanganyika; 1, LT Haplochromini/Tropheini; 2, LT Limnochromini; 3, LT Ectodini; 4, LT Cyprichromini; 5, LT Cyphotilapiini; 6, LT Perissodini; 7, LT Lamprologini; 8, LT Eretmodini; 9, LT Bathybatini; 10, LT Trematocarini; and 11, Tilapiini.
The cichlids assigned to single clusters correspond well with previously described evolutionary lineages. For example, the first group (from left, light blue) contained all the samples of the mbuna (rock dwelling) lineage of Lake Malawi. Two other groups showed similar correspondence to known lineages: the non-mbuna (or sand dwelling) lineage of Lake Malawi (dark blue) and the Lake Victoria cichlid superflock (red). The three remaining clusters of unanimously assigned individuals included 1) a subset of samples from the genus Astatotilapia (pink), 2) a collection of haplochromine cichlids plus Lake Tanganyika endemics from the Haplochromini and Tropheini tribes (yellow), and 3) samples from older tribes in Lake Tanganyika (green). Note that our ability to detect genetic clusters within Lake Malawi, for instance, and not within the Lake Victoria superflock, nor among more ancient tribes of Lake Tanganyika, is likely a reflection of ascertainment bias (above).
We detected appreciable levels of admixture in certain cichlid groups, with consistent patterns across multiple individuals within a species or population (fig. 4). Notably, individuals of Astatotilapia, one of a handful of genera distributed throughout Africa, exhibited several different admixture patterns (fig. 4). As a basis for comparison, Astatotilapia burtoni from Lake Tanganyika and the connected Kalambo River, as well as A. desfontainii from Tunisia in North Africa, were assigned to single clusters (discussed earlier, pink solid bars in fig. 4). In contrast, A. calliptera individuals sampled from within Lake Malawi showed mosaic genomes shared with Malawi mbuna (light blue), non-mbuna (dark blue), and other Astatotilapia (pink). Other populations of Astatotilapia, sampled from locales of the eastern Indian Ocean drainage (Lake Chilwa and Buzi river), displayed similar admixture patterns to Lake Malawi nonendemic A. calliptera. Additionally, we observed that the genomes of Rhamphochromis, Diplotaxodon, and Pallidochromis individuals, representing the deep water and pelagic lineages of Lake Malawi, are of dual endemic/nonendemic ancestry (∼50:50 non-mbuna and Astatotilapia). Previous studies have postulated that members of the Astatotilapia genus contributed to the genomes of Lake Malawi cichlids (Seehausen et al. 2003; Loh et al. 2008) and that the Malawi species flock is not monophyletic (Joyce et al. 2011). Our current findings further support the hypothesis that Lake Malawi was multiply colonized and/or that gene flow has occurred between one or more Astatotilapia lineages and endemic mbuna, non-mbuna, and deepwater species. However, other Astatotilapia species (A. bloyeti, A. flavijosephii, and A. tweddlei), collected from around Africa, exhibit admixed genomes shared with either the Lake Victoria superflock (red–pink) or other haplochromines (yellow–pink). PCA of SNP variation is strongly consistent with the STRUCTURE analysis in this regard (supplementary fig. S2, Supplementary Material online). Specific Astatotilapia individuals cluster in an intermediate position between Malawi mbuna and Malawi non-mbuna + deepwater species, whereas others cluster uniquely with members of the Lake Victoria superflock. Our analysis reveals a continuum of discrete genetic clusters for many endemic lake cichlids and admixed genomes for particular river species. This might suggest an important role played by river species (e.g., Astatotilapia) in moving genetic polymorphism between lakes and rivers across the spatial geography of East Africa (fig. 1).
Coalescent Simulations of Shared Polymorphism
To further explore putative causes of allele sharing across East African cichlids, we carried out extensive coalescent simulation. We employed a consensus evolutionary scenario with divergence among groups (supplementary fig. S3, Supplementary Material online; Salzburger and Mayer 2004; Salzburger et al. 2005; Genner et al. 2007; Wagner et al. 2012) and varied specific demographic factors (effective population sizes, presence/absence of bottlenecks, and migration) to evaluate the roles of neutral lineage sorting and gene exchange. We examined results from 75 models, wherein each model comprised 100 data sets matching the size and ascertainment of our empirical data for Malawi SNPs. For each simulated data set, we calculated the number of SNP loci exhibiting polymorphism outside of Malawi and compared this with our empirical observations for the groups in the simulation (supplementary table S2, Supplementary Material online). Importantly, even with large and sustained effective population sizes, appreciable allele sharing is not found for any model without migration of genes between river and lacustrine groups. Enforcing a strict temporal constraint on gene flow (limited to 100,000 years after divergence) also results in negligible allele sharing. A particular set of model parameters produced simulated allele sharing that nearly matched empirical observation for all groups. The combination of Ne = 10,000 and a migration rate of 0.1 is the best-fit set of parameters, followed by Ne = 100,000 with a migration rate of 0.01. These results are robust to alternative branching scenarios. For instance, we assigned species to groups using empirical data from STRUCTURE and PCA (fig. 4 and supplementary fig. S2, Supplementary Material online), wherein specific members of Astatotilapia were placed in the Malawi and Victoria groups, respectively (supplementary table S1, Supplementary Material online). This changes the observed values of shared polymorphism among groups, but once again only those simulations with gene flow between groups approach empirical measures of allele sharing (supplementary table S2C, Supplementary Material online). These results from coalescent simulation, interpreted within the context of Bayesian and principal component analyses of genetic structure, support the hypothesis that sharing of genetic polymorphism across East African cichlids is mediated by gene exchange between endemic lake cichlids and wider-ranging river species.
Genetic Divergence of Old and New SNPs in Malawi Cichlids
We have previously used the empirical distribution of genetic differentiation among SNPs between Malawi cichlid groups to identify loci that may have experienced histories of divergent selection. Approximately 5% of SNP loci were "differentiation outliers" between Malawi groups (Loh et al. 2008), similar to conclusions from other studies (Nosil et al. 2009). We carried out a similar analysis here and additionally determined whether differentiated loci were "old"—that is, SNPs shared outside of the Malawi endemic flock or "new"—SNPs found only in Malawi endemic species. For each SNP, we calculated FST (Weir and Cockerham 1984), a measure of genetic differentiation, among Lake Malawi cichlid groups (fig. 5). This was executed at different evolutionary levels: between 1) major lineages of mbuna (M), non-mbuna (N), and deep-water species (D); 2) all pair-wise combinations of M, N, and D groups; 3) all genera (with at least five cichlid samples in a genus); and 4) populations of genera Labeotropheus and Metriaclima, used in previous studies (e.g., Albertson et al. 2003, 2005; Streelman and Albertson 2006; Loh et al. 2008; Roberts et al. 2011). The median genetic differentiation found in these comparisons ranged from 0.020 to 0.209 (mean range: 0.167–0.302), indicating that the majority of genetic variation segregates within and not between groups. Notably, only 5 of 180 Malawi SNPs were differentially fixed at the species level, whereas the remaining loci showed widespread polymorphism across most species.
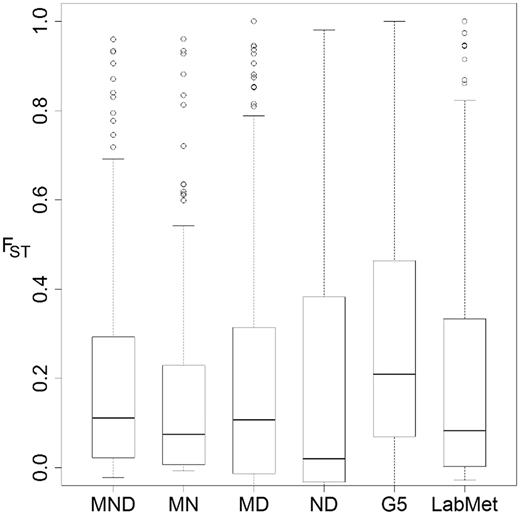
FST distribution and "differentiation outliers" among Malawi cichlid groups. Box-and-whisker plots of FST distribution with upper and lower box bounds representing 75th and 25th percentiles, respectively. The solid lines within boxes represent the median value. Whiskers mark the furthest points from the median that are not classified as outliers. Unfilled circles represent outliers that are more than 1.5 times the interquartile range higher than the upper box bound. Category labels describe the populations used in the FST calculation: MND, mbuna versus non-mbuna versus deep; MN, mbuna versus non-mbuna; MD, mbuna versus deep; ND, non-mbuna versus deep; G5, populations of genera (with more than five samples within); and LabMet, Labeotropheus versus Metriaclima.
We identified SNP loci differentiated between groups, following a simple strategy of assigning the upper tail of FST histograms as genetic outliers (Luikart et al. 2003). An average of 7.9% of SNPs were outliers exhibiting high FST in the MND, MN, MD and LabMet comparisons (fig. 5). We note that results of the MND analysis are not independent of the subsequent three pair-wise tests. However, performing these three analyses remains valuable to identify whether particular pairs (e.g., M vs. N, M vs. D, table 3) contribute to the signal of differentiation. The ND and G5 analyses did not yield significant outliers, as the FST distribution had a wide spread of intermediate values (compare box bounds in fig. 5). Nonetheless, we do observe high FST values of 1 (alternately fixed in populations) or slightly below and these may be biologically relevant (table 3).
Summary of FST for Outlier SNPs (fig. 5).
| SNP Name | SNP Origina | Associated Gene | MND | MN | MD | ND | G5 | LabMet |
|---|---|---|---|---|---|---|---|---|
| Aln101510_393 | Recent | Transforming growth factor, beta 2 | 0.959 | 0.960 | 0.936 | −0.032 | 0.948 | 0.072 |
| Aln102749_378 | Old | Glutamate receptor, ionotrophic, AMPA 4 | 0.933 | −0.001 | 1 | 0.981 | 0.879 | — |
| Aln102504_1609 | Old | Iroquois homeobox protein 1, b | 0.931 | 0.933 | 1 | −0.033 | 1 | — |
| Aln113666_686 | Old | Dicer 1, ribonuclease type III | 0.905 | 0.927 | 0.565 | 0.768 | 0.986 | 0.001 |
| Aln110417_383 | Recent | Neuroligin 1 | 0.870 | 0.881 | 0.262 | 0.770 | 0.909 | — |
| Aln105577_385 | Recent | TOX high mobility group box family member 3 | 0.840 | — | 0.945 | 0.950 | 1 | — |
| Aln103506_276 | Recent | Pre-B-cell leukemia homeobox 3 | 0.840 | — | 0.945 | 0.950 | 1 | — |
| Aln103131_1413 | Old | NA | 0.830 | 0.834 | −0.025 | 0.770 | 0.769 | 0.072 |
| Aln102321_608 | Old | Zic family member 1 (odd-paired homolog, Drosophila) | 0.794 | — | 0.927 | 0.933 | 0.917 | — |
| Aln118947_983 | Recent | Tubulin folding cofactor D | 0.794 | — | 0.927 | 0.933 | 0.917 | — |
| Aln104822_926 | Old | Solute carrier family 4, anion exchanger, member 1 | 0.777 | 0.812 | 0.852 | 0.210 | 0.782 | — |
| Aln101222_933 | Recent | Serine palmitoyltransferase, long chain base subunit 3 | 0.745 | — | 0.905 | 0.914 | 0.835 | — |
| Aln112709_570 | Old | CUB and Sushi multiple domains 2 | 0.718 | 0.720 | 0.809 | 0.033 | 0.723 | 0.275 |
| Aln100532_2174 | Old | Potassium channel, subfamily K, member 9 | 0.691 | — | 0.880 | 0.891 | 0.741 | — |
| Aln109969_676 | Recent | Homeobox A10 | 0.626 | 0.635 | — | 0.484 | 0.566 | — |
| Aln105584_365 | Old | Cathepsin A | 0.622 | 0.634 | 0.459 | −0.032 | 0.668 | 0.817 |
| Aln106343_852 | Recent | Homeobox B9 | 0.599 | 0.618 | 0.260 | 0.403 | 0.707 | — |
| Aln103262_483 | Old | Chromodomain helicase DNA-binding protein 4 | 0.649 | 0.613 | 0.240 | 0.979 | 0.542 | 0.064 |
| Aln112165_601 | Old | NA | 0.600 | 0.611 | 0.440 | −0.032 | 0.586 | 0.316 |
| Aln100281_1741 | Old | Patched 1 | 0.592 | 0.598 | 0.588 | −0.004 | 0.728 | 0.914 |
| Aln102003_434 | Old | Thrombospondin, type I, domain containing 7 A | 0.562 | 0.034 | 0.943 | 0.809 | 0.956 | — |
| Aln104744_1075 | Old | POU class 3 homeobox 3 | 0.559 | 0.542 | 0.874 | 0.175 | 0.570 | −0.019 |
| Aln110178_952 | Old | ATPase, Na+/K+ transporting, alpha 2 polypeptide | 0.273 | 0.087 | 0.853 | 0.481 | 0.517 | — |
| Aln102499_612 | Recent | PRKC, apoptosis, WT1, regulator | 0.636 | — | 0.851 | 0.864 | 0.659 | — |
| Aln113582_375 | Old | Membrane frizzled-related protein | 0.271 | 0.042 | 0.815 | 0.514 | 0.454 | — |
| Aln102027_539 | Old | Calcium channel, voltage-dependent, P/Q type, alpha 1 A subunit | 0.236 | 0.249 | 0.097 | — | 1 | 1 |
| Aln105956_1118 | Recent | Carbonyl reductase 1 | 0.498 | 0.511 | 0.324 | — | 0.699 | 0.973 |
| Aln101293_1168 | Old | Membrane protein, palmitoylated 2 | 0.080 | 0.021 | 0.257 | 0.408 | 0.425 | 0.946 |
| csrp1 | Recent | Cysteine and glycine-rich protein 1 | 0.348 | 0.361 | 0.188 | — | 0.783 | 0.946 |
| Aln107567_398 | Old | NA | 0.376 | 0.390 | 0.213 | — | 0.878 | 0.945 |
| Rhodopsin | Old | Rhodopsin | 0.420 | 0.376 | 0.204 | 0.848 | 0.666 | 0.944 |
| Aln103439_528 | Recent | NA | 0.378 | 0.392 | 0.217 | — | 0.633 | 0.868 |
| Aln122064_679 | Old | Aquaporin 3 (Gill blood group) | 0.451 | 0.463 | 0.285 | −0.037 | 0.717 | 0.860 |
Note.—Underlined FST values are significantly elevated outliers (P < 0.05) of the empirical distribution.
aSNP origin defined as recent if polymorphism is present only in Lake Malawi or old if polymorphism is shared with lineages outside Lake Malawi.
In total, we identified 33 SNP loci as FST outliers. This included a mix of both genic and nongenic loci. Thirty-six percent of outliers could be inferred as recent SNPs with variation present only within Lake Malawi, whereas the remaining 64% of loci exhibit shared polymorphism with species outside the lake. Outlier SNPs included loci that we discovered in previous work (rh1, csrp, irx1b, and ptc1; Loh et al. 2008). Notably, two of these have been subsequently implicated, by empirical genetic and development experiments, in cichlid brain (irx1b, Sylvester et al. 2010) and jaw (ptc1, Roberts et al. 2011) evolution. All except csrp are polymorphic outside of the Malawi endemic flock.
Additional SNPs from table 3 warrant further study. One, found in the transforming growth factor beta 2 (tgfb2) gene, showed strong genetic differentiation between mbuna and other Lake Malawi cichlids (non-mbuna plus “deep” lineages). tgfb2 belongs to a family of multifunctional cytokines with important regulatory roles in brain (Yi et al. 2010), eye (Wolf et al. 2009), and craniofacial (Oka et al. 2007; Anthwal et al. 2008) development—topics frequently studied in cichlids. It was recently reported that divergent selection on microRNA (miRNA) target sites may have contributed to the diversification of Malawi cichlids (Loh et al. 2011). In particular, a single polymorphism in the cichlid hoxa10 3′-UTR (untranslated region) is predicted to influence the binding of both miRNA-181 and miRNA-23. Our analysis here provides further evidence, with greater sampling, that this SNP is strongly differentiated between mbuna and non-mbuna Malawi lineages. The SNP in tgfb2 is shared with cichlids outside of Malawi, whereas the variant in hoxa10 appears to have evolved in the common ancestor of non-mbuna. Overall, these data suggest that the radiation of Malawi cichlids was fuelled by a combination of new mutation and genetic polymorphism shared broadly across Africa.
River Cichlids as Transporters of Polymorphism across Africa
Adaptive radiations compel evolutionary biologists to study adaptation and speciation simultaneously. As most modes of natural selection are known to remove genetic polymorphisms from populations, the source of variation for sustained radiation is a topic of interest. The key finding from this study is that Lake Malawi cichlids share genetic polymorphism broadly with lineages throughout eastern Africa. The degree of allele sharing across Africa is unexpected under simple neutral models of coalescence and likely requires gene exchange. Our data from genetic clustering and simulation suggest that river species may act as conduits to “transport” genetic variation between lake assemblages.
Schluter and Conte (2009) describe the “transporter” hypothesis to explain rapid and parallel evolution of sticklebacks in freshwater environments. Their model includes 1) hybridization between freshwater resident and marine stickleback populations, 2) the retention of freshwater-adapted alleles at low frequency in large marine populations, 3) the reintroduction of those alleles to freshwater populations as environmental change facilitates colonization, and finally 4) renewed selection of freshwater-adapted alleles in freshwaters. Adaption from such standing variation is likely to occur rapidly (Barrett and Schluter 2008): potentially beneficial alleles are immediately available; alleles start at higher frequencies with higher fixation probabilities; alleles are “older,” and might have been pretested by selection in similar environments (i.e., freshwater in this example).
Our data suggest a variant of the “transporter" process in African cichlids in which gene exchange (at the effective rate of 0.01–0.1 migrant per generation) between river and lake cichlids has facilitated the sharing of genetic polymorphism in time and space. Occasional gene flow between river and lake cichlids, coupled with the phenomena of hybridization (Seehausen 2004), high rates of speciation (Won et al. 2005), and metapopulation dynamics within African lakes, where lineage splitting may be as fast or faster than the fixation of alleles, might allow SNPs caught in transporter cycles to persist for tens of millions of years. Such a scenario is in keeping with recent analyses suggesting a more complex evolutionary history of African cichlids (Genner et al. 2007; Joyce et al. 2011; Schwarzer et al. 2012) and places renewed interest on the population genomics of river cichlids, as well as the subtle life history differences between river and lake populations (e.g., dispersal ability and brood size; Salzburger 2009).
Materials and Methods
Fish Samples and Genotyping
Five hundred seventy-six wild-caught cichlid samples, encompassing 78 genera and more than 160 species, were collected from the Great Lakes Tanganyika, Malawi, and Victoria, as well as numerous other smaller lakes and rivers throughout the African continent (fig. 1 and supplementary table S1, Supplementary Material online). DNA was extracted from fin clips using standard protocols in the laboratories of TD Kocher, JT Streelman, O Seehausen, and W Salzburger.
Two hundred eighty SNPs were initially screened by genotyping for subsequent analyses. This included 214 loci (123 genic and 91 nongenic), selected arbitrarily from among those identified and annotated after low-coverage genome sequencing of five endemic Lake Malawi species (hereby termed “Malawi SNPs”; Loh et al. 2008). Additional SNP sets incorporated loci identified via sequence alignment following previous study, including: 28 “Victoria SNPs” from multispecies alignment of Lake Victoria species; 21 “Tanganyika SNPs” identified from multispecies alignment of Lake Tanganyika species; and 17 “burtoni SNPs” identified from A. burtoni, a riverine species also found in Lake Tanganyika. SNP genotyping was carried out by the Broad Institute on the Sequenom MassArray iPLEX Gold platform, which uses MALDI-TOF mass spectrometry to determine genotypes based on the mass of allele-specific extension products. The assays were designed using Sequenom's MassARRAY Design Software. Our samples included the five individuals survey sequenced for identification of Malawi SNPs as an independent assessment of SNP prediction, sequencing, and/or genotyping fidelity. Table 1 presents the genotyping success of SNPs indexed by ascertainment source. Overall, 78% of SNPs genotyped (219 in total) were passed to subsequent analyses. SNP data have been archived in GenBank on dbSNP (accession numbers 667242258–667242476).
Shared Polymorphism
Polymorphisms shared across populations and/or species can have different evolutionary origins; they may represent old variation 1) inherited from a common ancestor and/or 2) spread by hybridization; alternatively, 3) mutations might have occurred independently. In a first analysis, we identified and tallied all shared or coincident polymorphism, defined as polymorphism observed outside of the ascertained lineage (e.g., variation in “Malawi SNPs” segregating outside of endemic Malawi cichlids), wherein the minor allele was observed in at least three individuals. Because the majority of SNPs in our analysis were ascertained in Malawi cichlids, we focused further on coincident polymorphism in the Malawi SNP data set and subsequently asked how shared variation was distributed across phylogenetic lineages of East African cichlids (following Salzburger and Meyer 2004; Salzburger et al. 2005; Seehausen 2006; Genner et al. 2007; Wagner et al. 2012).
Genetic Clustering and Admixture
To examine genetic structure in the data, we used a Bayesian approach implemented in the STRUCTURE v.2.2 analysis package (Pritchard et al. 2000), which assigns individuals (with admixture allowed) to a predetermined number (K) of clusters, based on genotypes at 219 informative loci (above). We ran 10 replicates for each value of K from 2 to 8 (10,000 burn-in cycles followed by 10,000 cycles of data collection) and identified the minimum number of genetic clusters best representing the data, according to the ad hoc statistic ΔK (Evanno et al. 2005). Unlike most STRUCTURE analyses in which a cluster corresponds to a population or species, we used the method as a clustering tool for large groups of species. Our application of STRUCTURE, with small numbers of individuals sampled per species, and K values far less than the number of species (following Loh et al. 2008) can be seen as a heuristic exploratory approach; one that is justified because of high levels of allele sharing among species, both within and between cichlid species flocks. In addition, PCA was performed using the SmartPCA program of the EigenSoft v3.0 software package (Patterson et al. 2006).
Coalescent Simulation
We used coalescent simulation to model specific demographic scenarios that might explain empirical observations of shared polymorphism. Simulations were performed in MS (Hudson 2002). We adapted MS for our purposes by randomly selecting a single simulated SNP from each of 180 unlinked sequences per data set (180 is the actual number of “Malawi SNPs,” table 1). Each sequence was 1,500 nucleotides in length, matching the average lengths of alignments from which SNPs were empirically ascertained and genotyped (Loh et al. 2008). For every model, we generated 100 replicate data sets corresponding to empirical observations of 180 Lake Malawi SNPs across the African cichlid samples. To account for the ascertainment component of the data, a simulation for a locus was rejected (and resimulated until not rejected), if the Malawi samples were not variable. We calculated the number of loci that exhibited shared polymorphism outside of the Malawi lineage and generated a distribution over the 100 data sets per model, to compare with empirical observation.
We employed a consensus scenario of East African cichlid history in the simulations (supplementary fig. S3, Supplementary Material online; Salzburger and Meyer 2004; Genner et al. 2007; Wagner et al. 2012). Accordingly, we accounted for six groups in the models (supplementary table S2, Supplementary Material online): 1) Lake Tanganyika cichlids, 2) a group of deep (i.e., early) branching haplochromines comprising genera Serranochromis, Pseudocrenilabrus, and Ctenochromis, 3) a second group of haplochromines including the Tropheini, 4) Lake Malawi cichlids, 5) Lake Victoria superflock cichlids, and 6) Astatotilapia cichlids. The phylogeny and divergence times for these groups were fixed; Lake Tanganyika cichlids and the deep-branching haplochromine group diverged at approximately the same time 23 Ma. The second group of haplochromines, including the Tropheini, diverged at 20 Ma, followed by the Lake Malawi lineage at 4.6 Ma and the Lake Victoria superflock at 0.27 Ma (Genner et al. 2007; Wagner et al. 2012).
We varied the following demographic parameters in various combinations: 1) the evolutionary effective population size of every group was assumed to be equal within each model, and set to 10,000, 100,000 or 1,000,000 (Won et al. 2005); 2) the presence/absence of a population bottleneck in Lake Victoria ∼15,000 years ago (Johnson et al. 1996; Seehausen 2002; Verheyen et al. 2003; Elmer et al. 2009); 3) the migration rate between river and lake populations (4Nom, where m is the fraction of each group made up of new migrants each generation) was set to 0, 0.001, 0.01, 0.1, or 1; and 4) the time after lineage divergence during which migration was sustained (100,000 years after divergence, or from divergence to present day). Generation times were assumed to be 1 year.
This approach makes a number of simplifying assumptions. First, our simulations follow alleles in only six groups, treating each group as a randomly mating population, when in reality each group comprised numerous species. There is no species phylogeny in the simulations and therefore no separate parameterization within groups (e.g., no migration parameter within the Malawi group and no separate population sizes for river species). Because there is genetic subdivision within groups in reality but not in the simulations, we do not expect the models to capture evolutionary dynamics within lineages (e.g., substructure within the Malawi flock).
Second, our simulations rely on a particular branching model for the history of each African cichlids. In reality, our understanding of this history is uncertain. For instance, the scenario we implement may fail to account for (multiple) genetic interchanges between particular river species and particular lake assemblages (Verheyen et al. 2003; Genner et al. 2007; Joyce et al. 2011; Schwarzer et al. 2012). As justification, we chose this framework, with simplifying assumptions, precisely to evaluate the specific roles of lineage sorting and/or gene flow between river and lake groups as explanations for empirically determined allele sharing across group boundaries. One useful way to explore the effect of phylogenetic uncertainty with this approach is to model coalescence under different branching scenarios. Thus, we employed our empirical results from STRUCTURE and PCA to assign individuals to alternative groups (supplementary table S2, Supplementary Material online), reflecting the tendency for specific species of the riverine genus Astatotilapia to cluster with members of the Lake Malawi or the Lake Victoria flocks (Joyce et al. 2011; Wagner et al. 2012). Tradeoffs inherent in our simulation strategy highlight the difficulty in modeling evolutionary processes for rapid radiations like East African cichlids that straddle the disciplinary line between phylo- and population genetics.
Genetic Differentiation in Lake Malawi
To investigate the levels of genetic differentiation among Lake Malawi cichlid populations, FST (Weir and Cockerham 1984) for each SNP locus was calculated using FSTAT version 2.9.3.2 (Goudet 1995). Several FST comparisons were performed: among rock-dwelling (mbuna, M), sand-dwelling (non-mbuna, N), and other deep water and pelagic (D) populations; among pairs of M, N, and D lineages; among populations (with >5 samples) grouped by genus; and between the Labeotropheus and Metriaclima genera (Loh et al. 2008; see also supplementary table S1, Supplementary Material online). The empirical distribution of FST values at each genetic locus was used to determine outliers, defined as values exceeding the sum of the upper quartile value and 1.5 times the interquartile range. This approach has been shown in simulation to perform, as well as more sophisticated methods (Narum and Hess 2011) that incorporate evolutionary modeling and/or heterozygosity correlations (e.g., FDIST2, Beaumont and Nichols 1996; LOSITAN, Antao et al. 2008; Arlequin, Excoffier and Lischer 2010; BayeScan, Foll and Gaggiotti 2008). We applied boxplot statistics to the empirical distribution to determine outliers, an additional statistical filter to the histogram strategy (following Loh et al. 2008).
Acknowledgments
The authors thank the National Human Genome Research Institute (U54 HG003067) for funding genotyping experiments under the auspices of the International Cichlid Genome Consortium. Their research is supported by the US National Science Foundation (IOS 1146275 to J.T.S., DEB 0949561 to J.H., DEB 1143920 to T.D.K.), US National Institutes of Health (R01 DE019637 to J.T.S., R01 GM078204 to J.H., R01 HD058635 to T.D.K.), Swiss National Science Foundation (31003A-118293 to O.S., 3100A0-122458 to W.S.), and European Research Council (INTERGENADAPT to W.S.).
References
Author notes
†Present address: Department of Biodiversity and Evolutionary Biology, Museo Nacional de Ciencias Naturales, CSIC, Madrid, Spain
Associate editor: John Parsch
