


Abstract
Environmental drivers of biodiversity can be identified by relating patterns of community similarity to ecological factors. Community variation has traditionally been assessed by considering changes in species composition and more recently by incorporating phylogenetic information to account for the relative similarity of taxa. Here, we describe how an important class of measures including Bray–Curtis, Canberra, and UniFrac can be extended to allow community variation to be computed on a phylogenetic network. We focus on phylogenetic split systems, networks that are produced by the widely used median network and neighbor-net methods, which can represent incongruence in the evolutionary history of a set of taxa. Calculating β diversity over a split system provides a measure of community similarity averaged over uncertainty or conflict in the available phylogenetic signal. Our freely available software, Network Diversity, provides 11 qualitative (presence–absence, unweighted) and 14 quantitative (weighted) network-based measures of community similarity that model different aspects of community richness and evenness. We demonstrate the broad applicability of network-based diversity approaches by applying them to three distinct data sets: pneumococcal isolates from distinct geographic regions, human mitochondrial DNA data from the Indonesian island of Nias, and proteorhodopsin sequences from the Sargasso and Mediterranean Seas. Our results show that major expected patterns of variation for these data sets are recovered using network-based measures, which indicates that these patterns are robust to phylogenetic uncertainty and conflict. Nonetheless, network-based measures of community similarity can differ substantially from measures ignoring phylogenetic relationships or from tree-based measures when incongruent signals are present in the underlying data. Network-based measures provide a methodology for assessing the robustness of β-diversity results in light of incongruent phylogenetic signal and allow β diversity to be calculated over widely used network structures such as median networks.
Introduction
Measures of β diversity are used to assess variation in community composition between sample sites. Examining patterns of β diversity across environmental gradients, between treatment conditions, or over time provides insights into the spatiotemporal dynamics of communities and the influence of ecological factors on biodiversity (Anderson et al. 2011). β-diversity measures have been used in studies such as the investigation of human migration patterns (Kayser et al. 2008; HUGO Pan-Asian SNP Consortium 2009), the exploration of the structure of human-associated bacterial communities (Costello et al. 2009; Caporaso et al. 2011), and the comparison of diversity patterns exhibited by micro- and macro-organisms across environmental gradients (Bryant et al. 2008; Rousk et al. 2010; Martiny et al. 2011). Although community variation has traditionally been assessed by considering changes in species composition with “taxon-based” measures such as the Bray–Curtis or Canberra indices, more recent methods account for the relative similarity of taxa with “sequence-based” measures that consider the genetic distance between aligned sequences (e.g., FST: Hudson et al. 1992; Martin 2002; Holsinger and Weir 2009) or with “phylogenetic-based” measures that compute distances between taxa using a phylogenetic tree (e.g., UniFrac; Lozupone and Knight 2005). Phylogenetic-based measures are becoming increasingly popular as they are complementary to taxon-based measures (Graham and Fine 2008; Hamady et al. 2010) and eliminate the need to separate units of diversity into predefined groups. Here, we describe how an important class of β-diversity measures, which includes the Bray–Curtis, Canberra, and UniFrac measures, can be extended to account for phylogenetic uncertainty and conflict.
Although phylogenetic-based measures are relatively robust to the methods used for phylogenetic inference (Lozupone et al. 2007), they calculate similarity over a single phylogenetic tree that is presumed to be correct. In practice, there may be multiple trees supported by the available phylogenetic signal. Consideration of a set of bootstrapped trees or the Bayesian posterior distribution of trees has been used to account for this phylogenetic uncertainty to provide more robust statistical tests (Wang et al. 2001; Jones and Martin 2006; Lozupone et al. 2008; Parker et al. 2008). The use of jackknifed trees has also been considered to evaluate the robustness of phylogenetic-based measures of β diversity to sampling depth and evenness (Lozupone et al. 2007), and this approach could be adopted to account for phylogenetic uncertainty. Our approach differs from these efforts by incorporating phylogenetic uncertainty into the inferred evolutionary history of a set of sequences and calculating community similarity over this more general model of shared ancestry known as a phylogenetic network.
Phylogenetic networks are a generalization of phylogenetic trees and can be divided into two distinct classes (Huson and Bryant 2006): 1) implicit networks, which represent phylogenetic uncertainty and conflict in the available phylogenetic signal, and 2) explicit networks, which represent evolutionary histories that may contain reticulate events such as hybridization or lateral gene transfer. Phylogenetic uncertainty and conflict can arise when there is insufficient signal to adequately resolve all branches of a bifurcating evolutionary process (Ho and Jermiin 2004; Kennedy et al. 2005) or when the underlying evolutionary history of a set of taxa contains reticulate events. Implicit networks aim to represent all, or at least many, plausible evolutionary scenarios for a set of taxa (Huson and Scornavacca 2011; Morrison 2011). In contrast, explicit networks aim to describe a single biologically plausible phylogeny, which may include reticulate connections.
This article considers split systems, a widely used class of implicit networks (Huson and Scornavacca 2011). A split X|Y is a bipartition of the taxa into two nonempty, disjoint subsets X and Y. Phylogenetic trees can be described, without loss of information, by a compatible split system. As such, β-diversity measures defined on a phylogenetic tree can be expressed in terms of a compatible set of splits. More generally, a split system may contain incompatible splits, in which case it can be represented graphically as a split network or as a table enumerating all splits (fig. 1). Graphically, a split is represented by one or more parallel lines. Each split has a weight representing, among other possibilities, the amount of evolutionary change that has occurred between the taxa on either side of the split. Here, we describe how measures of β diversity can be extended to incompatible sets of splits.
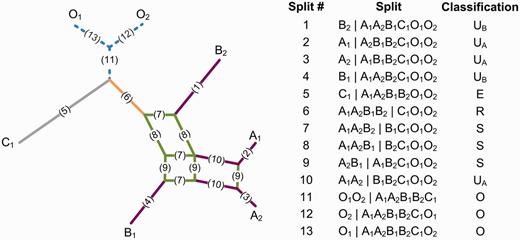
Example of a rooted split system depicted as a split network and a table of splits. Each split has been assigned a number and is represented by one or more parallel edges in the split network (e.g., the two lines labeled 10 represent the split A1A2|B1B2C1O1O2). The split system contains taxa from three communities labeled A, B, and C and has been rooted using the outgroup taxa labeled O. Splits are classified with respect to communities A and B: unique to community A (UA: purple), unique to community B (UB: purple), shared (S: green), root (R: orange), external (E: gray), or outgroup (O: blue).
We have focused on split systems as they are widely used within the biological sciences and include phylogenetic trees as a special case. Character-based (Bandelt and Dress 1993; Bandelt et al. 1995), distance-based (Bandelt and Dress 1992; Bryant and Moulton 2004), and tree-based (Huson et al. 2004; Holland et al. 2005, 2007) methods for inferring incompatible split systems have all been proposed. Implementations of many split system algorithms are available in Spectronet (Huber et al. 2002) and SplitsTree4 (Huson and Bryant 2006). Two popular inference methods are the character-based median network method (Bandelt et al. 1995), which is commonly used to study the relationships between human haplogroups (Bandelt et al. 1995; Herrnstadt et al. 2002), and the distance-based neighbor-net method (Bryant and Moulton 2004), which is often applied to provide further insights into poorly understood or complex phylogenies (Morrison 2005; Huson and Bryant 2006). Neighbor-nets have also been used within conservation planning to account for conflicting phylogenetic signal (Spillner et al. 2008; Minh et al. 2009) and as a method for visualizing the relationships between communities as determined by a β-diversity analysis (Mitra et al. 2010).
Our proposed extension allows phylogenetic β diversity to be measured over unrooted and rooted (i.e., as defined by a set of outgroup taxa) split systems. For rooted systems, both qualitative (i.e., presence–absence, unweighted) and quantitative (i.e., weighted) measures can be computed, which allows changes in both community richness and evenness to be investigated (Legendre and Legendre 1998; Lozupone et al. 2007). Many of the quantitative measures can also be applied to unrooted split systems. We demonstrate the validity and utility of calculating network-based diversity by analyzing three distinct data sets: pneumococcal isolates from distinct geographic regions, human mitochondrial DNA (mtDNA) data from the Indonesian island of Nias, and proteorhodopsin sequences from the Sargasso and Mediterranean Seas. These data sets illustrate the calculation of β diversity over varying network structures (i.e., neighbor-nets and median networks), the impact of incompatible splits on measured dissimilarity, and the contrasting results obtained when applying qualitative and quantitative network-based measures. In all cases, we found that previously determined major patterns of variation can be recovered on an incompatible split system indicating the robustness of these results to phylogenetic uncertainty and conflict. Nonetheless, finer-scale analyses revealed that the dissimilarity of communities can differ substantially when the evolutionary history of taxa is allowed to include incompatible splits (i.e., when a network is inferred as opposed to a tree) or with the measure of β diversity considered (e.g., weighted UniFrac in contrast to FST).
Materials and Methods
Measuring Qualitative Phylogenetic β Diversity over a Rooted Split System
Here, we propose a classification scheme for splits within a rooted split system, which allows qualitative phylogenetic β-diversity measures to be applied to such systems. For each pair of communities, i and j, all splits within a rooted split system can be classified as "unique," "shared," "root," "external," or "outgroup" using the following definitions (fig. 1 and supplementary table S1, Supplementary Material online):
Unique split: A split (i.e., X|Y) is unique to community i only when a subset induced by the split (i.e., either X or Y) contains a taxon or taxa from community i and does not contain any taxa from community j or the outgroup.
Shared split: A split is shared by communities i and j only when 1) there is a subset induced by the split that contains taxa from communities i and j and no taxa from the outgroup and 2) the other subset contains at least one taxon from community i or j.
Root split: A split is a root of communities i and j only when 1) there is a subset induced by the split that contains all the taxa from these communities and no taxa from the outgroup and 2) the other subset contains at least one ingroup taxon.
External split: A split is external to communities i and j only when there is a subset induced by the split that contains only taxa from other communities within the study and no taxa from the outgroup.
Outgroup split: A split belongs to the outgroup when there is a subset induced by the split that contains only outgroup taxa. Additionally, any split where both induced subsets contain outgroup taxa is defined as an outgroup split even if both subsets also include ingroup taxa. In practice, such splits often occur even for a set of credible outgroup taxa.
The terms a, b, c, and d are used to define many qualitative taxon-based measures (Koleff 2003; Kuczynski et al. 2010). Using the above classifications, these terms can be applied to a split system by defining a as the total split weight shared by communities i and j, b as the total split weight unique to community i, c as the total split weight unique to community j, and d as the total split weight external to communities i and j. Ferrier et al. (2007) and Nipperess et al. (2010) have proposed similar definitions for extending these taxon-based terms to phylogenetic trees. Although Ferrier et al. do not specify how root or external branches were to be treated, Nipperess et al. implicitly treat root branches as shared (i.e., contribute to a).
Our definitions are more general as they can be applied to split systems and explicitly differentiate between shared and root splits. This latter distinction is critical as it allows calculations to be restricted to the most recent common ancestor tree of a pair of communities, which can substantially influence the dissimilarity measured between a pair of communities (Parks and Beiko 2012). For example, unweighted UniFrac is defined as (b + c)/(a + b + c) but produces two distinct measures depending on whether root splits contribute to a or d. Ambiguity already exists with both the Fast UniFrac web interface (Hamady et al. 2010) and QIIME (Caporaso et al. 2010) implicitly treating root branches as contributing to a, whereas mothur (Schloss et al. 2009) treats these branches as contributing to d by default (though it does give users the choice to treat these branches as contributing to a).
Measuring Quantitative Phylogenetic β Diversity over a Rooted Split System
Many quantitative phylogenetic β-diversity measures consider the proportion of taxa from communities i and j descendant from branch n (pin and pjn, respectively) along with the length of the branch (Wn). These terms can be adapted to a rooted split system by defining pin as the proportion of taxa from community i within the subset induced by split n that contains no outgroup taxa. Splits where both induced subsets contain outgroup taxa are ignored. Within a split system, Wn is simply the weight of split n. For example, on a split system, the commonly used Manhattan or weighted UniFrac (Lozupone et al. 2007) measure is given by  where the summation is over all splits within the split system. We have recently evaluated a large number of measures that are a strict function of pin, pjn, and Wn (Parks and Beiko 2012).
Measuring Qualitative and Quantitative Phylogenetic β Diversity over an Unrooted Split System
In practice, a credible rooting for a split system cannot always be established and phylogenetic β diversity must be determined with a root invariant measure, that is, a measure producing the same result regardless of root placement. Although root invariant qualitative measures such as the mean nearest neighbor distance and mean phylogenetic distance do exist (Webb et al. 2008; Parks and Beiko 2012), any qualitative measures that must distinguish between shared and unique splits require a rooted split system. To our knowledge, all measures that are a function of the terms a, b, c, and d require distinguishing between these two types of splits. This is unfortunate as these measures are among the most commonly used and best understood qualitative measures. In contrast, many of the most commonly used quantitative measures such as Manhattan, Euclidean, and Gower are root invariant (Parks and Beiko 2012).
Interpretation of β Diversity Measured over a Split System
Calculating β diversity over a split system allows incompatible splits representing phylogenetic uncertainty or conflict to be considered (fig. 2). When splits are assigned a weight proportional to the amount of phylogenetic signal supporting the split and accurately reflect the available signal, the dissimilarity measured between a pair of communities will be an average over phylogenetic uncertainty and conflict. In practice, it is often unclear how to best represent the available phylogenetic signal, and many inference methods have been proposed. In this article, we consider split systems inferred with the unweighted pair group method with arithmetic mean (UPGMA; Legendre and Legendre 1998), neighbor-joining (Saitou and Nei 1987), neighbor-net (Bryant and Moulton 2004), and median network (Bandelt et al. 1995) methods. UPGMA assumes a constant rate of evolution and produces an ultrametric tree where branch lengths must be adjusted to account for any discordant phylogenetic signal. Neighbor-joining relaxes the molecular clock assumption and aims to infer a tree of minimal length under the "balanced minimum evolution" criterion (Gascuel and Steel 2006). Neighbor-net infers a more general split system consisting of a collection of circular splits, which can contain mutually incompatible splits. A set of circular splits can always be represented as a planar split network (Dress and Huson 2004), and neighbor-net tends to produce well-resolved networks (Bryant and Moulton 2004). Notably, neighbor-net will infer a tree if the provided distance matrix is additive, that is, can be perfectly represented by a tree (Bryant et al. 2007). A median network allows all splits within a set of "binary" sequences to be inferred. Although the resulting split systems are often too complicated to visualize (Huber et al. 2001), β diversity can still be calculated over the inferred splits. The split systems inferred with alternative methods can differ substantially, which will directly influence the phylogenetic dissimilarity measured between a pair of communities. These differences in community similarity must be interpreted with respect to how phylogenetic uncertainty and conflict are treated, and the varying assumptions made by each method.
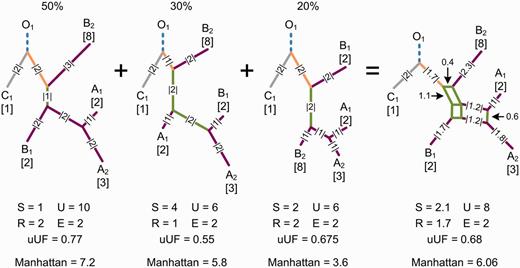
Measuring β diversity over a split system provides an average over phylogenetic uncertainty and conflict. A set of trees representing alternative evolutionary histories for a set of taxa is given on the left along with the percentage of data supporting each tree. This could represent the percentage of trees within a collection of trees or the percentage of sites within a multiple sequence alignment supporting each tree. The splits contained within this set of trees can be represented by the split network on the right. Splits within the network have a weight equal to their mean length within the set of trees. The total weight of shared (S), unique (U), root (R), and external (E) splits is given below each phylogeny. Splits are colored in the same manner as figure 1. Dissimilarity values obtained with the unweighted UniFrac (uUF) and quantitative Manhattan measures for communities A and B are also given. The uUF distance measured on the split network is not the mean of the uUF distances measured over the set of trees. When calculating β diversity over a split system, each split within the set of trees is considered and weighted by the amount of phylogenetic signal supporting the split.
Pneumococcus Data Set
A multilocus sequence typing (MLST) data set of Streptococcus pneumoniae serotype 1 isolates from 29 geographic regions was compiled from previous studies (supplementary table S2, Supplementary Material online). These studies characterized isolates by sequencing fragments of seven genes according to the protocol of Enright and Spratt (1998). Each allele was assigned a distinct number, and each set of seven unique alleles specifies a sequence type (ST). The distance between STs is the number of alleles in which they differ. Using these distances, a UPGMA tree, neighbor-joining tree, and neighbor-net were inferred with SplitsTree v4.12.3 (Huson and Bryant 2006). The relationship between samples was visualized using a UPGMA tree. Jackknife values were calculated over 100 independent trials to assess the robustness of results to sequence subsampling (Lozupone and Knight 2005). For each trial, sequences were randomly drawn to reduce each sample to the number of sequences contained in the smallest sample.
mtDNA Data Set
mtDNA sequences covering the first hypervariable segment were collected by van Oven et al. (2011) from nine groups on Nias, Indonesia. We obtained these sequences from the NCBI PopSet database and analyzed all groups with a sample size greater than 10. Sequences were aligned with MUSCLE v3.8.31 (Edgar 2004) using default parameters. A median network was inferred from a binary character representation of the aligned sequences using SplitsTree v4.12.3. Of the 59 variable sites, only 6 contained more than 2 character states. These sites were converted to binary characters using an R/Y encoding. This favors transversional changes by converting bases A and G to Y (pyrimidine), and bases C and T to R (purine). This encoding scheme is used by Spectronet (Huber et al. 2002) and is similar to the encoding proposed by Bandelt et al. (1995). Pairwise FST values were calculated using Arlequin 3.5.1.3 (Excoffier et al. 2005). Principal coordinate analysis (PCoA) plots were generated using custom scripts. Geographic visualizations showing the similarity of Hia to other groups on Nias were generated with GenGIS (Parks et al. 2009).
Proteorhodopsin Data Set
Proteorhodopsin sequences from 12 samples collected by Sabehi et al. (2007) and three additional Mediterranean Sea samples submitted by Sabehi and Béjà (ABD84734–ABD85012) were retrieved from GenBank. Protein sequences were aligned with MUSCLE v3.8.31 using default parameters. Initial and trailing columns were trimmed if they contained missing data for >90% of the sequences. Maximum-likelihood distances between sequences were calculated with the WAG model of protein substitution (Whelan and Goldman 2001), and a neighbor-net was inferred with SplitsTree v4.12.3. The phylogeny was rooted with a eukaryotic rhodopsin from Pyrocystis lunula (AAO14677; de la Torre et al. 2003; Sabehi et al. 2005, 2007). The relationship between samples was visualized using a UPGMA tree and jackknife values calculated as described for the pneumococcus data set. Genotype-specific samples were also considered by assigning each protein sequence as either preferentially blue-absorbing (BPR) or green-absorbing (GPR) based on whether the amino acid at position 105 was a glutamine or leucine, respectively (supplementary table S3, Supplementary Material online). Eight green-absorbing sequences containing a methionine at position 105 were ignored to replicate the data set considered by Sabehi et al. (2007). When calculating unweighted UniFrac values, we treated root splits as contributing to a (i.e., shared between the two communities).
Software Availability
Our software, Network Diversity, for calculating 11 qualitative and 14 quantitative network-based measures of phylogenetic β diversity is freely available at http://kiwi.cs.dal.ca/Software/NetworkDiversity, last accessed August 23, 2012. The software is open source and released under the GNU General Public License. It is compatible with split systems generated by the widely used SplitsTree4 software. The software is designed for large data sets, and the limiting factor for most analyses will be the computational resources required to infer the underlying split system. On a split system containing 10,000 taxa from 500 environmental samples, calculating the β diversity between all pairs of samples requires approximately 10 min on a standard desktop computer. A comprehensive comparative analysis of the measures available in our software has been conducted, which provides practical advice on selecting a subset of measures likely to produce complementary insights into a particular data set (Parks and Beiko 2012).
Results
Pneumococcal Biogeography: Alternative Phylogenies Influence β Diversity
Pneumococcal infections are a major cause of morbidity and mortality, causing diseases ranging in severity from otitis media to meningitis and pneumonia. Serotype 1 pneumococci are increasingly responsible for invasive pneumococcal diseases in several countries (Henriques Normark et al. 2001; McChlery et al. 2005; Obando et al. 2008) and a major cause of pneumonia and pulmonary empyema in children (Esteva et al. 2011). Here, we consider the biogeography of serotype 1 isolates from 29 distinct geographic regions spanning 4 continents (supplementary table S2, Supplementary Material online). We investigated the geographic distribution of serotype 1 by applying the Manhattan phylogenetic β-diversity measure to a neighbor-net, neighbor-joining tree, and UPGMA tree inferred from serotype 1 MLST data. Differences between these results reveal that the underlying phylogeny can substantially influence the similarity measured between communities.
Hierarchical clustering of the Manhattan distances obtained over a neighbor-net shows clear geographic structuring (fig. 3A). A well-supported clustering separates North American and European serotype 1 populations from those in Africa, Asia, and South America. The North American and European cluster is itself separated into its respective continents with the exception of England, which falls within the North American cluster. Although the isolates collected from South America appear highly distinct from those obtained in other regions, isolates collected from countries in Africa and Asia are intermixed indicating they contain similar serotype 1 clones. These results are in agreement with an earlier study of serotype 1 isolates collected from 14 countries (Brueggemann and Spratt 2003). This is highly encouraging as Brueggemann and Spratt drew their conclusions by considering a UPGMA phylogeny of serotype 1 STs along with a table indicating the number of times each ST is observed in a country. Phylogenetic β-diversity measures require the same data as input but provide a less subjective and more scalable methodology for exploring the relative similarity between populations.
Similarity of pneumococcus isolates from 29 countries measured over a neighbor-net or UPGMA tree. (A) Hierarchical clustering of the neighbor-net distance matrix with jackknife values greater than 60 indicated. Colors indicate the continent of each sample. (B) Scatter plot relating the dissimilarity values for every pair of countries over a neighbor-net (x axis) or UPGMA tree (y axis). The y = x line is shown as a dashed line, the linear regression line is shown in red, and Pearson's correlation coefficient is given in the top-left corner. (C) Distances measured over a neighbor-net and UPGMA tree, which differ substantially for select pairs of geographic regions. (D) Histogram of the percentage difference between distances measured for every pair of geographic regions when the full data set is considered or when a de novo analysis is performed for each pair. (E) Comparison of distances measured between Mozambique (MOZ), Spain (ESP), and India (IND) when considering the full data set or performing a de novo analysis using only STs from these three countries. To show that a linear scaling does not make the distances congruent, each set of measurements was normalized by the longest distance between any pair of countries.
Calculating β diversity over a UPGMA tree gives similar results to those obtained on a neighbor-net (fig. 3B) despite the neighbor-net containing an additional 67 (47% increase) splits (fig. 4). Although the majority of pairwise distances between geographic regions are robust to the underlying phylogeny, differences do exist. For example, the distance measured between isolates from Scotland and the Spanish city of Gipuzkoa is substantially larger when considering a UPGMA tree instead of a neighbor-net (fig. 3C; 1.12 vs. 0.74). A simple scaling cannot be used to resolve such incongruencies as many pairwise distances are already in agreement (e.g., Gipuzkoa and Czech Republic). To further investigate how β-diversity results differ under alternative phylogenies, we compared the distances measured between every pair of geographic regions when all STs are considered or when a de novo analysis is performed using only the STs from the pair of regions under consideration. Distances changed more drastically when they were calculated over a UPGMA tree (fig. 3D). For example, although the distances measured between Mozambique, Spain, and India are nearly identical when measured over a neighbor-net inferred on the full data set or de novo, they change substantially when a UPGMA tree is used as the underlying phylogeny (fig. 3E). This suggests that considering the distance between specific subsets of samples will generally be more robust when β diversity is measured over a neighbor-net. Repeating the above analysis with a neighbor-joining tree also indicates that measuring β diversity over a neighbor-net will readily recover strong patterns of variation but that consideration of phylogenetic uncertainty and conflict can substantially change the dissimilarity measured between certain samples, for example, Québec (supplementary fig. S1, Supplementary Material online).
UPGMA tree and neighbor-net of pneumococcus serotype 1 isolates from 29 geographic regions. For clarity, only the most common STs are shown along with STs useful as landmarks. The UPGMA tree consists of 143 splits and has a fit statistic of 0.81, whereas the neighbor-net consists of 210 splits and has a fit statistic of 0.93. Fit is defined as the sum of all pairwise distances between taxa in the tree divided by the sum of all pairwise distances in the input distance matrix.
mtDNA Diversity in Nias: Contrasting Sequence- and Phylogenetic-Based Measures
Nias is an Indonesian island located approximately 120 km off the western coast of Sumatra. Its inhabitants are known for their distinctive architecture (Bontaz 2009) and unique Austronesian dialect (Gray et al. 2009). Within Nias, there is a cultural and linguistic division between the northern and southern portions of the island (Beatty 1993; Bontaz 2009). A recent genetic study of Niasans found Y chromosome haplogroups to be strongly differentiated between south and north populations, whereas mtDNA haplogroups were more evenly distributed throughout the island (van Oven et al. 2011). The more uniform distribution of mtDNA haplogroups is likely the result of Niasan culture whereby a woman must marry a man from a different clan and relocate to her husband’s village. Here, we determine whether consideration of the phylogenetic relationships between mtDNA HSV1 sequences changes the conclusions of van Oven et al. (2011).
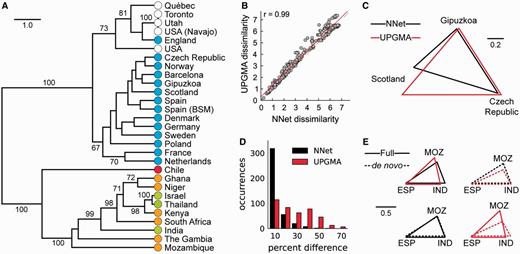
We assessed the similarity of Niasan groups by applying the phylogenetic-based Manhattan measure to a median network and the sequence-based FST measure. These two dissimilarity measures produce distinct patterns of relationships between Niasan groups (figs. 5A and B). Most notably, under FST, the Si’ulu population from southern Nias appears relatively distinct from all other populations, whereas the Manhattan measure identifies this population as being closely related to the southern Sarumaha population. This striking difference occurs despite the two measures being reasonably correlated (fig. 5C). Differences are not confined to the Si’ulu population nor are they an artifact of the PCoA plots. For example, the relative similarity of the centrally located Hia group to the other Niasan groups depends strongly on the dissimilarity measure used (figs. 5D and E), and subsets of groups exist whose dissimilarity is only poorly correlated between the two measures (fig. 5F; Pearson’s r = 0.37). Although consideration of the phylogenetic structure between mtDNA sequences substantially changes the relative similarity between Niasan groups, our results largely corroborate the conclusions of van Oven et al. (2011). Neither the FST nor Manhattan measures support a north–south division in mtDNA diversity.
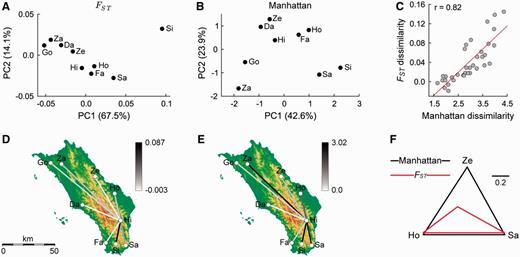
Similarity of nine groups residing on Nias determined using FST or by applying the Manhattan phylogenetic β-diversity measure to a median network. Ethnic groups are abbreviated as follows: Daeli (Da), Fau (Fa), Gözö (Go), Hia (Hi), Ho (Ho), Sarumaha (Sa), Si’ulu (Si), Zalukhu (Za), and Zebua (Ze). PCoA plot of FST values (A) and Manhattan distances (B). The percentage of total variance explained by each axis is shown in parentheses. (C) Scatter plot relating the dissimilarity values for every pair of groups determined with the Manhattan (x axis) or FST (y axis) measures. The linear regression line is shown in red and Pearson's correlation coefficient is given in the top-left corner. Dissimilarity measured between Hi and each of the other eight groups as determined using the FST (D) or Manhattan (E) measures. (F) Comparison of FST values and Manhattan distances between the Ho, Sa, and Ze ethnic groups. To aid in comparing the relative magnitude of values, each set of measurements was normalized by the longest distance between any pair of groups.
Distribution of Proteorhodopsins: Qualitative and Quantitative β Diversity
Proteorhodopsin proteins provide a diverse range of aquatic bacteria with a light-driven proton pump suggesting that photosynthesis may play a significant role in the metabolism of aquatic ecosystems (Béjà et al. 2000; Sharma et al. 2008). To investigate the distribution of proteorhodopsin proteins, Sabehi et al. (2007) collected sequences from 12 environmental samples. Three samples were taken at the BATS station in the Sargasso Sea in March 1998 and March 2003 when deep water mixing occurs, and another three samples were collected in July 1998 when the water is highly stratified. Samples were taken at depths of 0, 40, and 80 m. Analogous samples were taken from the H01 station in the Mediterranean Sea in January 2006 (mixed) and May 2003 (stratified) at depths of 0, 20, and 50–55 m. Here, we analyze these samples along with three additional Mediterranean samples taken at the same depths and collected 90 km away at the TB04 station in February 2006 (supplementary table S3, Supplementary Material online). We consider a rooted neighbor-net to establish that the conclusions of Sabehi et al. (2007) regarding the geographic, seasonal, and depth structuring of these samples can be recovered using both a qualitative and quantitative network-based measure of β diversity. Furthermore, we investigate the structuring of specific proteorhodopsin genotypes.
Hierarchical clustering of the unweighted UniFrac dissimilarities among proteorhodopsin communities revealed perfect clustering by geographic location and a strong seasonal dependence (fig. 6A). Samples taken at different depths during periods of water mixing were more similar to each other than the stratified samples, but both sets of samples showed geographic structuring (fig. 6B). Under the quantitative Manhattan measure, stratified communities were no longer separated perfectly by geography (supplementary fig. S2A, Supplementary Material online) and showed high variation in the dissimilarity measures between samples (supplementary fig. S2B, Supplementary Material online). In contrast, mixed communities were strongly geographically structured and even showed small-scale structuring between the H01 and TB04 samples taken only 90 km apart. The average Manhattan distance between samples is 0.14 for the mixed H01 samples and 0.12 for TB04 samples, in comparison to 0.23 across these two sets of samples. Together, the qualitative and quantitative results suggest that during periods of water mixing the proteorhodopsin proteins at these two stations are similar but differ in their relative abundance.
![Relationship between proteorhodopsin communities and genotype-specific samples determined by applying unweighted UniFrac to a rooted neighbor-net. (A) Hierarchical clustering of 15 proteorhodopsin samples collected from the Sargasso (Sar) or Mediterranean (Med) Seas with jackknife values greater than 50 indicated. (B) Mean (±standard error of the mean [SEM]) unweighted UniFrac dissimilarity values for all samples either within the same or between (BW) the two sampling locations. The same analysis was also repeated using only samples taken during periods of deep water mixing or when the water is highly stratified. (C) Hierarchical clustering of blue (BPR) and green (GPR) proteorhodopsin genotype samples with jackknife values greater than 40 indicated. (D) Mean (±SEM) unweighted UniFrac dissimilarity values for samples from the same genotype or between samples from different genotypes. Results are also shown for BPR samples collected from the Sargasso or Mediterranean Seas.](https://oup.silverchair-cdn.com/oup/backfile/Content_public/Journal/mbe/29/12/10.1093_molbev_mss200/1/m_mss200f6p.jpeg?Expires=1750264095&Signature=f1msdpjK3CZFc5aNuK2kenGJ7wnSxjFbumfrXnn-Cu-CjYT-y11p45INHeGfeMS5L1RlpkRattdMTjIVS7ugHTsR9aLstJCq4SshTGJtn6ir-fYD5sNWl0gpuzQi-4RXX721-EHNMqu5dogn6p4RfqHmUUrbRdtqRL76J8z3FES3lV4e7v35gtzW0DSzpZQWOzIpg5jJSkK4GILhZmEywpxxuwqM4uuI0gtiXURIMm4GgPmYzycQ9yN6J9eJU78Q8xy91LN5en8Ddy-r2WXeO6m6ozie~CcFDeRw749wAZA6cbLZx-zODHHGxf~73OjSwVlTiq-K9eLN~ZbkMn2mSQ__&Key-Pair-Id=APKAIE5G5CRDK6RD3PGA)
Relationship between proteorhodopsin communities and genotype-specific samples determined by applying unweighted UniFrac to a rooted neighbor-net. (A) Hierarchical clustering of 15 proteorhodopsin samples collected from the Sargasso (Sar) or Mediterranean (Med) Seas with jackknife values greater than 50 indicated. (B) Mean (±standard error of the mean [SEM]) unweighted UniFrac dissimilarity values for all samples either within the same or between (BW) the two sampling locations. The same analysis was also repeated using only samples taken during periods of deep water mixing or when the water is highly stratified. (C) Hierarchical clustering of blue (BPR) and green (GPR) proteorhodopsin genotype samples with jackknife values greater than 40 indicated. (D) Mean (±SEM) unweighted UniFrac dissimilarity values for samples from the same genotype or between samples from different genotypes. Results are also shown for BPR samples collected from the Sargasso or Mediterranean Seas.
Proteorhodopsins are preferentially blue-absorbing (BPR) or green-absorbing (GPR) based largely on the amino acid at position 105 (Béjà et al. 2001; Man et al. 2003). The structuring determined above may be reliant on both spectral genotypes, primarily due to a single genotype, or observed individually for each genotype. To test this, we define genotype communities by dividing each sample into two sets consisting exclusively of BPR or GPR proteins. This results in 24 genotype communities as only a single GPR sequence was found in the Sargasso Sea. Applying the unweighted UniFrac measure to these communities indicated that these two genotypes are phylogenetically distinct (figs. 6C and D). Congruent with the results for the undivided samples, strong seasonal dependencies were observed for both genotypes. However, perfect geographic clustering was not observed between the BPR samples indicating that this structuring is largely due to the absence of GPR proteins in the Sargasso Sea. Similar results were obtained under the Manhattan measure. Samples clustered perfectly by genotype and showed strong seasonal structuring within each genotype (supplementary figs. S2C and Supplementary Data, Supplementary Material online). Although there was evidence of small-scale geographic structuring between the mixed BPR samples from H01 and TB04, the mixed GPR samples showed little structuring. This may be a result of higher dispersal of GPR proteins relative to BPR proteins. However, the small number of GPR proteins found within these samples may be unduly influencing the results, and deeper sequencing is required to further explore the structuring of specific proteorhodopsin genotypes.
Discussion
Tree inference algorithms produce a single tree model even if there is substantial incongruent phylogenetic signal, whereas split systems allow uncertainty and conflict to be modeled. Phylogenetic β-diversity measures have been shown to produce similar results under varying tree inference methods (Lozupone et al. 2007), and we have repeatedly observed, at least when strong patterns of community variation exist, that dissimilarity values will remain highly correlated even when measuring β diversity over an incompatible split system (data not shown). Identifying similar patterns of community variation on an inferred tree and on a split system provides strong evidence that results are not due to systematic errors (e.g., the forcing of data into a tree model). For this reason, we recommend measuring dissimilarity on a network as it demonstrates that a given pattern of variation is robust to uncertainty and conflict in the available phylogenetic signal. When community relationships are sensitive to the underlying method used for phylogenetic inference, results must be interpreted carefully. For example, although the primary conclusions regarding the biogeographic distribution of pneumococcus serotype 1 were recovered using UPGMA, neighbor-joining, and neighbor-net, the placement of the Quebec sample depended on whether phylogenetic inference was performed with neighbor-joining or neighbor-net (contrast fig. 3A and supplementary fig. S1A, Supplementary Material online). This may be the result of the neighbor-joining algorithm forcing incongruent signal into a tree model or the neighbor-net algorithm inferring incompatible splits that would best be viewed as phylogenetic noise.
Our analysis of mtDNA diversity in Nias demonstrates that dissimilarity values obtained using the sequence-based FST measure can vary considerably from those obtained by applying the Manhattan measure to a median network (Pearson’s r = 0.82). This disagreement between β-diversity measures, while not necessarily surprising, is of particular interest as it contrasts the population- and lineage-based approaches commonly used in studies of human biogeography (Pakendorf and Stoneking 2005). In a population-based analysis, FST or a related measure is used to explore the relationship between populations, whereas in a lineage-based analysis, a (often simplified) median network is used to investigate the evolutionary history of mtDNA or Y-chromosome haplogroups (Bandelt et al. 1995; Huber et al. 2001). By extending β-diversity measures to median networks, population-based analyses can be performed directly over a median network instead of on the underlying sequence data. In practice, the dissimilarity values obtained by applying FST to sequence data or by applying the Manhattan measure to a median network can be highly negatively correlated indicating that these measures provide complementary insights into the variation between populations (supplementary fig. S3, Supplementary Material online). Further investigation is warranted to determine which network-based β-diversity measures are best suited for studying human populations, the influence biologically motivated simplifications of median networks have on measured β diversity (i.e., reduced and pruned networks, Bandelt et al. 1995; Huber et al. 2001) and how network-based measures complement traditional sequence-based measures.
Qualitative and quantitative measures of β diversity provide complementary information on community variation (Legendre and Legendre 1998; Lozupone et al. 2007). On the proteorhodopsin data set, communities sampled during periods of water mixing were found to be strongly geographically structured under both the unweighted (qualitative) UniFrac and quantitative Manhattan measures. This suggests that unique proteorhodopsin lineages are present in the Sargasso and Mediterranean Seas (qualitative results) and that such lineages do not consist only of rare proteins (quantitative results). In contrast, the small-scale geographic structuring between the H01 and TB04 samples is only recovered under the quantitative Manhattan measure suggesting that these sites contain similar proteins but in different abundances. Although the additional insights provided by applying both a qualitative and quantitative measure are clear, in practice applying qualitative measures is complicated by requiring a rooted split system (Parks and Beiko 2012). Rooting an incompatible split system can be problematic as there will often be several low-weight splits where both induced subsets contain ingroup and outgroup taxa. As such, our proposed definitions for calculating qualitative and quantitative β diversity on a split system ignore any splits where both induced subsets contain outgroup taxa. Nonetheless, care should be taken to ensure that outgroup taxa are tightly clustered within the split system. For closely related taxa, an interesting alternative is to root a split system based on neutral coalescent theory (Castelloe and Templeton 1994).
We have described how an important class of phylogenetic β-diversity measures can be applied to split systems containing incompatible splits. This allows phylogenetic uncertainty and conflict to be considered in the assessment of community variation and provides a methodology for testing whether the assumption of a bifurcating evolutionary history is causing erroneous patterns of relationships between communities. Although split systems are the mostly widely used class of phylogenetic networks, they suffer from providing only an abstract representation of the relationship between taxa. Extending β-diversity measures to networks that explicitly model recombination or hybridization would allow the influence of these evolutionary events on community variation to be explored. We believe the branch classification scheme proposed here is a strong starting ground for extending β-diversity measures in this direction.
Acknowledgments
This work was supported by the Killam Trusts and the Tula Foundation to D.H.P. and by Genome Atlantic, the Canada Foundation for Innovation, and the Canada Research Chairs program to R.G.B.
References
Author notes
Associate editor: Barbara Holland
