


Abstract
We estimated the intensity of selection on preferred codons in Drosophila pseudoobscura and D. miranda at X-linked and autosomal loci, using a published data set on sequence variability at 67 loci, by means of an improved method that takes account of demographic effects. We found evidence for stronger selection at X-linked loci, consistent with their higher levels of codon usage bias. The estimates of the strength of selection and mutational bias in favor of unpreferred codons were similar to those found in other species, after taking into account the fact that D. pseudoobscura showed evidence for a recent expansion in population size. We examined correlates of synonymous and nonsynonymous diversity in these species and found no evidence for effects of recurrent selective sweeps on nonsynonymous mutations, which is probably because this set of genes have much higher than average levels of selective constraints. There was evidence for correlated effects of levels of selective constraints on protein sequences and on codon usage, as expected under models of selection for translational accuracy. Our analysis of a published data set on D. melanogaster provided evidence for the effects of selective sweeps of nonsynonymous mutations on linked synonymous diversity, but only in the subset of loci that experienced the highest rates of nonsynonymous substitutions (about one-quarter of the total) and not at more slowly evolving loci. Our correlational analysis of this data set suggested that both selective constraints on protein sequences and recurrent selective sweeps affect the overall level of codon usage.
Introduction
A major issue that has arisen from recent studies of genome-wide data on DNA sequence polymorphism and divergence, especially in Drosophila, is the extent to which selection on amino acid mutations, both positive and purifying, has effects on variability at linked synonymous sites and on the use of alternative synonymous codons, even in regions with normal rates of genetic recombination (Loewe and Charlesworth 2007; McVicker et al. 2009; Sella et al. 2009; Charlesworth B and Charlesworth D 2010, p. 390–416; Jensen and Bachtrog 2010; Stephan 2010). There is now fairly consistent evidence that approximately 50% of the nonsynonymous sequence differences between several pairs of related species of Drosophila have been fixed by positive selection (Fay et al. 2002; Smith and Eyre-Walker 2002; Bachtrog 2008; Eyre-Walker and Keightley 2009; Sella et al. 2009; Haddrill et al. 2010). If the mutations responsible are sufficiently strongly selected, we might expect to see footprints of recurrent selective sweeps at loci where fixations of favorable amino acid variants have been occurring, such as reduced variability, distorted synonymous site frequency spectra, and reduced levels of codon usage bias, in comparison with loci where such events are rare (Braverman et al. 1995; Betancourt and Presgraves 2002; Kim 2004; Sella et al. 2009; Stephan 2010). There are indeed several studies in which one or more of these patterns have been reported (Sella et al. 2009; Jensen and Bachtrog 2010; Stephan 2010).
It has also been proposed that the levels of selective constraints on protein sequences are related to the intensity of selection on codon usage. This is expected, for example, if there is stronger selection for translational accuracy at amino acid sites subject to more intense purifying selection (Akashi 1995; Drummond and Wilke 2008), which should lead to a negative correlation between codon usage and nonsynonymous diversity (Bierne and Eyre-Walker 2006), as well as between codon usage and both synonymous and nonsynonymous divergence (Betancourt and Presgraves 2002; Drummond and Wilke 2008). In the absence of recurrent, strong selective sweeps, nonsynonymous diversity should also be positively related to nonsynonymous divergence according to this hypothesis, and we would expect a zero or weakly positive relation between synonymous diversity and nonsynonymous diversity or divergence (Bierne and Eyre-Walker 2006).
The purpose of this study is to examine patterns of diversity and divergence, and the extent to which they shed light on the various possible causal processes involved, using data on a set of loci for which sequence variability has been estimated in both Drosophila pseudoobscura and its close relative D. miranda (Haddrill et al. 2010). Data on divergence from the more distant relative, D. affinis, are also available for these loci. Our previous study showed that there is pervasive purifying selection acting on nonsynonymous variants in these two species and that a substantial fraction of nonsynonymous substitutions between them and D. affinis have been fixed by positive selection. Our data set thus represents excellent material for testing the possibilities mentioned above.
In addition, we have estimated the strength of selection on codon usage, with particular reference to differences between the X chromosome and autosomes (Singh et al. 2005a, 2008; Vicoso et al. 2008), and the extent of recent population expansion in these species, using an extension of the method recently introduced by Zeng and Charlesworth (2009, 2010a), which is computationally more efficient than its predecessor. Given that the set of genes in the D. pseudoobscura/D. miranda data set have lower than average levels of nonsynonymous divergence (Haddrill et al. 2010), some of the patterns detected in our analyses were also tested against the data of Shapiro et al. (2007), on the Zimbabwe population of D. melanogaster, because this data set may be more representative of genome-wide evolutionary forces. This analysis showed that the negative relation observed between synonymous diversity and nonsynonymous divergence is driven by the fastest evolving set of genes.
Materials and Methods
Polymorphism and Divergence Data
Polymorphism and divergence statistics for D. pseudoobscura and D. miranda were taken from a previous study (Haddrill et al. 2010), which consisted of polymorphism data for both D. pseudoobscura and D. miranda, as well as divergence data from the outgroup species D. affinis. After eliminating loci that showed evidence for departure from neutral expectations, there are 33 X-linked and 34 autosomal loci for use in these analyses (further work has suggested that most of the outliers with low variability are in regions of reduced recombination: Haddrill PR, Verspoor RL, Charlesworth B, unpublished data). For each locus, Haddrill et al. (2010) surveyed coding regions of 400–650 bp in length, from 12 to 16 isofemale lines per species and from a single D. affinis line. To these data, we added an estimate of codon usage bias for each locus, measured as the frequency of optimal codons (Fop), which was calculated using a library of Perl scripts, written by Doris Bachtrog and Peter Andolfatto (Haddrill et al. 2008).
We also used the D. pseudoobscura genome sequence information on FlyBase (http://flybase.org/, Release 2.12) to extract information on the total exon length for each gene. Finally, we added data on expression level for each gene using microarray data from the study of Zhang et al. (2007). Expression data were retrieved from the Gene Expression Omnibus database (Edgar et al. 2002; accession GSE6640); because the original data set consisted of expression levels measured from an unequal number of females (four) and males (five), we calculated a weighted average expression level for each gene, using a Perl script kindly provided by Sophie Marion de Procé (Marion de Procé et al. 2009). Expression data were successfully extracted for all but one gene (GA25303, using the D. pseudoobscura nomenclature).
Polymorphism and divergence statistics for D. melanogaster were calculated using data from the study of Shapiro et al. (2007). To avoid complications caused by cryptic admixture events and population bottlenecks, only the six Zimbabwe lines showing the strongest evidence for reproductive isolation from other lines were used (Wu C-I, personal communication; Zeng and Charlesworth 2009). The sequenced genomic fragments were annotated using version 5.11 of the D. melanogaster genome annotation database (http://flybase.org/). We only retained sequence fragments that overlapped with exactly one annotated coding sequence region for the analysis. The genome sequence of D. yakuba was used as an outgroup; the pairwise alignments between the D. yakuba and D. melanogaster genomes were downloaded from the University of California–Santa Cruz Genome Browser (http://genome.ucsc.edu; version: dm3_vsDroYak2). Divergence and polymorphism statistics were calculated using the method of Nei and Gojobori (1986), similar to what was done for the D. pseudoobscura and D. miranda data, but using the software package KaKs_Calculator (version 1.2; Zhang et al. 2006). We employed the total number of expressed sequence tags for a gene as a proxy of gene expression level; the data were obtained from the UniGene database (http://www.ncbi.nlm.nih.gov/unigene) and were kindly provided by Beatriz Vicoso. Finally, we obtained estimates of local recombination rates using the method of Singh et al. (2005) (http://petrov.stanford.edu/cgi-bin/recombination-rates_updateR5.pl), in order to remove genes in regions of low recombination. All autosomal genes for which the estimate of rate of crossing over was less than two centiMorgans per megabase were removed before analysis, leaving a total of 189 autosomal genes.
Patterns of correlations among the divergence, polymorphism, codon usage, and expression levels were analyzed using partial product moment correlation coefficients, whose significance was assessed by bootstrapping among loci, as described by Haddrill et al. (2005). We also examined the effect of coding sequence length on the pattern of correlations among the other variables, but found little effect on these, despite its well-known negative correlations with Fop (Duret and Mouchiroud 1999) and KA (Drummond and Wilke 2008), which we detected in the D. melanogaster data set.
A Method for Jointly Inferring the Intensity of Selection on Codon Bias, Mutation Parameters, and Recent Changes of Population Size
We have extended the method of Zeng and Charlesworth (2009, 2010a) so that autosomal and X-linked data can be used simultaneously in the analysis; the new method also allows the difference in effective population size between the autosomes and the X chromosomes to be estimated from the data. Consider a diploid population of constant size. Let N be the autosomal effective population size and λN be the effective population size for the X chromosome. Define u as the rate at which the unpreferred synonymous variant at a nucleotide site mutates to the preferred alternative variant, v as the mutation rate in the reverse direction, and κ = v/u as the mutational bias parameter. We assume that the unscaled mutation parameters are the same for the autosomes and for the X chromosome; different mutational bias parameters can be assigned to the X and autosomes, but we found no improvement in likelihood over the simpler model (see supplementary table S1, Supplementary Material online).

In our new implementation of this method, matrices of the same size were used for all the calculations, and the difference in effective population sizes between X and autosome was represented by scaling the mutation and selection parameters by a factor of λ that represents the X chromosome to autosome ratio of population sizes.
The expansion event was represented by rescaling the mutation and selection parameters, but holding the matrix size unchanged from that of equation (1). This rescaling approach greatly speeded up the calculation compared with our previous approach of representing the expansion by two matrices of different sizes (c.f., eq. 13 of Zeng and Charlesworth 2009). Note that, for the first term on the right-hand side in equation (2), each step of the matrix iteration is equal to g generations under the original timescale, whereas for the second term, each step represents gλ generations, assuming that all evolutionary forces are weak, so that the diffusion approximation to the matrix recursion is valid (Ewens 2004, chapter 4). Because the autosomes and the X chromosome are at exactly the same time point after the change of population size under the original timescale, the ratio of the number of matrix iterations for the autosomal data to that for the X-linked data is therefore λ. Comparisons of the two methods showed that they yield the same results.
We used the simplex algorithm of Press et al. (1992) to find maximum likelihood (ML) estimates of the parameters. Multiple random starting points were used in the search to ensure that the global maximum was found. We can test whether L1 (eq. 2) fits the data better than L0 (eq. 1) by using a chi-squared test with two degrees of freedom (Williamson et al. 2005; Zeng and Charlesworth 2009).
Results
Estimates of Population Size Change and Selection on Codon Usage in D. pseudoobscura and D. miranda
We first show that the synonymous polymorphism data described in Haddrill et al. (2010) provide evidence for selection on codon usage in D. pseudoobscura and D. miranda and estimate its intensity using the modification of the method of Zeng and Charlesworth (2009, 2010a) described above, which allows the effects of population expansion and any difference in effective population size between autosomal loci and X chromosomal loci to be taken into account. The results are displayed in table 1.
Estimates of Selection, Mutation, and Demographic Parameters in Drosophila pseudoobscura and D. miranda.
| Model | Parameter Estimates | lnL | ΔAIC | ||||||
| γA | γX | θu | κ | λ | g | τ | |||
| D. pseudoobscura | |||||||||
| L0 (Full) | 2.32 | 3.90 | 0.0067 | 4.36 | 0.70 | — | — | −8838.16 | 66.3 |
| L1 (Full) | 1.78 | 3.38 | 0.0066 | 2.63 | 0.65 | 6.11 | 0.040 | −8803.27 | 0.5 |
| L1 (γA = 0) | — | 0.75 | 0.0155 | 0.50 | 0.67 | 8.28 | 0.043 | −8877.93 | 147.8 |
| L1 (γX = 0) | −0.32 | — | 0.0010 | 0.32 | 0.61 | 84.70 | 0.213 | −8874.89 | 141.8 |
| L1 (γA = γX) | 1.86 | — | 0.0047 | 2.81 | 1.20 | 8.72 | 0.030 | −8817.56 | 27.1 |
| L1 (γA = λγX) | — | 3.62 | 0.0068 | 2.77 | 0.56 | 6.01 | 0.037 | −8845.87 | 83.7 |
| L1 (γA = 0.75γX) | — | 2.68 | 0.0062 | 2.69 | — | 6.74 | 0.033 | −8848.61 | 87.2 |
| L1 (κ = 1) | 0.79 | 1.82 | 0.0114 | — | 0.67 | 7.80 | 0.037 | −8826.08 | 44.1 |
| L1 (λ = 0.75) | 1.77 | 2.92 | 0.0063 | 2.62 | — | 6.94 | 0.033 | −8804.01 | 0.0 |
| D. miranda | |||||||||
| L0 (Full) | 1.56 | 2.49 | 0.0026 | 2.16 | 0.79 | — | — | −7038.58 | 1.9 |
| L0 (γA = 0) | — | 0.52 | 0.0065 | 0.47 | 0.85 | — | — | −7052.23 | 27.2 |
| L0 (γX = 0) | −0.40 | — | 0.0079 | 0.31 | 0.87 | — | — | −7061.18 | 45.1 |
| L0 (γA = γX) | −0.67 | — | 0.0114 | 0.23 | 0.48 | — | — | −7075.76 | 74.3 |
| L0 (γA = λγX) | — | 2.51 | 0.0027 | 2.27 | 0.73 | — | — | −7084.77 | 92.3 |
| L0 (γA = 0.75γX) | — | 2.42 | 0.0026 | 2.26 | — | — | — | −7084.78 | 90.3 |
| L0 (κ = 1) | 0.78 | 1.47 | 0.0043 | — | 0.82 | — | — | −7041.83 | 6.4 |
| L0 (λ = 0.75) | 1.56 | 2.64 | 0.0027 | 2.17 | — | — | — | −7038.63 | 0.0 |
NOTE.—γA = 4NsA under L0 and 4N1sA under L1; γX = 4Nsx under L0 and 4N1sX under L1; θu = 4Nu under L0 and 4N1u under L1; κ = v/u; g = N2/N1; τ = t/(2N2); and ΔAIC: the difference in the value of the Akaike Information Criterion statistic between the best-fitting model (i.e., the model with the smallest AIC) and the model of interest.
For D. pseudoobscura, there is clear evidence of population expansion, with a ML estimate of the ratio of the final to initial population size of g = 6.11 for the full model, where all demographic, mutation, and selection parameters were fitted. The ML estimated time to expansion in units of 2N2 generations, τ, is quite short (around 0.04). The expected equilibrium autosomal diversity prior to expansion is given by the product of θu and 2κ/(1 + κ) (see Charlesworth and Charlesworth 2010, p. 237); using the ML estimates in table 1, this is equal to 0.0096. Using a per-generation mutation rate estimate for Drosophila of 3.5 × 10⁻⁹ (Keightley et al. 2009), we have 0.0096 = 4N1 × 3.5 × 10−9, so that the pre-expansion autosomal effective population size, N1, is estimated as 6.86 × 10⁵, and the post-expansion value (N2) is 4.19 × 10⁶. The time since expansion is thus estimated as approximately 1.64 × 10⁵ generations. With ten generations a year, this would correspond to 1.64 × 10⁴ years. Given the uncertainties in these estimates, this is quite compatible with the postglacial expansion of D. pseudoobscura into its present distribution in North and Central America.
The evidence for D. miranda is more equivocal. With the limited available number of synonymous polymorphisms, the likelihood profiles for the parameters are rather flat (see supplementary table S2, Supplementary Material online), and high values of g and τ are not significantly different from much smaller ones. Thus, although a full version of L1 is formally significantly different from a full version of L0 on a likelihood ratio tests (P < 0.01), we do not attach much weight to this. It is possible that there was a bottleneck followed by an expansion, but the limited data set does not permit any strong inferences to be made by fitting additional parameters. We have therefore used model L0 to assess the significance of the different selection and mutation models for D. miranda. A recent simulation study has suggested that L0 is robust against recent changes of population size with respect to detecting selection and has good power to discriminate between different hypotheses (Zeng and Charlesworth 2010b).
As expected from the results of Haddrill et al. (2010) on X-linked versus autosomal synonymous diversity levels in these species, the ratio of effective sizes for X and autosomes (λ) are close to the value of three-quarters predicted when there is no departure from randomness for the offspring number distributions of both males and females (Wright 1931). For D. pseudoobscura, the estimates of selection intensities on codon usage (with selection coefficients on heterozygotes for preferred vs. non-preferred codons scaled by four times the autosomal effective population size before expansion, i.e., γ = 4N1s) are γ = 1.78 for the autosomal loci (located on chromosome 4) and γ = 3.38 for the X chromosomal loci, with a mutational bias parameter of κ = 2.63 in favor of unpreferred codons. For D. miranda, use of the L0 model gives ML estimates of γ for the autosome and X chromosome of 1.56 and 2.49, respectively, which are somewhat lower than for D. pseudoobscura. The results in table 1 provide statistically highly significant evidence for mutational bias and selection for codon usage as well as a higher intensity of selection for codon usage on the X chromosome.
Determinants of Synonymous Polymorphism Levels in D. pseudoobscura and D. miranda
We first examined whether nearly neutral polymorphism levels are affected by similar evolutionary forces in the two species, by examining the relation between the synonymous diversity (πS) values in D. pseudoobscura and D. miranda for the same gene (fig. 1A). To quantify this relation, we used synonymous site divergence from D. affinis (KS) and Fop (frequency of optimal codons) for each gene as covariates, in order to adjust for possible differences among genes in mutation rates and levels of selective constraint. As described in the Materials and Methods section, statistical significance was assessed by bootstrapping across genes. X-linked and autosomal genes were analyzed jointly, weighting X-linked πS values by 4/3 in view of the lack of evidence for a departure of the ratio of X/autosome values from 3/4 (see above). The overall correlation for πS between the two species is 0.18 (P > 0.05 on a one-tailed bootstrap test), and the partial correlation coefficient is 0.15 (P > 0.05). There is thus no convincing evidence for a correlation between the synonymous diversity of a gene across the two species, especially when the effects of differences in mutation rates or selective constraints are taken into account. This is very similar to the findings of Bierne and Eyre-Walker (2006) for the comparison of D. simulans and D. melanogaster.

Pairwise nucleotide site diversity (π) in Drosophila pseudoobscura versus D. miranda at (A) synonymous sites and (B) nonsynonymous sites. Lines represent a linear model fitted to the data.
This question was further investigated by examining factors affecting synonymous variability in each species separately, using partial correlations between πS and the variables KS, KA and Fop (rows 1–3 and 9–11 in table 2), which are largely nonsignificant. There is a marginally significant partial correlation between πS and KS in D. pseudoobscura (the overall correlation is 0.30, P < 0.05), suggesting that differences in πS among loci are only weakly influenced by differences in mutation rates and selective constraints among loci. In contrast to some previous reports of negative associations in species of Drosophila between πS and the rate of amino acid sequence evolution (Andolfatto 2007; Sella et al. 2009; Jensen and Bachtrog 2010), there is no significant partial correlation between πS and KA; indeed, the correlation in D. miranda is positive (see fig. 2). The question of the relationship between πS and KA will be considered below, in relation to the D. melanogaster data. There is also little evidence for a correlation between KA and KS (partial r = 0.14, P > 0.05; πS values for both species were used as covariates), in contrast to the results from interspecies comparisons of Drosophila and other taxa (Drummond and Wilke 2008).
Correlates of Diversity Levels in Drosophila pseudoobscura and D. miranda.
| Species | Variables | Covariates | Partial Correlation (1st/99th percentiles) |
| D. pseudoobscura | πS, KS | KA, Fop | 0.285* (−0.007/0.506) |
| πS, Fop | KA, KS | −0.038 (−0.370/0.254) | |
| πS, KA | KS, Fop | −0.049 (−0.286/0.200) | |
| πA, KS | KA, Fop | 0.077 (−0.235/0.399) | |
| πA, πS | KA, KS | −0.049 (−0.291/0.190) | |
| πA, Fop | KA, KS | −0.163 (−0.389/0.109) | |
| πA, KA | KS, Fop | 0.416** (0.177/0.608) | |
| πA, KA | Expression, Fop | 0.418** (0.179/0.623) | |
| D. miranda | πS, KS | KA, Fop | 0.166 (−0.204/0.403) |
| πS, Fop | KA, KS | 0.164 (−0.262/0.472) | |
| πS, KA | KS, Fop | 0.226 (−0.106/0.526) | |
| πA, πS | KA, KS | 0.086 (−0.190/0.354) | |
| πA, KS | KA, Fop | −0.033 (−0.246/0.329) | |
| πA, Fop | KA, KS | −0.205 (−0.436/0.026) | |
| πA, KA | KS, Fop | 0.221* (−0.052/0.437) | |
| πA, KA | Expression, Fop | 0.229* (−0.065/0.538) |
*P < 0.05 (one-tailed test) and **P < 0.01 (one-tailed test).

Nonsynonymous site divergence (KA) versus pairwise synonymous site diversity (πS) in (A) Drosophila miranda and (B) D. pseudoobscura. Lines represent a linear model fitted to the data.
Overall, these results suggest that variation in πS across loci is mainly determined by differences in local mutation rates or levels of selective constraints on synonymous sites. Furthermore, the lack of a negative partial correlation between πS and KA in table 2 suggests that recurrent sweeps may not be an important factor in reducing variability at linked sites for the set of genes we have studied here (see the Discussion).
Determinants of Nonsynonymous Polymorphism Levels in D. pseudoobscura and D. miranda
Similar analyses were conducted for nonsynonymous diversity (πA; fig. 1B). No adjustment was made for X-linked versus autosomal genes because there was no evidence for a significant difference between them. The net correlation between πA for the two species is 0.26 (P < 0.01 on a one-tailed test). However, after controlling for the variation in mutation rates and/or selective constraints by use of KS and KA as covariates, the partial correlation is reduced to 0.12 and is nonsignificant. There is no significant overall correlation between πA and πS in D. pseudoobscura (r = 0.009) and a marginally significant positive value of 0.14 (P < 0.05) in D. miranda. The results in table 2 on the partial correlations between πA and other variables show that KA is the main correlate of differences in nonsynonymous diversity among genes (i.e., the correlations are nonsignificant when KA was used as a covariate; see rows 4–8 and 12–16 in table 2), implying that the differences among genes in πA are mainly determined by differences in selective constraints. This means that the correlation between the πA values for the two species must also largely be due to similarities in the levels of selective constraints on protein sequences, in agreement with the results of Bierne and Eyre-Walker (2006) for D. simulans and D. melanogaster. Finally, the strong positive correlation between πA and KA suggests a lack of effect on diversity levels of recurrent selective sweeps at these loci.
Tajima's D and Protein Sequence Divergence in D. pseudoobscura and D. miranda
If there are recurrent selective sweeps operating on nonsynonymous mutations in the Drosophila genome, then we might expect more rapid protein sequence evolution in a gene to be associated with a more highly distorted variant frequency spectrum at synonymous sites in the same gene (Braverman et al. 1995; Andolfatto 2007; Sella et al. 2009; Stephan 2010). We tested this by examining the relation between Tajima's D for synonymous sites and KA, with KS and πS as covariates. The partial correlations are −0.12 and 0.13 for D. pseudoobscura and D. miranda, respectively; both have P > 0.05, so there is no evidence for such an effect of recent positive selection.
Codon Usage Bias and Selective Constraints on Coding Sequences in D. pseudoobscura and D. miranda
We also examined the relationship between Fop and KA because previous studies have often found a negative relation between them (Betancourt and Presgraves 2002; Drummond and Wilke 2008; Marion de Procé et al. 2009). Indeed, the overall correlation between Fop and KA is −0.26 (P < 0.05; fig. 3A), and the results in table 3 (row 1) show that Fop is negatively correlated with KA (P < 0.05) even after adjusting for the effects of level of gene expression and KS. One possible explanation for this pattern is that weaker selective constraints affect both protein sequence and codon usage (Bierne and Eyre-Walker 2006; Drummond and Wilke 2008). In agreement with this interpretation, the partial correlation between Fop and KA with πA and KS as covariates is −0.13 (P > 0.05) and −0.17 (P > 0.05) in D. pseudoobscura and D. miranda, respectively, implying that the correlation between Fop and KA is weakened when πA is controlled for.
Correlates of Codon Usage Bias in Drosophila pseudoobscura and D. miranda.
| Variables | Covariates | Partial Correlation (1st/99th percentiles) |
| Fop, KA | Expression, KS | −0.255* (−0.525/0.076) |
| Fop, expression | KA, KS | 0.216* (−0.055/0.450) |
| Fop, KS | KA, expression | −0.216* (−0.452/0.032) |
| Fop, pse-πA | Expression, KS | −0.252* (−0.485/−0.041) |
| Fop, pse-πA | Expression, KA | −0.178* (−0.404/0.066) |
| Fop, mir-πA | Expression, KS | −0.249** (−0.432/−0.036) |
| Fop, mir-πA | Expression, KA | −0.181* (−0.466/0.053) |
*P < 0.05 (one-tailed test) and **P < 0.01 (one-tailed test).

Fop versus (A) nonsynonymous site divergence (KA) and (B) nonsynonymous site diversity (πA) for Drosophila miranda and D. pseudoobscura. Lines represent a linear model fitted to the data.
As would be expected from much larger published studies in the literature (Drummond and Wilke 2008), the correlation between Fop and gene expression is positive (0.19, P < 0.05); this is true even after adjusting for KS and KA (table 3, row 2) or coding sequence length and KA (results not shown). These results are in qualitative agreement with those of Marion de Procé et al. (2009) for the comparison between D. miranda and D. pseudoobscura, but we also find a negative partial correlation between Fop and KS of −0.22 (P < 0.05; table 3, row 3), in contrast to their findings, perhaps reflecting the greater distance between our species and D. affinis.
Fop and πA are negatively correlated (r = −0.28, P < 0.01, in both D. pseudoobscura and D. miranda; fig. 3B), in agreement with Bierne and Eyre-Walker's findings for D. simulans and D. melanogaster. This remains true after adjusting for expression level and KS or KA (table 3, rows 3–6). The partial correlation between Fop and πA with KA and KS as covariates is also negative in both species (−0.18, P < 0.05). Therefore, the relationship between Fop and πA cannot be entirely explained by variation in selective constraints that affect both codon usage and amino acid sequences in the same way, but is nonetheless the opposite of the positive correlation predicted by the recurrent sweep model.
Patterns of Synonymous and Nonsynonymous Polymorphism and Divergence in D. melanogaster
The results presented above for the relationship between synonymous diversity and nonsynonymous divergence are in contrast to previous reports of a negative association between these measures (Andolfatto 2007; Sella et al. 2009; Jensen and Bachtrog 2010). However, as mentioned previously, the group of genes in our data set are subject to higher than average levels of selective constraints and thus may not be representative of the genome as a whole. In particular, there is a deficit of genes with high levels of nonsynonymous divergence in our data set, which may be the genes driving the relationship observed in previous studies. In order to further investigate this, we repeated these analyses using data from the Shapiro et al. (2007) study of diversity in D. melanogaster, using autosomal genes from regions of relatively high recombination, with divergence measured with respect to D. yakuba, as described in the Materials and Methods. In contrast to the results for the other pair of species, the analysis of partial correlations between πS and KS, KA, and Fop (table 4) shows that, when all 189 autosomal genes are included in the analysis, πS is negatively correlated with KA but is positively correlated with KS (the results for the latter are shown in the supplementary table S3, Supplementary Material online). This suggests that our results are broadly in agreement with previous studies, but our data set does not allow us to detect the relationship between πS and KA, due to a dearth of fast-evolving genes.
Correlates of Diversity Values and Codon Usage in Drosophila melanogaster.
| Genes | Variables | Covariates | Partial Correlation (1st/99th percentiles) |
| All | πS, KA | KS, Fop | −0.222** (−0.373/−0.047) |
| πA, KA | KS, Fop | 0.251** (0.063/0.466) | |
| πA, Fop | Expression, KS | −0.281** (−0.476/−0.116) | |
| Low KA | πS, KA | KS, Fop | 0.144 (−0.184/0.236) |
| πA, KA | KS, Fop | 0.416** (0.253/0.571) | |
| πA, Fop | Expression, KS | −0.269** (−0.439/−0.080) | |
| High KA | πS, KA | KS, Fop | −0.262* (−0.512/0.114) |
| πA, KA | KS, Fop | −0.059 (−0.462/0.307) | |
| πA, Fop | Expression, KS | −0.139 (−0.524/0.168) |
*P < 0.05 (one-tailed test) and **P < 0.01 (one-tailed test).
Further analysis shows that the relationship between these two measures may be more complicated than has previously been suggested. Figure 4 shows πS and KA for the D. melanogaster data set, with a local polynomial regression (Lowess) line fitted to the data. For genes with high KA values, the relationship between πS and KA is indeed negative, as has been previously reported, but the relationship is actually slightly positive for genes with low KA values (approximately corresponding to the range for our D. pseudoobscura/D. miranda data set, after adjusting for the greater divergence of this from the outgroup species). Thus, the relationship between πS and KA appears not to be linear. Indeed, a quadratic regression fits the data significantly better than a linear relationship, both using the raw data (P = 0.027) and log-transformed data (P = 0.003). In agreement with this, if we partition the genes into those with KA < 0.05 (giving 143 “low KA” genes) and those with KA > 0.05 (giving 46 “high KA” genes), there is no significant negative partial correlation between πS and KA in the low KA set, whereas for the high KA set, the partial correlation is −0.26 (P < 0.05 on a one-tailed test).
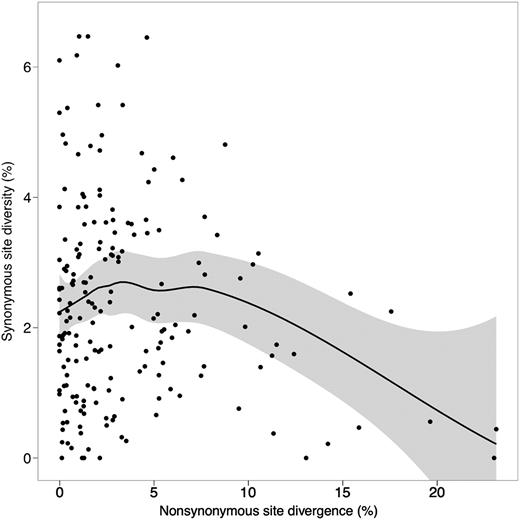
Nonsynonymous site divergence (KA) versus pairwise synonymous site diversity (πS) in Drosophila melanogaster. The line represents a local polynomial regression (Lowess) fitted to the data, the shaded area represents the standard error of the line.
This suggests that the negative correlation is largely driven by the difference between low KA and high KA genes, with no effect within the low KA category, and that the lack of signal in the D. pseudoobscura and D. miranda data is unlikely to be caused simply by a lack of power. Consistent with this, the mean πS values are 0.021 ± 0.002 and 0.025 ± 0.001 for the high and low KA genes, despite the fact that the mean KS values for these categories are 0.41 ± 0.02 and 0.31 ± 0.08, respectively. In agreement with the results for D. pseudoobscura/D. miranda described above, no significant relation between Tajima's D for synonymous sites and KA was detected (for all genes, their partial correlation is −0.032, P > 0.05). However, the mean D values for low and high genes are −0.085 ± 0.068 and −0.181 ± 0.106, which, although not significantly different, also point toward different selective forces operating in the low and high KA groups.
As before, πA and KA are significantly positively partially correlated, and this is true both for all genes as well as low KA genes (table 4). πA and Fop are significantly negatively partially correlated, even when expression level is a covariate, both for all genes and for low KA genes (table 4). The lack of significance for high KA genes may simply reflect their relatively small number, as the correlations are negative in all cases. There is a significantly positive partial correlation between πA and πS (with KA and KS as covariates), for both the overall data set and for the low KA genes (supplementary table S3, Supplementary Material online), and a significant overall correlation of 0.29 (P < 0.01) for the low KA genes. This differs from the results for the other two species, and those of Bierne and Eyre-Walker (2006), probably reflecting the greater power to detect correlations in this data set.
Putting all these results together, the patterns observed for the low KA genes can be readily explained by variation in selective constraints among genes, whereas different forces may have influenced the high KA genes (see the Discussion).
We also explored the relationship between Fop and divergence and expression variables in this data set, to test whether we have power to detect the relationships previously detected in genome-wide analyses (Drummond and Wilke 2008; Larracuente et al. 2008). As expected, in the whole data set, Fop and expression level are significantly positively partially correlated, using KS and KA as covariates (supplementary table S3, Supplementary Material online). Similarly, Fop and KS and Fop and KA are significantly negatively partially correlated. These patterns are also seen within the low and high KA sets of genes, although significance is lacking in the high set, again presumably because of the relatively small number of genes. In contrast to what was found with D. pseudoobscura and D. miranda, there is a significantly negative partial correlation in the whole data set between Fop and KA, with πA and KS as covariates (−0.35, P < 0.01). However, this drops to −0.16 (P < 0.05) for the low KA genes, suggesting that this may mainly reflect the properties of the faster evolving genes and is thus consistent with the results for D. pseudoobscura and D. miranda, as was the case for the relation between πS and KA. KA and expression level are significantly negatively correlated in both the whole data set and low KA data (r = −0.16 and −0.22, P < 0.01) but not in the high KA data (r = −0.14). The partial correlation between KA and expression level, with Fop and KS as covariates, is small and nonsignificant for the whole data set and for the high KA data (−0.004 and 0.02, respectively) but is −0.12 (P < 0.05) for the low KA data. This result is unchanged when coding sequence length is used as a covariate (results not shown). This suggests that the correlation between KA and expression level is a function of constraints that act on both protein sequence and codon usage (see below).
Discussion
Selection on Codon Usage
As we have previously shown for the Zimbabwe population of D. melanogaster (Zeng and Charlesworth 2009, 2010a), selection on synonymous sites can lead to false inferences of population expansion, and population expansion can bias estimates of the strength of selection, so that it is important to apply a joint estimation procedure, as was done here. Our method also allows, for the first time, joint estimation of the relative effective population sizes of the autosomes and X chromosome and the relative strengths of selection on preferred versus unpreferred synonymous variants at autosomal and X-linked loci.
Our joint analysis of synonymous diversity and demography in D. pseudoobscura and D. miranda (see table 1) gives evidence for significant selection on codon usage in both species, in agreement with previous studies that assumed constant population size (Akashi and Schaeffer 1997; Bartolomé et al. 2005; Bartolomé and Charlesworth 2006). For D. pseudoobscura, there is also apparent evidence for a large and recent increase in population size, as proposed previously on the basis of consistent negative Tajima's D statistics (Machado et al. 2002), but the evidence for change in population size in D. miranda is equivocal, with no indication of a recent change (see Results section and supplementary table S2, Supplementary Material online).
It is also possible that the effects of widespread recurrent positive selection on the genes in our study may have contributed to the inference of a population size expansion in D. pseudoobscura because these two processes have similar effects on the site frequency spectrum (Sella et al. 2009; Stephan 2010). Although we cannot rule this possibility out, it seems rather unlikely for the following reasons. Sixty one of 67 loci in our sample have negative Tajima's D values at synonymous sites, in agreement with previous studies of D. pseudoobscura (Machado et al. 2002), and the mean synonymous site D value is approximately −0.80, in contrast to the values of −0.35 and −0.15 observed by Andolfatto (2007) in D. melanogaster for his fastest and slowest evolving set of genes, respectively. If recurrent selective sweeps affecting the majority of loci in our study are responsible for the skewed site frequency spectrum in D. pseudoobscura, much stronger effects on the site frequency spectrum at linked nearly neutral sites than those found even for fast-evolving genes in D. melanogaster would have to be postulated. There is little obvious difference between the two species in the proportion of fixed amino acid differences attributable to positive selection (Haddrill et al. 2010), and estimates of KA/KS for the same set of genes for species in the D. melanogaster subgroup suggest a similar overall mean value to the value we find for D. pseudoobscura (Betancourt A, personal communication), so that the overall rate of adaptive amino acid substitutions must also be similar. It follows that, to account for the above results, positively selected amino acid mutations in D. pseudoobscura would have to be subject to much stronger selection than in D. melanogaster. This cannot be ruled out but seems very unlikely when contrasted with the alternative hypothesis of a recent population expansion associated with postglacial colonization of the current habitat of D. pseudoobscura.
In addition, our conclusions regarding the strength of selection on codon usage bias, the main focus of this part of our analysis, are unlikely to be changed, even if we have failed to include the effects of selective sweeps. Nevertheless, to strengthen our inference of selection on codon usage bias, we conducted likelihood ratio tests using the equilibrium model of Zeng and Charlesworth (2009), with the additional assumption that the test statistics follow a chi-squared distribution with two degrees of freedom, because this procedure has been shown to be robust to the confounding influences of demographic changes or selection at linked sites (Zeng and Charlesworth 2010b). These results are in agreement with those presented in table 1 (see supplementary tables S4, and Supplementary Data, Supplementary Material online), and thus our conclusions regarding the strength of selection on codon usage bias remain unchanged.
Contrary to what has been found in African populations of D. melanogaster, where silent site diversity on the X chromosome is similar to or slightly higher than that for the autosomes (Andolfatto 2001; Hutter et al. 2007; Singh et al. 2007), our estimates of synonymous diversity for the X chromosome in the two species and those of Bachtrog and Andolfatto (2006) for D. miranda do not differ significantly from the value of three-quarters of those for the autosomes, as expected when there is purely random variation in reproductive success in both sexes (Wright 1931); this is consistent with the ML estimates of λ, the ratio of effective sizes for X and autosomes, in table 1.
For D. pseudoobscura and D. miranda, the results in table 1 show that, setting λ = 3/4, the ML estimates of 4N1sX are 2.92 and 2.64, respectively, whereas those for 4N1sA are 1.77 and 1.56 (N1 is the autosomal effective population size, measured prior to expansion in the case of D. pseudoobscura), where sX and sA are the selection coefficients for X-linked and autosomal loci, respectively. These results are qualitatively consistent with the higher levels of codon usage bias on the X versus the autosomes that is found in Drosophila species (Singh et al. 2005a, 2007; Vicoso et al. 2008) because the equilibrium level of codon usage bias is determined jointly by the mutational bias parameter κ and Nes, where Ne is the effective population size (Charlesworth and Charlesworth 2010, p. 536). The results agree quite well with results on D. melanogaster, obtained by a somewhat different approach (Zeng and Charlesworth 2010a). They also suggest that the ancestral population size for D. miranda was smaller than that for D. pseudoobscura, despite the estimated 7-fold expansion in the latter. Accordingly, the estimates of θ and γ for D. pseudoobscura are substantially higher than for D. miranda, and even for African D. melanogaster.
The present estimates of γ for D. miranda are somewhat lower than those obtained by Bartolomé et al. (2005) and Bartolomé and Charlesworth (2006) on smaller data sets, using the method of Maside et al. (2004); these were greater than two. This may be due to a recent shrinkage in population size, undetected by our method, which is indicated by patterns of substitution in the D. miranda lineage (Bartolomé and Charlesworth 2006; Bachtrog 2007). Shrinkage is known to cause an upwards bias in the Maside et al. (2004) estimator (Zeng and Charlesworth 2009).
Our analysis also sheds light on the question of the relationship between the selection coefficient, sX, on X-linked mutations that change codon usage, defined by the allele frequency equation ΔqX = sXq(1 − q), and the corresponding selection coefficient sA for autosomal mutations, defined by ΔqA = sAq(1 − q). With semidominance and equal selection in males and females, we expect sX/sA to be equal to 4/3 (1.33) (Vicoso and Charlesworth 2009b). The estimates of 4N1sX and 4N1sA quoted above share a factor of 4N1, so that their ratios yield the corresponding values of sX/sA, which are 1.65 and 1.69 for D. pseudoobscura and D. miranda, respectively, slightly larger than the expected values. The log-likelihood tests for each species for the differences between the full model and the model with 4N1sX = 4N1sA (compare row 2 with 5 of table 1 and 10 with 13) indicate that sX/sA is highly significantly different from one; the tests for the differences between the full model and the model with 0.75N1sX = N1sA (compare row 2 with 7 and 10 with 15) show that sX/sA is greater than the expected value of 4/3, implying that the selection coefficients for X-linked mutations are greater than those for the autosomes. Although a possible difference in mutational bias between X and autosome cannot be rejected by our data, there is no statistical support for this (supplementary table S1, Supplementary Material online), so that it seems unlikely that this could explain the results by biasing the estimates of selection coefficients when such a difference is assumed to be absent, as in table 1.
It is currently unclear why such a difference in selection pressure between the X and autosome should exist. Our model assumes semidominance, which theory suggests is reasonable for very small fitness effects, such as those involved in codon usage (Kacser and Burns 1981; Crow 1993). In addition, models that include recessivity or partial recessivity of deleterious fitness effects do not seem to be able to account for the observed levels of differences in codon usage between X and autosomes in Drosophila species of around 3–4% (Singh et al. 2008; see fig. 4 of McVean and Charlesworth 1999), when λ = 0.75. Our results on the relative effective sizes of the X and autosomes also seem to rule out the possibility that intense sexual selection causes a high λ in D. pseudoobscura and D. miranda, and it is in any case doubtful that this is the cause of the high ratio of X to autosomal diversity in D. melanogaster (Vicoso and Charlesworth 2009a).
Singh et al. (2005a) proposed that increased codon usage on the X chromosome might be favored because it helps overcome incomplete dosage compensation of X-linked genes in males. Given that somatically expressed genes on the Drosophila X appear to be very effectively dosage compensated at the mRNA level (Gupta et al. 2006), this seems unlikely but cannot be ruled out. Another possible cause is the somewhat higher overall level of gene expression in females on the X than on the autosomes, probably due to incomplete sex limitation of the increased expression of X chromosome genes associated with dosage compensation in males (Zhang and Oliver 2010). In view of the widespread evidence for an association between level of gene expression and the intensity of selection on codon usage, especially if misfolding of incorrectly translated proteins causes toxic effects that are proportional to their abundance (Drummond and Wilke 2008), it is possible that this may be the cause of the stronger selection on codon usage on the X chromosome.
Another possibility is that there are weaker Hill–Robertson effects on the X chromosome than the autosomes, due to the higher effective rate of recombination for X-linked genes caused by the lack of crossing over in males (Vicoso and Charlesworth 2009a) or due to higher crossover rates on the X chromosome, for which there is some evidence in D. miranda (Bachtrog and Andolfatto 2006). However, this would lead to higher than expected levels of diversity on the X than the autosomes, for which there is no evidence in these species. Finally, the higher evolutionary effective recombination rate on the X may cause higher effective rates of biased gene conversion in favor of GC base pairs (Marais 2003); because preferred codons are nearly all GC ending in these species, this could also cause more intense apparent selection for preferred codons on the X. The negative correlation between GC content on the X and crossover rate in D. melanogaster (Singh et al. 2005b) is, however, hard to reconcile with this hypothesis. We have also found that the mean codon usage of X-linked genes in D. melanogaster is higher than that of autosomal genes in regions with comparable effective recombination rates (Parker DJ, Zeng K, Charlesworth B, unpublished data).
The Relationship Between Protein Sequence Evolution and Synonymous Diversity
As noted in the Introduction, some previous studies of Drosophila species have reported a negative correlation between the level of synonymous diversity, πS, of a gene and its protein sequence divergence from a closely related species, as estimated by KA or similar measures (Andolfatto 2007; Sella et al. 2009; Jensen and Bachtrog 2010). Such a correlation is expected if there are recurrent selective sweeps caused by positively selected, nonsynonymous mutations. Our data on D. pseudoobscura and D. miranda fail to show any evidence for such an effect, either for the raw correlations or partial correlations between πS and KA; indeed, the correlations for D. miranda were nonsignificantly positive (see fig. 2 and table 2).
In addition, there was no evidence for a positive correlation between the πS values for the same gene across the two species, after adjusting for effects of mutation rates and selective constraints on synonymous sites by using KS and Fop as covariates. Such a correlation would be expected with recurrent selective sweeps, given the close relationship between the two species, and the large fraction of amino acid substitutions that appear to be driven by positive selection (Sella et al. 2009). A similar finding was obtained by Bierne and Eyre-Walker (2006) in a comparison of D. simulans and D. melanogaster. We also find a strong positive correlation between πA and KA in both species, contrary to the predictions of a selective sweep model. In addition, we found no evidence for a negative relation between Tajima's D for synonymous sites and KA (see Results), as might also be expected if recurrent selective sweeps are both frequent enough and sufficiently powerful to affect gene genealogies at linked sites (Andolfatto 2007; Sella et al. 2009; Jensen and Bachtrog 2010).
A probable explanation for this failure to detect the signature of selective sweeps is that the loci used in this study were biased toward lower than average KA values and higher than average Fop values (Haddrill et al. 2010). Thus, the mean rate of nonsynonymous substitution per gene may be sufficiently small that any effect on πS is undetectable, perhaps because the selection coefficients for the positively selected mutations are too small to drive down diversity except at very closely linked sites (Braverman et al. 1995; Stephan 1995).
We investigated this possibility further by examining data on the relation between πS for 189 autosomal genes sampled from the Zimbabwe population of D. melanogaster and the corresponding KA values for the comparison between D. melanogaster and D. yakuba, using the data set of Shapiro et al. (2007) (fig. 4 and table 4). In the overall data set, there was evidence for a highly significant negative partial correlation between πS and KA, using KS and Fop as covariates to adjust for possible confounding effective of selective constraints, but this was absent from the set of 143 genes with KA less than 0.05 (this cutoff was chosen arbitrarily and blindly with respect to the πS values); the mean KA for this set was 0.015 ± 0.001. The 46 high KA genes (mean KA = 0.093 ± 0.007) showed a marginally significant negative correlation between πS and KA. This is entirely consistent with the interpretation proposed above and with the fact that figure 1 of Andolfatto (2007) seems to show that his lowest πS values for D. melanogaster are associated with a group of loci with unusually high KA values. Similarly, Jensen and Bachtrog (2010) found a difference between the genome-wide mean πS and the mean πS for genes with unusually high KA values in D. pseudoobscura. Our interpretation is further supported by the fact that the relationship between πS and KA is better explained by a quadratic regression than a linear model (see Results). It seems likely, therefore, that the D. pseudoobscura/D. miranda data set behaves like the low KA genes of D. melanogaster.
Our results are thus consistent with previous studies but indicate that the relationship between πS and KA may be more complex than has previously been assumed. This raises some questions about estimates of the parameters of selective sweeps that are based on models that predict an approximately linear relationship between πS and KA (e.g., Andolfatto 2007).
The Relationship Between Protein Sequence Evolution and Synonymous Diversity and Codon Usage
Negative correlations between the frequency of optimal codons in a gene, Fop, and KA have been observed in several species (Betancourt and Presgraves 2002; Drummond and Wilke 2008; Larracuente et al. 2008; Marion de Procé et al. 2009), but it remains controversial as to whether these reflect the effects of selective sweeps in reducing the efficacy of selection on weakly selected linked sites, as opposed to a correlation between the strength of selection on codon usage and the strength of purifying selection, as predicted by the hypothesis that selection on codon usage is driven by selection on translational accuracy (Bierne and Eyre-Walker 2006; Drummond and Wilke 2008).
We found weak evidence for this correlation in our data on D. pseudoobscura and D. miranda (table 3) and strong evidence for it in the D. melanogaster data (supplementary table S3, Supplementary Material online), even after adjusting for the effects of expression level and KS; this was true for the low KA genes as well as the overall data set. Again, this difference between species is likely to be due to the bias in the D. pseudoobscura/D. miranda data set toward lower than average KA values and higher than average Fop values. Given the strong negative partial correlation between Fop and KS in these data, the partial correlation between KA and Fop may be indicative of an effect distinct from those simply imposed by selection on translational accuracy; this effect was also found by Marion de Procé et al. (2009) for the D. pseudoobscura and D. miranda comparison. Similarly, the significantly positive partial correlation between πA and πS (after adjusting for KS) in D. melanogaster (supplementary table S3, Supplementary Material online) is not expected if selective constraints on translational accuracy are the only factor involved. This relationship is consistent with effects of hitchhiking events on diversity (i.e., variation in local Ne), caused either by background selection or selective sweeps.
However, a footprint of selection on translational accuracy is suggested by the observation of negative partial correlations in all three species between Fop and πA, even when KA and KS are used as covariates, although the significance levels are only 5%. Similarly, the fact that the negative correlation between Fop and KA is weakened when πA is used as a covariate in D. pseudoobscura and D. miranda and in low KA genes in D. melanogaster (see Results), suggests that correlated selective constraints on protein sequences and codon usage play a significant role in modulating Fop. Overall, therefore, both local hitchhiking effects and selective constraints seem likely to be playing a role in determining the level of codon usage of Drosophila genes, even in regions of normal recombination. Genome-wide surveys of diversity and divergence should greatly enhance the power of tests such as these.
We thank Daniel Halligan for assistance with statistical analyses and an anonymous reviewer for useful comments on the manuscript. This study was funded in part by the Natural Environment Research Council of the United Kingdom. It also made use of the resources provided by the Edinburgh Compute and Data Facility (ECDF; http://www.ecdf.ed.ac.uk/). The ECDF is partially supported by the e-Science Data, Information and Knowledge Transformation (eDIKT) initiative (http://www.edikt.org.uk). K.Z. acknowledges support from a Biomedical Personal Research Fellowship awarded by the Royal Society of Edinburgh and the Caledonian Research Foundation. P.H. is supported by a fellowship from the Natural Environment Research Council of the United Kingdom.
References
Author notes
Associate editor: John H McDonald
