


Abstract
Toll-like receptors (TLR) are membrane-bound sensors of the innate immune system that recognize invariant and distinctive molecular features of invading microbes and are also essential for initiating adaptive immunity in vertebrates. The genetic variation at TLR genes has been directly related to differential pathogen outcomes in humans and livestock. Nonetheless, new insights about the impact of TLRs polymorphism on the evolutionary ecology of infectious diseases can be gained through the investigation of additional vertebrate groups not yet investigated in detail. In this study, we have conducted the first characterization of the entire TLR multigene family (N = 10 genes) in non-model avian species. Using primers targeting conserved coding regions, we aimed at amplifying large segments of the extracellular domains (275–435 aa) involved in pathogen recognition across seven phylogenetically diverse bird species. Our analyses suggest avian TLRs are dominated by stabilizing selection, suggesting that slow rates of nonsynonymous substitution help preserve biological function. Overall, mean values of ω (= dn/ds) at each TLR locus ranged from 0.196 to 0.517. However, we also found patterns of positive selection acting on specific amino acid sites that could be linked to species-specific differences in pathogen-associated molecular pattern recognition. Only 39 of 2,875 (∼1.35%) of the codons analyzed exhibited significant patterns of positive selection. At least one half of these positively selected codons can be mapped to putative ligand-binding regions, as suggested by crystallographic structures of TLRs and their ligands and mutagenic analyses. We also surveyed TLR polymorphism in wild populations of two bird species, the Lesser Kestrel Falco naumanni and the House Finch Carpodacus mexicanus. In general, avian TLRs displayed low to moderate single nucleotide polymorphism levels and an excess of silent nucleotide substitutions, but also conspicuous instances of positive directional selection. In particular, TLR5 and TLR15 exhibited the highest degree of genetic polymorphism and the highest occurrence of nonconservative amino acid substitutions. This study provides critical primers and a first look at the evolutionary patterns and implications of TLR polymorphism in non-model avian species and extends the list of candidate loci for avian eco-immunogenetics beyond the widely employed genes of the Major Histocompatibility Complex (MHC).
Introduction
Patterns of genetic variation at functionally important genes involved in the development of immune responses are of great interest for evolutionary biologists. These genes are expected to evolve faster than other loci in the genome (Khakoo et al. 2000; Zelus et al. 2000; Sachidanandam et al. 2001; Downing et al. 2009) due to selective pressures associated with continuously evolving pathogens and parasites (Lively and Dybdahl 2000; Kuijl and Neefjes 2009). In particular, toll-like receptors (TLRs) have steadily attracted the attention of immunologists and evolutionary biologists during the last few years because the association of many TLR polymorphisms in humans with resistance or susceptibility to infectious diseases (Schröder and Schumann 2005; Barreiro et al. 2009; Werling et al. 2009). TLRs are type I transmembrane glycoproteins that act as sentinels of the innate immune system and whose participation is essential for initiating adaptive immunity in vertebrates (Iwasaki and Medzhitov 2010). They are encoded by a multigene family that is preferentially expressed in the cell surface or membrane compartments of specialized immune cells, such as dendritic cells, macrophages, and neutrophils. The biological function of TLRs is to detect invariant and distinctive features of invading microbes so called “pathogen-associated molecular patterns” (PAMPs; Janeway 1989; Medzhitov 2001) and to orchestrate the first volley of immune mechanisms to control and eradicate pathogen and parasite challenges.
TLR molecules are typically composed of a pathogen-recognition extracellular domain, a short transmembrane segment and an intracellular toll/interleukin-1 receptor (TIR) signaling domain (Gay and Gangloff 2007). Crystallographic studies of the extracellular domains have revealed a common 3D horseshoe-like structure constituted by a high but variable number of leucine-rich repeats (LRRs). In general, TLR extracellular domains can be divided into N-terminal, central, and C-terminal subdomains (Jin et al. 2007; Kim et al. 2007). As a common feature, ligand-induced homo- or heterodimerization generates an m-shaped complex where the two C-terminal domains converge in the middle. This conformation initiates a signaling cascade through the recruitment of adapter proteins (MyD88, Tirap, Trif, and Tram) around the TIR domains (O'Neill and Bowie 2007; Jin and Lee 2008). As a result of pathogen recognition, the signaling cascade activates transcription factors (e.g., nuclear factor kappa-light-chain-enhancer of activated B cells and Interferon regulatory factor 3) that induce the expression of cytokines related to inflammation and interferons with antiviral properties (Kumar et al. 2009). TLR-mediated recognition of microorganisms also stimulates phagocytosis and the subsequent processing and presentation of foreign antigens to T lymphocytes via Major Histocompatibility Complex (MHC) molecules (Iwasaki and Medzhitov 2010). High levels of genetic divergence in the extracellular domains have been suggested to reflect differential specificity of each TLR against PAMPs from diverse microbial sources. In fact, the extracellular domain of TLRs can be classified into different clades and families according to ligand specificity (Roach et al. 2005; Werling et al. 2009).
The TLR multigene family is comprised of a large and variable number of genes (10–15 genes) with substantial differences within and between vertebrate groups (Roach et al. 2005; Werling et al. 2009). Comparative studies have nonetheless documented that TIR domains are highly conserved among species and among different TLRs because of their crucial participation in signaling transduction (see also Barreiro et al. 2009). The sequencing of the chicken genome has assisted the first detailed characterization of the TLR receptor repertoire in birds (Temperley et al. 2008). Ten different genes have been described. Four genes have orthologs in other vertebrate groups (TLR3, TLR4, TLR5, and TLR7). Avian TLR2A and TLR2B seem to have arisen from a duplication of TLR2 found in other vertebrates. TLR1LA and TLR1LB are two gene duplicates belonging to the TLR1/6/10 superfamily (Werling et al. 2009) and seem to have originated independently in the avian lineage. Avian TLR21 is only shared with bony fish, and TLR15 seems to be unique to birds. Nonetheless, many of the TLRs described in other vertebrate groups are lacking in chickens, and this has been interpreted as substantial gene loss during the evolutionary history of this multigene family in birds (Temperley et al. 2008). Ligand specificity of TLR2, TLR3, TLR4, TLR5, and TLR7 has been well studied in humans and mice but some overlapping specificity between different TLRs is also assumed (Uematsu and Akira 2008). TLR2 and members of the TLR1/6/10 family are known to bind di- and triacylated lipoproteins anchored in the cell wall of bacteria, fungi, and parasites. Lipopolisaccharides (LPS) embedded in the cell wall of gram-negative bacteria are the target of TLR4. Flagellated bacteria are detected through the recognition of flagellins by TLR5. Endosomal expressed TLR3 and TLR7 sense double-stranded (ds) and single-stranded viral RNA, respectively. Recent investigations hint at an association between chicken TLR21 and the detection of microbial DNA (Brownlie et al. 2009) and TLR15 and some component of both gram-positive and gram-negative bacteria (Nerren et al. 2009).
In this study, we used the chicken and zebra finch genomes (Hillier et al. 2004; Warren et al. 2010) as a base to gain deeper insight into the evolutionary history of the TLR family in birds on both short and long evolutionary scales. We designed primers targeted to conserved regions to amplify orthologous sequences encoding the extracellular subdomains involved in recognition of PAMPs. The primers were first tested in seven phylogenetically diverse bird species, each belonging to a different family. Secondly, we analyzed intraspecific TLR polymorphism across natural populations of two bird species. Our hope was to provide a foothold into TLR evolution in a phylogenetically wide diversity of birds, and thereby facilitate the use of these genes in molecular ecology.
Materials and Methods
Study Species
We assembled tissues or blood of seven distantly bird species as follows: the Lesser Kestrel Falco naumanni (Falconidae), House Finch Carpodacus mexicanus (Fringillidae), Leach's Storm Petrel Oceanodroma leucorhoa (Hydrobatidae), Cooper's Hawk Accipiter cooperii (Accipitridae), White-fronted Amazon Amazona albifrons (Psittacidae), Downy Woodpecker Picoides pubescens (Picidae), and Emu Dromaius novaehollandiae (Casuariidae). We chose these distantly related species as a means to preliminarily test the utility of our molecular approach on a diverse representation of the avian clade. We used the QIAGEN—DNeasy Blood & Tissue Kit (Quiagen, Hilden, Germany) to isolate genomic DNA from blood or tissue samples. We also took advantage of DNA extracts obtained from eight unrelated lesser Kestrels sampled in southwestern Spain (N = 2), northeastern Spain (N = 2), Greece (N = 2), and Kazakhstan (N = 2). These DNA extracts were previously used in a large-scale population genetic study of the Lesser Kestrel (Alcaide et al. 2008). In addition, house finches were randomly sampled from two geographically distant populations in the United States, Arizona and Alabama. We expected that sampling individuals from distantly located populations might increase our chances to detect nucleotide polymorphisms at the species level. Eight unrelated individuals were analyzed for the vast majority of TLRs except for TLR21 (N = 4 individuals per species). We increased the number of individuals at the TLR1LA (N = 51) and TLR1LB loci (N = 13) of house finches as a means to explore in more detail polymorphism patterns at single TLR genes.
Primer Design
We downloaded complete mRNA sequences from each of the 10 TLRs described in chickens (TLR1LA: NM_001007488.3, TLR1LB: NM_001081709.2, TLR2A: NM_204278.1, TLR2B: NM_001161650.1, TLR3: NM_001011691.2, TLR4: NM_001030693.1, TLR5: NM_001024586.1, TLR7: NM_001011688.1, TLR15: NM_001037835.1, and TRL21: NM_001030558.1). We searched for orthologous sequences in the zebra finch genome using BlastN. When a hit was obtained, each pair of sequences was individually aligned using the ClustalW application implemented in BioEdit (Hall 1999). Zebra finch sequences producing significant alignments were NW_002198637.1 (TLR1LA: 1935740–1938669; TLR1LB: 1925319–1926697. Chromosome 4), NW_002198634.1 (TLR2A: 13604640–13606978; TLR2B: 13607128–13614664. Chromosome 4), NW_002198636.1 (TLR3: 2625536–2631659. Chromosome 4), NW_002197453.1 (TLR4: 1335343–1337871. Chromosome 17), NW_002198506.1 (TLR5: 243510–246064; TLR15: 20536896–20539486. Chromosome 3), NW_002197669.1 (TLR7: 14707528–14718808. Chromosome 1), and NW_002218839.1 (TLR21: 38419–35719. Unidentified chromosomal location). We then searched for conserved regions in each TLR across the long exons encoding the entire or a large part of the extracellular domains. We tried to design primers as close as possible to the LRR-N-terminal domain and then extend from this point about 1 kb (see fig. 1). In accordance with crystallographic structures of TLR-ligand complexes and mutagenic analyses (e.g., Hajjar et al. 2002; Andersen-Nissen et al. 2007; Jin et al. 2007; Kim et al. 2007; Liu et al. 2008), this strategy should allow us to investigate patterns of nucleotide substitution at the vast majority of functionally important amino acid residues directly interacting with PAMPs. Primers properties (i.e., Tm, GC content, or putative secondary structures) were investigated with both the oligonucleotide properties calculator online platform (http://www.basic.northwestern.edu/biotools/oligocalc.html) and the software Oligo 6.0 (Molecular Biology Insights, Inc., Cascade, CO). The list of primers used in this study is detailed in supplementary table S1, Supplementary Material online (see also fig. 1).
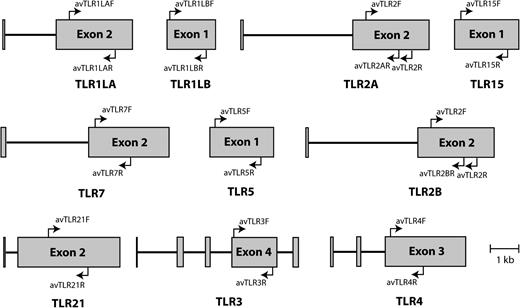
Schematic representation of ten TLR genes in birds. Exons are represented by gray boxes. The locations of the primers used in this study are indicated by arrows. Gene structure was modeled according to the TLR repertoire of the chicken Gallus gallus.
PCR and Sequencing of TLRs Extracellular Domains
Polymerase chain reaction (PCR) experiments were performed in eppendorf Mastercycler gradient thermocyclers (eppendorf AG, Hamburg, Germany) through a first denaturing step of 3 min at 94 °C followed by 35 cycles of 94 °C steps for 40 s, optimized annealing temperatures for each primer pair for 40 s (see supplementary table S1, Supplementary Material online) and extension steps of 72 °C during 80 s. Each PCR reaction was carried out in a final volume of 30 μl containing 1 unit of EconoTaq DNA polymerase (Lucigen Corporation, Middleton, WI), 1X PCR Buffer (Lucigen), 0.2 mM of each deoxynucleotides triphoshate, 10 μg of Bovine Serum Albumin, 5% Dimethyl sulfoxide , 10 pmoles of each primer, and approximately 10–30 ng of DNA. PCR products were visualized in 1.5% agarose gels stained with SYBR safe (Invitrogen, Carlsbad, CA) and cleaned up using multiscreen 96-well filtration plates (Millipore, Billerica, MA) and a vacuum manifold. Sequencing reactions were performed using the BigDye 3.1 technology (Applied Biosystems, Foster City, CA) supplemented with BDX64 buffer (MCLAB, South San Francisco, CA). Forward and reverse sequences were resolved on ABI3130xl and ABI3730xl automated sequencers (Applied Biosystems).
Statistical Analyses
DNA Sequences were edited and aligned using BioEdit (Hall 1999) and Sequencher (Gene Codes Corp., Ann Arbor, MI). We introduced International Union of Pure and Applied Chemistry (IUPAC) degenerate nucleotides for those nucleotide positions found to be heterozygous in chromatograms. For intraspecific polymorphism surveys, diploid genotypes were resolved into individual haplotypes using the Bayesian PHASE platform (Stephens and Donnelly 2003) implemented in DNAsp ver. 5.0 (Librado and Rozas 2009). Calculations were carried out over 1,000 iterations, 10 thinning intervals, and 1,000 burn-in iterations. The software DNAsp was also used to calculate basic polymorphism statistics at each TLR locus, including the overall number of haplotypes (h), nucleotide diversity (π), Watterson's estimator of the population mutation rate (θW), and the average number of nucleotide differences between alleles (k). The phylogenetic relationships among TLRs were visualized through a neighbor joining tree built in the software SplitsTree 4.0 (Huson and Bryant 2006). Bayesian inference of the phylogenetic relationships within TLR1L and TLR2 gene duplicates was performed using the program MrBayes version 3.1 (Ronquist and Huelsenbeck 2003). Analyses were run according to the general time reversible evolutionary model with gamma-distributed rate variation across sites and a proportion of invariable sites. For each analysis, we ran 1,000,000 generations and 25,000 burn-in iterations.
Tests of Selection
In the long term, coding sequences under pervasive positive selection are characterized by an excess of nonsynonymous (dn) over synonymous substitutions rates (ds [ω > 1]) (Garrigan and Hedrick 2003). By contrast, constraints in both protein structure and biological function are realized as an excess of synonymous substitutions (i.e., negative or purifying selection). For each TLR gene, positive selection across the sampled lineages was inferred using the HyPhy package (Pond et al. 2005) implemented in the web server hosted at http://www.datamonkey.org. Two codon-based maximum likelihood methods were used to estimate ω for every codon in the alignment. The alignments were composed of one sequence from each different species investigated. The Hyphy package permits handling ambiguous DNA sequences. We chose the default average option, which considers all possible resolutions of an ambiguous character in a weighted fashion, to compute nonsynonymous and synonymous substitutions at each codon position (Kosakovsky Pond and Frost 2005). First, we used the random effects likelihood (REL) model to infer site-by-site positive selection (for discussions about different available methods, see Kosakovsky Pond and Frost 2005). This is a generalization of the model implemented in PAML (Yang 2007) but includes more general nucleotide substitution models, the modeling of dn and dS rate variation and the use of Bayes factors for evaluation of empirical Bayes results (Pond and Muse 2005). The REL model is the best suited method for inferring positive selection from a small number of sequences (5–15), but it is also prone to report the highest rates of false positive detection. For each TLR locus, we searched for the best fitting nucleotide substitution model among 203 possible time reversible models using maximum likelihood analyses. Given the small size of our alignments (4–12 sequences), it is difficult to accurately estimate nucleotide substitution bias rates. We systematically contrasted positively selected sites with those obtained with the HKY85 model, which it is thought to perform well for a low number of sequences. Thus, we only considered those positively selected sites obtained independently with the two models (i.e., the best fitting nucleotide substitution model for each TLR locus and the HKY85 model). To minimize the overestimation of positively selected sites, we only considered those Bayes factors larger than 100 (i.e., those supporting decisive evidence of positive selection). In addition, we used the single likelihood ancestral counting (SLAC) method to obtain overall ω ratios and plot nucleotide substitution maps for each site in the alignment. The SLAC method is also very conservative, and consequently, false positive detection rates are expected to be low. Following the authors' recommendation, we established the level of statistical significance at P = 0.1 (i.e., the default option) for SLAC analyses.
For intraspecific analyses, overall ω values were calculated using the SLAC method, and deviations from neutral expectations of neutral evolution were tested through the Tajima's D test (Tajima 1989) implemented in DNAsp. The occurrence of recombination breakpoints in our alignments was tested using the platform GARD (Kosakovsky Pond et al. 2006) also implemented in the web server hosted at http://www.datamonkey.org.
Results
Amplification of TLR Genes in Non-model Avian Species
The identity of the species from which we obtained genetic data at each TLR locus is shown in figure 2. Our primers amplified TLR1LA, TLR5, and TLR7 loci in all avian species tested in this study. We also successfully isolated genomic DNA sequences of the entire avian TLR repertoire in Lesser Kestrels and House Finches. Only one species of seven failed to amplify the target loci in the case of TLR1LB, TLR2 (although TLR2A was not coamplified with TLR2B in Emu), TLR3, and TLR4. However, we were able to amplify TLR15 loci only in Lesser Kestrels, House Finches, and Leach's Storm Petrels and coding sequences for TLR21 only for Lesser Kestrels and House Finches. Coding sequences (excluding primers) ranged from 834 to 1,304 bp (supplementary table S1, Supplementary Material online). For the vast majority of DNA sequences isolated, stop codons or frameshift mutations were lacking. A TLR3 pseudogene was nevertheless coamplified along with a putative functional gene from Leach's Storm Petrel DNA (GU939628), and our primers preferentially amplified TLR5 pseudogenes in house finches (GU904827) and in the White-fronted Amazon (GU904708). Pseudogenes exhibited a high incidence of stop codons and disrupted reading frames.
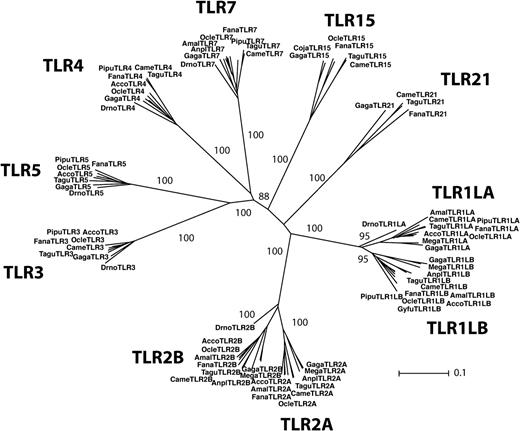
Phylogenetic reconstruction of the avian TLR repertoire based on the neighbor joining method. This phylogeny shows the TLR sequences isolated in this study plus chicken, zebra finch, and a few TLR sequences isolated from other avian species. Bootstrap support values for the main branches defining different genes are shown. Gaga, Gallus gallus; Tagu, Taeniopygia guttata; Fana, Falco naumani; Amal, Amazona albifrons; Acco, Accipiter cooperii; Drno, Dromaius novaehollandiae; Pipu, Picoides pubescens; Came, Carpodacus mexicanus; Ocle, Oceanodroma leucorhoa; Anpl, Anas platyrhynchos; Mega, Meleagris gallopavo; Gyfu, Gyps fulvus; and Coju, Coturnix japonica. See table 1 for GenBank accession numbers.
Our putatively functional TLR loci retained orthologous relationships regarding the members of the TLR multigene family described in chickens (fig. 2). The occurrence of gene duplicates involving TLR1LA and TLR1LB as well TLR2A and TLR2B was widespread throughout our interspecific survey. Only in the case of the Emu was a single gene copy amplified (TLR1LA and TLR2B, respectively), suggesting that the duplication leading to these orthologs may have occurred after the divergence of Neognaths from Paleognaths or that an independent gene loss could have occurred independently in ratites. At first, we coamplified TLR2A and TLR2B genes using the same pair of primers (supplementary table S1, Supplementary Material online). Inspection of direct sequencing chromatograms then revealed a divergent region at the 5′ end plus a conserved region at the 3′ end of the PCR amplicon. We therefore designed internal primers for the specific sequencing of the divergent region between TLR2A and TLR2B genes. (avTLR2AR 5′-CCAAAATTRTTTTSRCTRATRTCAAG-3′ and avTLR2BR 5′-RTTTTSRCTRATGTCTAARAS-3′). These primers, targeting the boundary between the divergent and the conserved region of the two gene duplicates, were designed using an alignment of TLR2A and TLR2B sequences isolated from the chicken (NM_204278.1, NM_001161650.1), Turkey (FJ477860.1, FJ477861.1), zebra finch (XM_002198470.1, XM_002196366.1), and mallard (FJ477862.1, FJ477862.1) and further optimized according to the direct sequencing chromatograms obtained for the species we investigated. For each species, we introduced IUPAC degenarate codes for those positions found to be polymorphic within and in the vicinity of the primer locations. The sequencing chromatogram generated with the reverse primer avTLR2R (fig. 1) provided the sequence data needed in this respect. Once the coding sequence from each of the TLR2A and TLR2B genes could be deciphered, we noticed a pattern of divergent evolution in the two halves of the gene. The first half of the coding sequences retained orthologous relationships when the fragments isolated from different species (590 bp for TLR2A genes and 540 bp for TLR2B genes) were compared. By contrast, clustering of sequences within species was suggested when the second half of the coding sequence (651 bp) was visualized through phylogenetic trees (fig. 3). A similar trend was observed for TLR1LA and TLR1LB (fig. 3). The alignment of the two gene duplicates revealed a region toward the 3′ end of the gene (AAs 395–579 for TLR1LA and AAs 243–427 for TLR1LB) in which sequences clustered according to species. By contrast, sequences clustered according to locus when the first half of the coding sequence was analyzed phylogenetically (AAs 288–394 for TLR1LA and AAs 137–242 for TLR1LB; fig. 3).
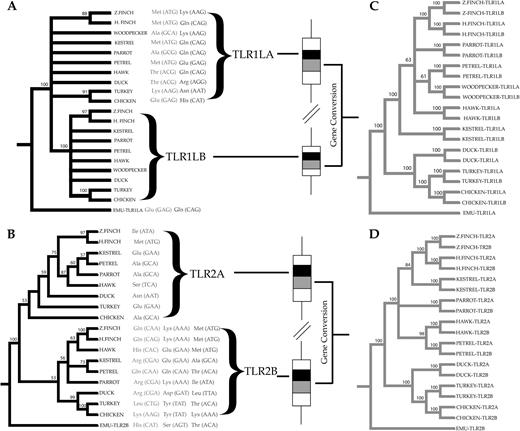
Phylogenetic relationships between two regions encoding part of the extracellular domains of TLR1LA, TLR1LB, TLR2A, and TLR2B in birds. In the trees in black on the left, representing regions in black in the indicated gene segments, orthologous clusters among the sequences isolated from different species are clearly defined. By contrast, the trees in gray on the right, representing the regions in gray in the gene segments, reveal clustering by species. In panel A, a total of 315 bp corresponding to the amino acid positions 288–394 in the chicken TLR1LA gene plus 315 bp corresponding to the amino acid positions 137–242 in the chicken TLR1LB gene were analyzed. In panel B, a total of 590 bp corresponding to the amino acid positions 232–427 in the chicken TLR2A gene plus 540 bp corresponding to the amino acid positions 237–415 in the chicken TLR2B gene were analyzed. In panels C and D, the analysis of the next 552 bp (amino acid positions 395–579 for TLR1LA and 243–427 for TLR1LB) and 651 bp (amino acid positions 428–644 for TLR2A and 416–632 for TLR2B genes) shows clustering of sequences according to species. Significant evidence of recurrent positive selection is also indicated for TLRlLA (codon 238, left; codon 301, right), TLR2A (codon 304), and TLR2B (codon 293, left; codon 295, middle; and codon 296, right).
Molecular Evolution of the TLR Multigene Family in the Avian Lineage
Overall, we consistently found a clear excess of synonymous over nonsynonymous substitutions at every TLR locus, with mean ω values ranging from 0.196 to 0.517 (see table 1 and fig. 4). However, the REL method reported instances of statistically significant positive selection in 39 amino acid positions across the avian lineage. One of these amino acid sites was confirmed by the SLAC method. The SLAC method only reported positive selection in one codon of the TLR1LB gene and one codon of the TLR1LA gene not previously indicated by the REL method (table 2). The strength and nature of selection varied between different TLR loci. For instance, TLR5 showed a high accumulation of codons exhibiting positive selection within the region sequenced. We also detected a considerable number of codons showing an excess of nonsynonymous substitutions in TLR3, TLR4, and TLR15. Other genes such as TLR1LA, TLR1LB, TLR2A, and TLR2B displayed low numbers of positively selected sites. Purifying selection, on the other hand, seemed to be the main evolutionary force shaping patterns of genetic variation at TLR7 and TLR21 loci (see fig. 4 and table 2). Overall, we found a total number of 5,340 amino acid substitutions across all genes and species. The replacement of Val for Leu or Ile was the most abundant type of amino acid substitution (7.62%). In fact, amino acid substitution involving the five highly hydrophobic amino acids Val, Leu, Ile, Met, and Ala accounted for 20.92% of replacements. Substitutions involving these five hydrophobic amino acid and the polar amino acids Ser, Gln, Thr, Asn, Tyr, and His reached a relative frequency of 19.02% after considering all possible combinations between these amino acids. We also found a high frequency of substitutions involving the charged amino Asp, Glu, Lys, Arg and the polar amino acids Ser, Thr, Asn, Gln, and His (34.94%).
Mean ω Values across Ten TLR in Birds.
| Gene | Ligands | N | ω | GenBank Accession numbers |
| TLR1LA | Unknown; bacterial diacylated lipoproteins? | 11 | 0.383 (0.345,0.421) | NM_001007488.3, FJ477857.1, FJ477859.1, XM_002189723.1, GU904989-95 |
| TLR1LB | Unknown; bacterial diacylated lipoproteins? | 11 | 0.400 (0.360,0.443) | GU904944-49, NM_001081709.2, FJ477858.1, FJ477859.1, DQ480086.1, XM_002189723.1 |
| TLR2A | Bacterial di- and triacylated lipoproteins | 9 | 0.459 (0.417,0.505) | GU904950-54, NM_204278.1, FJ477860.1, FJ477862.1, XM_002198470.1 |
| TLR2B | Bacterial di and triacylated lipoproteins | 10 | 0.374 (0.338,0.412) | GU904955-60, NM_001161650.1, FJ477861.1, FJ477862.1, XM_002196366.1 |
| TLR3 | dsRNA | 8 | 0.343 (0.297,0.394) | GU904961-65, XM_002190852.1, NM_001011691.2, HQ267385 |
| TLR4 | LPS | 8 | 0.517 (0.458,0.580) | GU904966-71, NM_001030693.1, FJ695613.1 |
| TLR5 | Flagellin | 7 | 0.482 (0.426,0.544) | GU904972-76, NM_001024586.1, XM_002188726.1 |
| TLR7 | ssRNA | 10 | 0.386 [0.341,0.435] | GU904977-83, NM_001011688.1, DQ888644.1, XM_002194896.1 |
| TLR15 | Unknown; bacteria component? | 6 | 0.423 (0.382,0.468) | GU904984-86, NM_001037835.1, XM_002197069.1, HM773176.1 |
| TLR21 | Microbial DNA | 4 | 0.196 (0.169,0.225) | GU904987-88, NM_001030558.1, NW_002218839.1 |
NOTE.—Brackets indicate 95% confidence intervals for ω. Ligand specificity and GenBank accession numbers are also provided. The number of species (one sequence per species) analyzed is also indicated. SSRNA, single-stranded RNA
Positively Selected Amino Acid Sites across the Avian TLR Repertoire as Inferred by the REL and SLAC Codon-Based Maximum Likelihood Methods.
| Locus | Method of Identifying Positively Selected Sites | |
| REL | SLAC | |
| TLR1LA | 238 | 301 |
| TLR1LB | None | 168 |
| TLR2A | 304 | None |
| TLR2B | 293, 295, 296, and 355 | None |
| TLR3 | 210, 234, 253, 280, 406, and 576 | None |
| TLR4 | 274, 352, 397, and 406 | 352 |
| TLR5 | 244, 258, 261, 264, 309, 331,422, 455, 466, 471, 501, 502, and 561 | None |
| TLR7 | None | None |
| TLR15 | 128, 142, 168, 172, 185, 210, 233, and 283 | None |
| TLR21 | None | None |
NOTE.—Those positively selected sites inferred by both methods are indicated in bold. Amino acid positions are called based on the chicken TLR repertoire.
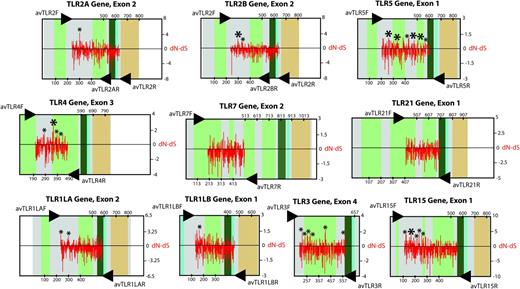
Map of nucleotide substitution patterns (dN, nonsynonymous substitution rates; dS , synonymous substitution rates) along ten TLR genes in birds (red bars). Small asterisks indicate positively selected sites inferred using the REL codon-based maximum likelihood method or SLAC method but not both. Large asterisks indicate positively selected sites confirmed by both methods or short regions of the coding sequence comprising two or more nearby REL-inferred positively selected sites (see table 2). Exons are depicted using boxes, and amino acid positions are indicated. White areas represent noncoding regions. Colored areas contain coding sequences. Colors represent different conserved domains (light green, LRR domains; dark green, C-terminal LRR domains; cian, transmembrane segment; orange, TIR signaling domain). The structure of TLRs is adapted from that described in chickens by Temperley et al. (2008). Arrows pinpoint the location of the primers used in this study.
Molecular Evolution of TLR Genes within Species
Polymorphism statistics in Lesser Kestrels and House Finches varied among different TLR loci and between the two species (tables 3 and 4). Overall, we detected 128 single nucleotide polymorphisms (SNPs) across the lesser kestrel data set and 188 SNPs for the house finch data set. The number of different haplotypes at each TLR locus ranged from 1 to 16 and the average number of nucleotide differences between haplotypes ranged from 1 to 11.64. Putative pseudogenes were less polymorphic than putatively functional genes, as exemplified by the comparison of the TLR5 locus of the Lesser Kestrels and the House Finch TLR5 pseudogene. Except for the TLR5 locus of the lesser kestrel, an excess of synonymous SNPs over nonsynonymous SNPs was the most common pattern found at each TLR locus. Mean ω values for different TLR loci ranged from 0 to 1.19 (tables 3 and 4). Tajima's D values generally showed a bias toward negative values, indicating a deficit of high frequency segregating (variable) sites that might be the result of positive and directional selection. Mean Tajima's D value across 14 TLR loci (combining TLR loci from both species) was significantly negative (Tajima's D = −0.66 ± 0.42, see tables 3 and 4). Finally, we found significant instances of single recombination breakpoints at the House Finch TLR1LA and the Lesser Kestrel TLR1LB as well as significant evidence for multiple recombination breakpoints (N = 3) at TLR15 in both species.
Polymorphism Statistics at Ten TLR Genes in Lesser Kestrels.
| N | Fragment Size (bp) | h | k | π | θW | Tajima's D | SNPs (syn:nsyn) | ω (95% CI) | GenBank Accession Numbers | |
| TLR1LA | 8 | 1,163 | 11 | 4.5 | 0.0039 | 0.0056 | −1.33 | 19 (14:5) | 0.18 (0.07, 0.37) | GU904861–71 |
| TLR1LB | 8 | 990 | 15 | 3.8 | 0.0039 | 0.005 | −0.84 | 16 (12:4) | 0.17 (0.07, 035) | GU904872–86 |
| TLR2A | 8 | 543 | 5 | 2.4 | 0.004 | 0.0053 | −1.14 | 6 (4:2) | 0.19 (0.03, 0.58) | GU904887–91 |
| TLR2B | 8 | 565 | 3 | 1.33 | 0.0024 | 0.0023 | N.A. | 2 (1:1) | N.A. | GU904894-97 |
| TLR3 | 8 | 1,160 | 2 | 1 | 0.0009 | 0.0009 | N.A. | 1 (1:0) | N.A. | GU904898-99 |
| TLR4 | 8 | 818 | 7 | 2.1 | 0.0026 | 0.003 | −0.53 | 6 (6:0) | 0 | GU904900–06 |
| TLR5 | 8 | 1,265 | 16 | 5.4 | 0.0043 | 0.0047 | −0.39 | 20 (6:14) | 1.19 (0.77, 1.76) | GU904907–22 |
| TLR7 | 8 | 869 | 4 | 1.5 | 0.0017 | 0.0019 | N.A. | 3 (1:2) | N.A. | GU904923-26 |
| TLR15 | 8 | 1,300 | 14 | 11.6 | 0.009 | 0.010 | −0.61 | 43 (28:15) | 0.24 (0.15, 0.35) | GU904927–40 |
| TLR21 | 4 | 834 | 3 | 8.0 | 0.009 | 0.009 | N.A. | 12 (8:4) | N.A. | GU904941–43 |
NOTE.—The number of individuals analyzed per gene (N), the number of inferred haplotypes (h), the average number of nucleotide differences between haplotypes (k), the mean nucleotide diversity (π), and the Watterson's estimator of the population mutation rate (θW) are indicated. This table also shows the overall number of SNPs and the ratio between synonymous (syn) and nonsynonymous (nsyn) SNPs. Tajima's D and ω values are given for those TLRs loci in which we gathered at least five different haplotypes. CI, confidence intervals; N.A., not available because of low haplotipic diversity.
Polymorphism Statistics at Ten TLR Genes in House Finches.
| N | Fragment Size (bp) | h | k | π | θW | Tajima's D | SNPs (syn:nsyn) | ω (95% CI) | GenBank Accession Numbers | |
| TLR1LA | 51 | 1,161 | 62 | 6.74 | 0.0058 | 0.008 | −0.93 | 44 (27:17) | 0.24 (0.17, 0.33) | GU904709–70 |
| TLR1LB | 8 | 951 | 20 | 6.38 | 0.0067 | 0.0074 | −0.37 | 25 (19:6) | 0.13 (0.06, 025) | GU904771–90 |
| TLR2A | 8 | 560 | 8 | 3.75 | 0.0067 | 0.0089 | −1.27 | 13 (8:5) | 0.25 (0.09, 0.55) | GU904791–98 |
| TLR2B | 8 | 513 | 11 | 3.75 | 0.0078 | 0.0068 | 0.11 | 11 (7:4) | 0.24 (0.10, 0.49) | GU904799–803 |
| TLR3 | 8 | 952 | 9 | 3.61 | 0.0038 | 0.0042 | −0.51 | 11 (5:6) | 0.67 (0.29, 1.29) | GU904804–812 |
| TLR4 | 8 | 789 | 14 | 3.85 | 0.0049 | 0.0063 | −0.95 | 16 (8:8) | 0.68 (0.37, 1.10) | GU904813–826 |
| TLR5 | 8 | 951 | 3 | 1 | 0.0001 | 0.0001 | N.A. | 2 (N.A.) | N.A. | GU904827 |
| TLR7 | 8 | 982 | 15 | 7.5 | 0.0077 | 0.0084 | −0.35 | 27 (15:12) | 0.30 (0.18, 0.48) | GU904828–42 |
| TLR15 | 8 | 1,300 | 16 | 10.70 | 0.0082 | 0.0086 | −0.17 | 37 (19:18) | 0.54 (0.38, 0.73) | GU904843–58 |
| TLR21 | 4 | 831 | 2 | 2.0 | 0.0024 | 0.0024 | N.A. | 2 (1:1) | N.A. | GU904859–60 |
NOTE.—See table 3 for description of statistics. A TLR5 pseudogene is indicated by an asterisk. CI, confidence intervals.
Discussion
This is the first study to characterize the entire TLR multigene family in non-model avian species and presents the most extensive survey of TLR evolution in the avian clade thus far. Most studies conducted in species other than chicken have focused on the characterization of particular expressed TLRs (e.g., de la Lastra and de la Fuente 2007; MacDonald et al. 2008; Vinkler et al. 2009). Overall, we found a conservative mode of evolution in avian TLRs, with a predominance of synonymous substitutions but also significant instances of positive selection acting upon a few amino acid sites falling in pathogen-recognition domains. In this regard, our findings bear similarity to a recent and similarly comprehensive survey of TLRs in primates (Wlasiuk and Nachman 2010).
Gene Duplication in the TLR Repertoire in Birds
Our intraspecific survey supports the retention of orthologous relationships within the TLR multigene family in birds (fig. 2). TLR1LA and TLR1LB as well as TLR2A and TLR2B duplicates are widespread in the avian clade except for emus. Previous studies based on synonymous and nonsynonymous substitution rates have dated the duplication of TLR2 genes about 65 Ma in chickens (Temperley et al. 2008). Although this information is in agreement with our findings, we cannot explain the lack of TLR1LB genes in emus given that TLR1L gene duplication has been estimated to occur 147 Ma (Temperley et al. 2008), and the divergence time between emus and chickens is dated about 104 Ma (The time tree of life, http://www.timetree.org). Importantly, this study shows clear evidence of concerted evolution after speciation for both TLR1L and TLR2 tandem duplicates, and therefore, the estimates calculated by Temperley et al. (2008) must be interpreted with caution. We also cannot reject the hypothesis of an independent gene loss in Emu. In this respect, southern blots or deeper genomic surveys in emus and related species may be able to confirm the lack of TLR1LB and TLR2A genes in ratites that we observe using PCR.
Patterns of concerted evolution after speciation between TLR1LA and TLR1LB and TLR2A and TLR2B genes are worthy of note (fig. 3). The central subdomains that supposedly encode the ligand-binding region (e.g., Jin et al. 2007) are not evolving in a concerted fashion, a reasonable expectation given that homogenization by gene conversion of the amino acid residues directly involved in pathogen recognition would mitigate the spectrum of PAMPs that can be recognized. However, concerted evolution could be adaptive for homogeneization of those subdomains involved in dimerization, the interaction with coreceptors (Iwasaki and Medzhitov 2010), or the embedding of the glycoproteins into the cell surface or membrane compartments. Gene conversion events could have been favored by the close proximity of the two pairs of gene duplicates in the avian chromosome 4 (see for instance Ezawa et al. 2006). In fact, TLR2A and TLR2B genes are separated by just 5.3 Kb in both the zebra finch and the chicken genome. The physical distance between TLR1LA and TLR1LB genes is still relatively small at 11.5 Kb in the zebra finch genome and 8.5 Kb in the chicken genome (see also Temperley et al. 2008). Finally, the lack of molecular cloning experiments prevented us from testing in detail the occurrence of a recent TLR7 gene duplication in the songbird lineage (Cormican et al. 2009), although the inspection of phase-inferred haplotypes in the house finch seems to support this prediction.
Positive Selection in the Avian TLR Repertoire
Our genetic analyses have revealed an excess of synonymous over nonsynonymous substitutions during the evolution of the TLR multigene family in birds that is compatible with purifying selection (table 1and figure 4). Avian TLR genes are therefore mostly evolving under functional constraints presumably because of the need to preserve a well-established biological function. However, despite a global trend to maintain largely unchanging TLR repertoires in birds, our survey suggests significant instances of positive selection acting on a few amino acid sites falling in pathogen-recognition domains (table 2 and figure 4). These findings would be in agreement with species-specific differences during the recognition of related types of ligands (reviewed by Werling et al. 2009). Recent studies have emphasized the influence of the number of taxa investigated in the power to detect positive selection with codon-based approaches (see for instance Wlasiuk and Nachman 2010). In our study, we have emphasized examining multiple genes rather than large numbers of species. Thus, more detailed surveys of additional bird species may yield better and more accurate evidence for positive selection.
We found strong evidence of recurrent positive selection in the amino acid 304 of the avian TLR2A gene. Three amino acids in the TLR2B molecule (293, 295, and 296) in close proximity to one another also reveal an excess of nonsynonymous mutations in this region (see fig. 3). Similarity search for the chicken TLR2A and TLR2B genes with respect to the human TLR2 gene reveals these amino acid positions mapping to the ligand-binding domain identified from the crystal structure of the complex TLR2–TLR1 and the tri-acylated Pam3CSK4 lipoprotein in humans and mice (Jin et al. 2007). Moreover, recurrent amino acid substitutions within these codons are not conservative. For instance, Ala304 has been replaced by Glu, Ser, Asn, Met, or Ile in the TLR2A molecule. Amino acid substitutions of functional relevance in the putative ligand-binding domain of TLR2B include the replacement of His293 by Lys, Leu and Arg, or Gln, the substitution of Ser295 by Asp, Glu, Tyr, Gln, or Lys and the substitution of Thr296 by Met, Leu, Lys, Ala, or Ile (see fig. 3). Outside this region, amino acid substitutions are much more conservative, involving the replacement of His355 by Gln, Asn, and Lys (table 2). Our findings are also in agreement with comparative studies of the TLR2 gene in mammals, where the highest dn/ds ratios have been shown to occur within the putative ligand-binding region (Jann et al. 2008).
Because of the lack of additional crystallographic structures of TLR and their ligands, with the exception of TLR4 and TLR3, discussion of functional relevance of some of the amino acid replacements found in this study is speculative. Moreover, information about the amino acid residues involved in the recognition of dsRNA by TLR3 is not yet conclusive (Bell et al. 2005), and TLR4 is thought to interact with the LPS-MD-2 complex rather than binding directly to LPS (Kim et al. 2007). Nevertheless, we found some codons particularly interesting. For instance, Glu238 has been replaced by amino acids with contrasting physicochemical properties, such as Thr, Lys, Met and Ala, and His301 has been involved in nonconservative replacements involving Asn, Arg, Glu, and Lys in the TLR1LA molecule (see also fig. 3). Intriguingly, crystallographic studies have revealed that the ligand-binding region of the equivalent TLR1 molecule in humans resides near this region (AAs 258–310; Jin et al. 2007), and studies conducted in primates have revealed positively selected sites falling in this region as well (Wlasiuk and Nachman 2010). We also found statistical support for several positively selected sites between the central and the C-terminal subdomain of the TLR3 molecule (fig. 4). Crystallographic studies have suggested that the concave surface comprised by these two subdomains may host putative binding sites for viral dsRNA (Liu et al. 2008). Crystallographic structures of mouse TLR4 have shown, by contrast, that the interaction between TLR4 and the complex LPS-MD-2 takes place in the concave surface between the N-terminal and the central subdomains (Kim et al. 2007). We detected a positively selected site falling in this region (codon 274) with amino acid substitutions of putative functional relevance. Recent studies in primates have suggested a high accumulation of positively selected sites within this region as well (Wlasiuk and Nachman 2010). The positively selected codon 352 and 397 (fig. 4) encompass a large number of amino acid substitutions with substantial changes in the polarity and size of the side chain. Interestingly, these codons are included within a hypervariable region of the central domain that it has proven essential for the species-specific recognition of modified LPS in humans and that has shown evidence of positive selection in mammals (Hajjar et al. 2002). However, the detailed molecular bases through which TLR4 can discriminate between different types off LPS are largely unknown.
The highest accumulation of positively selected sites was inferred in the case of the TLR5 gene. TLR5 is the only member of the multigene family that recognizes an exclusively proteinaceous ligand. Even though TLR5 recognizes an evolutionarily conserved domain of the flagellins conforming the bacteria flagellum (Smith et al. 2003), it is reasonable to predict higher mutation rates for flagellins than for other PAMPs. Thus, Andersen-Nissen et al. (2005) have demonstrated the crucial role of TLR5-based flagellin recognition during the evolutionary arms race between pathogenic bacteria and vertebrate hosts. This study showed how particular flagellated bacteria can evade the immune system via a few mutations in one of the flagellin conserved domains. A recent study by Wlasiuk et al. (2009) has also described a pattern of recurrent positive selection in the TLR5 of primates. Mutagenic experiments have mapped the flagellin recognition site within the central 228 amino acid residues conforming the extracellular domain. This is in fact the coding region encompassed by our primers, and the region in which we detected the largest accumulation of positively selected sites (table 2 and figure 4). Our genetic analyses also show an accumulation of positively selected sites within the central region of the TLR15 extracellular domain. Although information about binding sites of TLR15 molecule is not available, our primers covered almost the entire extracellular domain. Thus, some of these positively selected sites may have relevance regarding the recognition of bacteria PAMPs in this particular case (Nerren et al. 2009).
Finally, both TLR7 and TLR21 seem to have evolved under strong stabilizing selection. Additional positively selected sites could have become unnoticed, however, due to the fact that our primers failed to cover an important region of the extracellular domains (see fig. 4). The lack of any structural information about both TLRs prevented an adequate target of particular protein subdomains in any case, although recent studies have indicated that endosomal TLRs targeting nucleic acids might evolve under stronger purifying selection than cell surface TLRs (Wlasiuk and Nachman 2010).
Population Genetics of Avian TLRs
Consistent with recent population genetic studies in chickens (Downing et al. 2010), we found low to moderate levels of genetic polymorphism at the avian TLR multigene family in Lesser Kestrels and House Finches (tables 3 and 4). The prevalence of silent nucleotide substitutions is consistent with the conservative evolutionary rates suggested for the avian TLR repertoire in general (see above). These patterns are also in agreement with extensive polymorphism surveys conducted in human populations (Misch and Hawn 2008) and different breeds of cattle. Nonetheless, TLRs seem to be more polymorphic in free-ranging populations of birds than in livestock. For instance, only eight SNPs have been identified in 16 cattle breeds across TLR2, TLR4, and TLR6 genes after sequencing several hundred individuals (Mariotti et al. 2009). Likewise, only 14 nonsynonymous SNPs were documented across ten cattle breeds at TLR5, TLR1, and TLR10 genes (Seabury et al. 2007). The conservative nature of many of the amino acid replacements documented in these previous studies nonetheless fit with those found in the present study (see supplementary table S2, Supplementary Material online). Clearly, TRL loci are not as polymorphic as MHC genes in the house finch and in the lesser kestrel (Hess et al. 2007; Alcaide et al. 2008), but it is not yet clear how the polymorphism of TLRs will rank among other protein coding genes in these or other species.
Negative Tajima's D values suggest that positive directional selection may purge deleterious or disadvantageous mutations from avian populations. These findings are in agreement with recent studies conducted in commercial breeds of domestic chickens and wild populations of jungle fowl (Downing et al. 2010). However, our results must be interpreted with cautions because both population structure and history can affect Tajima's D values and a more detailed consideration of other evolutionary factors in the two species is therefore needed. Supplementary table S2, Supplementary Material online also shows that a large portion of the most frequent nonsynonymous mutations is translated into conservative amino acid substitutions. Thus, negative selection (in form of an excess of silent mutations) and positive directional selection (in form of low frequencies of deleterious or selectively disadvantageous mutations) reinforces the idea that TLRs may be subjected to strong functional constraints and species-specific patterns of pathogen recognition (reviewed by Werling et al. 2009). That said, spatially-varying selection patterns acting on TLRs have been described in human populations (Barreiro et al. 2009) and variable coevolutionary dynamics between different species have been described in primates (Wlasiuk and Nachman 2010).
TLR as Promising Immune Markers in Molecular Ecology
In general, our primers have proven successful at amplifying TLR loci across a large diversity of bird species. Failure during PCR-amplification of particular species at some TLR loci is not discouraging because the addition of new sequence data by this study may assist the redesign of primers for a better coverage of the bird lineage. To this end, we have provided a supplementary list of alternative primers for the isolation of TLR loci in birds (supplementary table S3, Supplementary Material online). The proposed primers, which also cover a large region of the extracellular domains, have been designed after careful examination of sequence alignments now emerging from a considerable number of phylogenetically diverse taxa. However, this new set of primers has not been tested in the present study, and future studies may dictate their utility. Our study also reports some of the very few bird TLR pseudogenes described in the literature (see also Philbin et al. 2005). The coamplification or preferential amplification of pseudogenes using our primers on genomic DNA could in principle be overcome through further optimization for specific species.
Although a large array of genes have been suggested to play a crucial role during pathogen detection and clearance in humans and livestock (Kelley et al. 2005; Kaiser et al. 2008; Seabury et al. 2010), the literature in molecular ecology tends to emphasize genes of the MHC in free-ranging populations of non-model species (Acevedo-Whitehouse and Cunningham 2006). From pathogen-host coevolution to sexual selection, interest in the evolutionarily relevance of MHC genes is high, and there are a few empirical examples of behavioral and ecological consequences of variation at these genes (reviewed by Sommer 2005; Piertney and Oliver 2006; Spurgin and Richardson 2010). However, the ability of MHC diversity to explain the entirety of wildlife immunogenetics has been the subject of debate, and investigation of other candidate genes for immunoecology has been encouraged (Acevedo-Whitehouse and Cunningham 2006; Radwan et al. 2009). To this end, our study brings into focus ten TLR loci for the investigation of the evolutionary relevance of innate immune genes regarding microbial infection in birds.
We suggest that patterns of genetic variation at TLR loci would be particularly interesting to study in bottlenecked, fragmented, and decimated populations. In these particular cases, genetic drift can overcome selection, and deleterious or selectively disadvantageous mutations can become rapidly fixed. As a result, differences in pathogen outcomes between different populations might be expected. The evolutionary dynamics of TLR genes in those organisms able to colonize a new habitat might also be worth investigating in the context of TLR variation. Our intraspecific survey has reported some nonsynonymous and nonconservative SNPs at relatively high frequencies (see supplementary table S2, Supplementary Material online). These SNPs are candidates to test the influence of particular amino acid substitutions regarding resistance or susceptibility to particular microbial infections (e.g., Schröder and Schumann 2005; Misch and Hawn 2008; Werling et al. 2009). Nonetheless, we have captured but a small snapshot of genetic variation, and SNPs located in other TLR domains rather than the extracellular domains and those displayed by members of the downstream signaling cascade are surely relevant to pathogen-host coevolution as well (see for instance Miller et al. 2005). We imagine in the future an avian immunoecology in which MHC genes, TLRs, and many other genes of immune relevance can be surveyed to help explain variation in pathogen and parasite load across populations and species.
House finch samples were kindly provided by S. Balenger and G. Hill. Storm Petrel samples were collected in collaboration with G. Nevitt. Daniel E. Janes kindly provided Emu DNA. During this research, M.A. was funded by a postdoctoral fellowship from the Ministerio de Ciencia e Innovacion (www.micinn.es) of the Spanish government. Additional funding for this study came from National Science Foundation grant IOS—0923088 to G. Hill and S.V.E. We thank two anonymous reviewers for helpful comments on the manuscript.
References
Author notes
Associate editor: Yoko Satta
