


Abstract
Approaches to reconstruct phylogenies abound and are widely used in the study of molecular evolution. Partially through extensive simulations, we are beginning to understand the potential pitfalls as well as the advantages of different methods. However, little work has been done on possible biases introduced by the methods if the input data are random and do not carry any phylogenetic signal. Although Tree-Puzzle (Strimmer K, von Haeseler A. 1996. Quartet puzzling: a quartet maximum-likelihood method for reconstructing tree topologies. Mol Biol Evol. 13:964–969; Schmidt HA, Strimmer K, Vingron M, von Haeseler A. 2002. Tree-Puzzle: maximum likelihood phylogenetic analysis using quartets and parallel computing. Bioinformatics 18:502–504) has become common in phylogenetics, the resulting distribution of labeled unrooted bifurcating trees when data do not carry any phylogenetic signal has not been investigated. Our note shows that the distribution converges to the well-known Yule–Harding distribution. However, the bias of the Yule–Harding distribution will be diminished by a tiny amount of phylogenetic information. maximum likelihood, phylogenetic reconstruction, Tree-Puzzle, tree distribution, Yule–Harding distribution.
Introduction
Bayesian analysis and maximum likelihood approaches are routinely used in phylogenetic reconstruction (Nei and Sudhir 2000, Felsenstein 2003, Salemi and Vandamme 2003, Semple and Steel 2003, Yang 2006, and references therein). Although some publications discuss possible biases when carrying out a Bayesian analysis (Pickett and Randle 2005, Brandley et al. 2006), almost no work has been done for maximum likelihood methods if the input data are random and do not carry any phylogenetic signal. A fact that is certainly due to the difficulty in defining “random” data. For Tree-Puzzle (Strimmer and von Haeseler 1996, Schmidt et al. 2002), the term random data fits easily into an evaluable framework. Our note discusses the resulting distribution of labeled unrooted bifurcating trees if the tree topology of a quartet is randomly determined and independent of the tree topologies of other quartets.
In the following, we distinguish between tree shapes and tree topologies. A “(tree) topology” for n taxa is an unrooted leaf-labeled bifurcating tree with n leaves. The leaf labels are called taxa. A “(tree) shape” can be obtained from a topology by ignoring the labels. Thus, a shape is an unrooted unlabeled bifurcating tree. We introduce k-tree for a tree topology with k labeled leaves and k-shape to denote a tree shape with k unlabeled leaves.
The “Tree-Puzzle (TP)” (Strimmer and von Haeseler 1996) algorithm reconstructs a tree topology for n taxa using the quartet trees inferred from  quartets (subsets with four different taxa). For each quartet {A,B,C,D}, three topologies are possible, abbreviated as AB||CD,AC||BD, and AD||BC. In principle, the TP algorithm starts with an unique 3-tree and repeatedly inserts the next taxon into (k − 1)-tree to construct k-tree.
In our setting, we assume no phylogenetic information in the data. This is equivalent to the assumption that each of the three topologies for a quartet is equally likely and that the tree topology for each quartet is independent of the other quartets. Thus, we randomly select one quartet tree for each of the quartets. Hence, 3 possible combinations of quartet trees will serve as input to TP. We then ask, what is the resulting distribution on the set of n-trees. Because we analyze all possible quartet tree combinations, it suffices to analyze the probability of the tree shapes. We note that from six taxa on, more than one tree shape exists.
Table 1 summarizes the results of the computation. Column random Tree-Puzzle (“rd TP”) displays the tree shape probabilities under the TP approach and the column proportional to distinguishable arrangement (“PDA”) gives the probabilities of the shapes expected under the PDA, that is, where each topology is equally likely (Semple and Steel 2003).
Shape Probabilities under the Uniform Tree Model (PDA), the rd TP. The Last Column Displays the Shape Probabilities If only External Branches Are Admissible to Add a New Taxon
 |
|
Shape Probabilities under the Uniform Tree Model (PDA), the rd TP. The Last Column Displays the Shape Probabilities If only External Branches Are Admissible to Add a New Taxon
|
|
The TP algorithm results in a different probability distribution. The caterpillar tree, that is, the tree with exactly two cherries, occurs less frequently than one would expect under a PDA model, whereas the trees with the maximal number of cherries occur more frequently with respect to the PDA probabilities. Due to the complex dependencies in the generation scheme of tree shapes, it is very difficult to draw general conclusions. However, table 2 displays the quick drop of insertion probabilities for internal edges under TP, whereas under the uniform edge insertion model, the probability of insertion at an internal edge equals and approaches 1/2 for large n. Thus, the probability of a k-shape under TP is mainly determined by the insertion probability for an external edge. In other words, a good approximation to the tree shape distribution under TP is the uniform external branch insertion only model. The results are displayed in the last column of table 1. We observe that the quality of the approximation is indeed very good.
Probabilities to Insert a Taxon at an Inner Branch If Each Branch of the Tree Is Selected Uniformly (“Uniform”) or if the Tree-Puzzle Algorithm Is Applied (rd TP)
 |
|
Probabilities to Insert a Taxon at an Inner Branch If Each Branch of the Tree Is Selected Uniformly (“Uniform”) or if the Tree-Puzzle Algorithm Is Applied (rd TP)
|
|
To insert a new taxon only at the external edges of a tree describes a model of speciation that is well known as the Yule process (Yule 1924). Here, at any time, each species has the same probability to split into two new species. The resulting probability distribution on the space of n-trees is the so-called Yule–Harding distribution (Harding 1971, Dobson 1974). Thus, our extensive study shows that the TP algorithm approximates the Yule–Harding distribution on the set of k-shapes if the quartet topologies are determined randomly. The Yule model was exactly used as a prior in Bayesian approaches toward a phylogenetic inference (Rannala and Yang 1996, Mau et al. 1999). In other words, trees generated by random TP implicitly resemble those generated under a model of speciation that is in wide use. If the Yule model is, however, a good approximation to the true mode of speciation is still an open question (Blum and François 2006).
Properties of trees generated under the Yule speciation model have been investigated (McKenzie and Steel 2000, Steel and McKenzie 2001). For example, the probability distribution for the number of cherries is asymptotically normal (McKenzie and Steel 2000). Our study revealed that the mean and variance of the number of cherries on trees generated by rd TP lead to those under the Yule speciation model (see table 3) when appropriately corrected for the unrooted case.
The Mean and Variance of the Number of Cherries on Trees Generated by rd TP and under Yule Speciation Model
| n | TP-μμ | Yule-μ | μ-dif | TP-σ2 | Yule-σ2 | σ2-dif |
| 4 | 2.000 | 2.000 | 0.000 | 0.000 | 0.000 | 0.000 |
| 5 | 2.000 | 2.000 | 0.000 | 0.000 | 0.000 | 0.000 |
| 6 | 2.193 | 2.200 | 0.007 | 0.156 | 0.160 | 0.004 |
| 7 | 2.461 | 2.467 | 0.006 | 0.249 | 0.249 | 0.000 |
| 8 | 2.758 | 2.762 | 0.005 | 0.315 | 0.315 | 0.000 |
| 9 | 3.068 | 3.071 | 0.003 | 0.372 | 0.371 | 0.001 |
NOTE.—μ-dif is the difference between TP-μ and Yule-μ, σ2-dif is the difference between TP-σ2 and Yule-σ2.
In the following, we ask how persistent this implicit bias is when some phylogenetic signal is present. To elucidate the influence of phylogenetic signals, we simulated sequence evolution using Seq-Gen (Rambaut and Grassly 1997) under a Jukes–Cantor model and a 6-taxon caterpillar tree (S61). Branch lengths were set to 0.1 substitutions per site. We generated 10,000 simulated alignments with a length of 10, 20, 50, and 100. Subsequently, we computed for each simulated alignment a tree by TP where the number of puzzling steps was set to one. Figure 1 illustrates the resulting distribution for all 105 topologies for alignments with ten sites only.
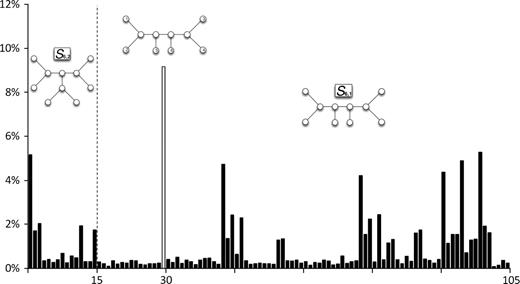
Number of times one of the 105 six-trees was selected with one puzzling step. The alignment has ten sites only.
It shows that the true topology T30 is found most often (9.2%) and that the bias of the Yule–Harding distribution is already diminished by a tiny amount of phylogenetic information. As more phylogenetic signal is added, the probability increases to select the true tree with TP (see table 4). Thus, the potential bias due to the implicit prior is diminished. As pointed out by one reviewer, this is possibly due to the correlation among all quartets. Thus, it is an open question if the Yule distribution is the limiting distribution for fewer and fewer data. If this holds true, the Yule–Harding distribution (corrected for tree shapes) may serve as the appropriate noninformative prior (Jaynes 2003) for use in Bayesian phylogenetics as pointed out by the second reviewer.
Recovery Rate of Tree Shapes in Percentage If Phylogenetic Information Is Added (measured in length of the alignment). The Last Column Shows the Frequency of Recovering the True Topology, a Representative of S61
| Alignment Length | S61 (%) | S62 (%) | True Topology (%) |
| 0 | 80.71 | 19.29 | 0.95 |
| 10 | 83.39 | 16.61 | 9.17 |
| 20 | 86.60 | 13.40 | 19.15 |
| 50 | 91.49 | 8.51 | 52.45 |
| 100 | 97.40 | 2.60 | 85.77 |
| Alignment Length | S61 (%) | S62 (%) | True Topology (%) |
| 0 | 80.71 | 19.29 | 0.95 |
| 10 | 83.39 | 16.61 | 9.17 |
| 20 | 86.60 | 13.40 | 19.15 |
| 50 | 91.49 | 8.51 | 52.45 |
| 100 | 97.40 | 2.60 | 85.77 |
Although shape bias, however, from different perspectives, has been reported occasionally in a supertree context (Wilkinson et al. 2005; Kupczok, unpublished data) not much is known about potential bias in the more conventional tree reconstruction framework. The TP algorithm allows such an analysis by assuming that quartet topologies are equally likely. Under this assumption, we observe that the distribution of reconstructed tree shapes converges to the well-known Yule–Harding distribution (Harding 1971, Dobson 1974). Although we cannot give a formal proof, the exact computation of the edge insertion probabilities for a taxon for up to eight taxa shows that the probability to insert the taxon at an inner edge quickly drops to zero.
On the other hand, we show that phylogenetic information reduces the influence of the implicit prior as one would expect. The theoretical analyses discussed here, however, are important if one studies the theoretical performance of tree reconstruction methods. When it comes to the accuracy of phylogenetic reconstruction, one has to ensure that the simulations are not supported by the Bayesian prior that may be explicitly or implicitly included in a reconstruction method. It will be interesting to elucidate if other tree inference approaches also show an implicit prior.
Method
We outline the basic principles of the TP algorithm (Strimmer and von Haeseler 1996). For n taxa, the so-called puzzling step in TP starts with a unique 3-tree and repeats the following procedure until the tree contains all taxa.
The core of TP takes a k-tree and inserts the next taxon x by evaluating the quartet trees with leaf set {t1,t2,t3,x}, where the ti are leaves in the k-tree. If the tree topology t1,t2||t3,x is given, then each edge on the path connecting t1 and t2 in the k-tree receives the penalty score 1. This procedure is repeated for all quartet trees and the penalty scores (0 or 1) are accumulated for each edge. Finally, x is inserted at the edge with minimal penalty score. If ties occur, then we pick randomly one of the corresponding edges. In a standard application of TP, this procedure is repeated for randomized input orders of the taxa and a consensus tree is computed from the collection of n-trees.
To reduce the computational complexity, we introduce a series of simplifications. First of all we note that the stepwise insertion of taxa in TP can be used to iteratively compute the exact probabilities for k-trees from (k − 1)-trees. Second, because we analyze all possible quartet tree combinations, it suffices to analyze the probability of the tree shapes.
Figure 2 shows how to derive a k-shape from the (k − 1)-shapes. If the kth taxon is inserted on an edge in a (k − 1)-shape, then this results in an uniquely defined k-shape. The probabilities of a k-shape could be calculated if the probabilities of the shapes, it could arise from are known by weighting them with the probabilities at the corresponding arrows. Using a branch and bound algorithm, we computed the probability that the kth taxon is inserted on each edge of a (k − 1)-shape. We note that the probabilities of tree shapes under the PDA model can be computed from the diagram in figure 2 by simply assuming that the probability to pick an edge is uniform, that is, for a k-shape. Hence, we computed the exact probabilities of tree shapes for up to nine taxa using random TP (see supplementary table S1, Supplementary Material online) and the PDA model.
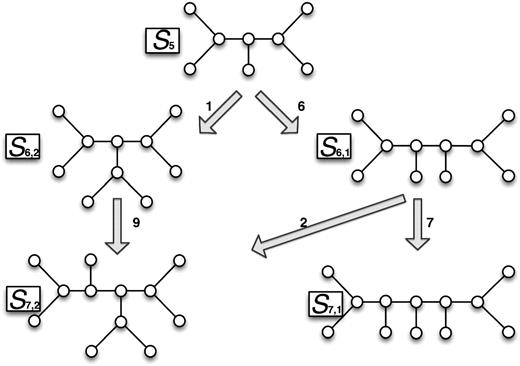
Tree shape generation principle. Starting with a 5-shape (S5), the two 6-shapes (S6,1 and S6,2) are generated by inserting the sixth taxon at an appropriate edge. From the two 6-shapes and the 7-shapes, S7,1 and S7,2 are created. The probabilities of the shapes depend on the insertion model. The number at the arrows indicate the number of edges that lead to the next larger tree shape.2
Financial support to A.v.H. from the Wiener Wissenschafts-, Forschungs-, and Technologiefonds is greatly appreciated. L.S.V. acknowledges financial support from the Vietnam National Foundation for Science and Technology Development. We would like to express our thanks to Anne Kupczok for critically reading the manuscript. Finally, we thank two anonymous reviewers for helpful comments and further insights in the topic.
References
Author notes
Associate editor: Sudhir Kumar
