


Abstract
Patterns of codon usage bias (CUB) convey useful information about the selection on synonymous codons induced by gene expression and contribute to an understanding of substitution patterns observed at synonymous sites. They can also be informative about the distinctive evolutionary properties of sex chromosomes such as genetic degeneration of the Y chromosome, dosage compensation, and hemizygosity of the X chromosome in males, which can affect the selection on codon usage. Here, we study CUB in Silene latifolia, a species of interest for studying the early stages of sex chromosome evolution. We have obtained a large expressed sequence tag data set containing more than 1,608 sequence fragments by 454 sequencing. Using three different methods, we conservatively define 21 preferred codons. Interestingly, the preferred codons in S. latifolia are almost identical to those in Arabidopsis thaliana, despite their long divergence time (we estimate average nonsynonymous site divergence to be 0.216, and synonymous sites are saturated). The agreement suggests that the nature of selection on codon usage has not changed significantly during the long evolutionary time separating the two species. As in many other organisms, the frequency of preferred codons is negatively correlated with protein length. For the 43 genes with both exon and intron sequences, we find a positive correlation between gene expression levels and GC content at third codon positions, but a strong negative correlation between expression and intron GC content, suggesting that the CUB we detect in S. latifolia is more likely to be due to natural selection than to mutational bias. Using polymorphism data, we detect evidence of ongoing natural selection on CUB, but we find little support for effects of biased gene conversion. An analysis of ten sex-linked genes reveals that the X chromosome has experienced significantly more unpreferred to preferred than preferred to unpreferred substitutions, suggesting that it may be evolving higher CUB. In contrast, numbers of substitutions between preferred and unpreferred codons are similar in both directions in the Y-linked genes, contrary to the expectation of genetic degeneration.
Introduction
Codon usage bias (CUB), the nonrandom use of synonymous codons, has been documented in a wide variety of organisms, including prokaryotes (Ikemura 1982; Sharp et al. 2005) and eukaryotes (Moriyama and Powell 1997; Chiapello et al. 1998; Duret and Mouchiroud 1999; Drummond and Wilke 2008). Two factors are involved in the maintenance of CUB: weak natural selection and mutational pressure (for review, see Hershberg and Petrov 2008). Natural selection for translational accuracy and/or efficiency during protein expression (Curran and Yarus 1989; Sorensen et al. 1989; Akashi 1994; Stoletzki and Eyre-Walker 2007) can promote nonrandom usage of codons. At the same time, mutational biases may exist and can affect codon usage, leading to different patterns of CUB between organisms or between different regions within genomes (Knight et al. 2001).
An example of between-species difference is the weaker selection intensity on CUB in Arabidopsis thaliana than in Drosophila melanogaster or Caenorhabditis elegans (Duret and Mouchiroud 1999; Wright et al. 2004). Within dioecious species, CUB is also expected to differ between the sex chromosome pair and between these chromosomes and the autosomes. If codon usage patterns are shaped by selection, a reduced efficacy of selection on the Y is predicted, caused by its lower effective population size (Ne) than on the X. This Ne difference is predicted because there are fewer Y chromosomes than X chromosomes in populations and because the absence of recombination across large regions of the Y allows hitch-hiking processes to occur, including selective sweeps (Rice 1987; Bachtrog et al. 2009), background selection (Charlesworth et al. 1993; Kaiser and Charlesworth 2009), and Muller’s ratchet (Gordo and Charlesworth 2001; Engelstädter 2008). These hitch-hiking processes reduce Y chromosome Ne and therefore reduce both neutral diversity and the efficacy of selection acting on Y-linked sequences (Bachtrog and Charlesworth 2002). In D. miranda, in which an autosome fused to the Y chromosome about 1–1.5 Ma (Bachtrog and Charlesworth 2002), there is an excess of fixations of synonymous mutations, creating unpreferred codons on the neo-Y (Bachtrog 2003) while selection is still acting to maintain the use of preferred codons on the X chromosome (Bartolomé et al. 2005; Bartolomé and Charlesworth 2006).
In addition, selection on codon usage could be stronger on X- versus Y-linked genes if Y-linked alleles are still present, but are partially or completely nonfunctional (degenerated), and have lower expression than their X-linked homologs. Alternatively, lower expression of Y- than X-linked alleles could occur if dosage compensation has evolved, expression of X-linked alleles in males is specifically elevated (for review, see Marin et al. 2000). Differences in CUB between the X and other chromosomes might also evolve because the hemizygosity of the X in males can allow selection against recessive or largely recessive deleterious sequence variants to act in males, whereas such variants in autosomal genes would be selected more rarely (Charlesworth et al. 1987; Singh et al. 2006). Note that with a 1:1 sex ratio, equal selection coefficients in both sexes, and codominance, the scaled selection coefficients are the same in the two sexes (i.e., 4NeAsA = 4Nexsx, where Nei and si stand for effective population sizes and effective selection coefficients for the autosomes and the X chromosome; Vicoso and Charlesworth 2009), alleviating the effects of hemizygosity. Nonetheless, recent studies in Drosophila and in Caenorhabditis have shown that selection on CUB indeed appears to be stronger on the X chromosome than on the other chromosomes and that recessivity of the unpreferred codons and hemizygosity may be important (Singh et al. 2006; Vicario et al. 2007; Zeng and Charlesworth 2010).
Here, we study CUB in the dioecious plant Silene latifolia, a species that is interesting for studying the early stages of sex chromosome evolution (Guttman and Charlesworth 1998; Filatov and Charlesworth 2002; Bergero et al. 2007). Its X and Y sex chromosomes are morphologically distinct and evolved after the species diverged from its most recent non-dioecious ancestor about 5–10 Ma (Desfeux et al. 1996; Guttman and Charlesworth 1998; Nicolas et al. 2005; Bergero et al. 2007). The only previous study of CUB in this species was based on a small data set consisting of 36 S. latifolia cDNA sequences (Filatov and Charlesworth 2002), which is probably too few to represent the genome as a whole or to give firm conclusions. Taking advantage of next generation sequencing, we have newly obtained a large set of S. latifolia coding sequences, including sex-linked and autosomal genes, so that we can now give a more detailed description of CUB in the species.
We used these sequences to infer codon bias patterns and tested whether there is evidence that selection affects codon usage in this species, and, if so, whether many genes, or just a few, are affected. We also tested whether the reduced recombination between the Y/X chromosome pair in S. latifolia has yet produced detectable effects on codon usage. If codon usage of genes on the Y chromosome changes as recombination is lost, this could affect synonymous site divergence, potentially affecting the use of such substitutions as a neutral standard in molecular evolutionary studies.
Materials and Methods
Data
Expressed sequence tag (EST) sequences were obtained by 454 sequencing of cDNAs from S. latifolia flower buds (Bergero R, Qiu S, Forrest A, Borthwick H, Charlesworth D, unpublished data). Sequence reads were assembled into contigs using 454’s Newbler assembler. cDNA contigs of at least 400 bp were translated into amino acid sequences and were then aligned against the A. thaliana proteome (Swarbreck et al. 2008) using the software FASTX, version 35.03 (Pearson et al. 1997). The reading frame of the cDNA sequence was found using the property of FASTX that, when searching for homologs, it inserts symbols into the translated sequence to indicate the numbers of gaps that must be inserted to obtain a reading frame that aligns with the reference sequence (in our case, A. thaliana). Because few gene sequences from S. latifolia have so far been published, the divergence between S. latifolia and A. thaliana was not previously known. Therefore, we arbitrarily chose a protein similarity threshold of 70% for assigning homologs, that is, for each cDNA sequence, we retained only the longest alignment with greater than 70% protein similarity (as defined in the software, which considers both identities and conservative replacements between the aligned sequences). Higher similarity thresholds did not change any of our conclusions (results not shown).
We further removed segments of poor alignment quality, which are common at both ends of the alignments, and all incomplete codons in the S. latifolia cDNA sequences (which are usually due to sequencing and/or assembling errors). Finally, gene fragments with less than 100 synonymous codons were excluded from our analyses because short sequences give poor estimates of codon usage (Novembre 2002). In total, we retained 1,608 genes for our analyses. We estimated nonsynonymous and synonymous divergence, denoted by Ka and Ks, for each aligned fragment, with the method of Goldman and Yang (1994) using the software package KaKs_Calculator (version 1.2; Zhang et al. 2006).
Identification of Major Codons and Preferred Codons in S. latifolia
To avoid potential methodological artifacts, we used two different methods to infer major/preferred codons. In the first approach, we used the computer program CodonW (http://codonw.sourceforge.net) to conduct correspondence analysis of relative synonymous codon usage (RSCU) of the sequences. RSCU is defined as the ratio of the observed frequency of a codon to the frequency expected if codon usage is uniform within a synonymous codon group (Sharp and Li 1987). Correspondence analysis is a multivariate statistical method that can generate axes that identify factors that affect differences in codon usage among different genes (Grantham et al. 1980; Chiapello et al. 1998). In our analysis, the genes were projected onto the principal axis, and we selected the most extreme 5% sets of genes from each end of the axis. Effective numbers of codons (Enc; Wright 1990) for these two sets of genes were calculated, and the set with the lower Enc was defined as the more biased. Relative codon frequencies in the high- versus low-bias classes (RSCUhigh bias/RSCUlow bias) were then calculated for each synonymous codon; a value greater than 1 means that this codon was found more frequently in the genes inferred to be highly biased than in the low-bias genes. Finally, major codons were identified by comparing codon frequencies between the two pools using a two-way χ2 contingency test implemented in codonW.
The goal of our second approach was to identify codons potentially under translational selection (preferred codons). To do this, we inferred the most highly expressed genes in our data set using two different methods. First, we analyzed the ribosomal genes, which are expected to be expressed at high levels in most cell types (Sharp et al. 2005; Heger and Ponting 2007). Our S. latifolia data set includes 52 genes whose most likely orthologous sequences in A. thaliana encode structural proteins for non-organelle ribosomes.
Second, we used genes highly expressed in another plant, A. thaliana, because there are currently no high-quality expression data in S. latifolia; this follows the similar approach in a recent study of CUB in ten eukaryotic genomes using the expression data of Saccharomyces cerevisiae as a reference (dos Reis and Wernisch 2009). A caveat of this approach is that patterns of gene expression may, of course, have diverged between S. latifolia and A. thaliana. However, a comparison of the results obtained by the three methods suggests that the overall expression patterns may be quite similar between the two species (see Results and Discussion). For each sequence fragment in our S. latifolia data set, we used its most likely A. thaliana ortholog to infer that gene’s expression level obtained by massively parallel signature sequencing (MPSS) data (Meyers et al. 2004). This database is based on quantitative estimates of the abundance of short sequence tags from mRNAs. For each gene, we obtained the expression data from five tissues (leaves, roots, flowers, siliques, and callus). For each tissue, a gene’s expression level was estimated by summing the number of all expressed sense strand tags that are either within the coding sequence of the annotated gene or within 500 bp downstream of the coding region (Wright et al. 2004). Only expressed tags matching single genes and present in more than one sequencing run were included. We defined the gene’s expression level as the sum of the above values over the five tissues. Finally, our second set of high-expression genes was defined as the 80 most highly expressed genes (5% of the total number of genes).
For both of the sets of putatively highly expressed genes just described, we compared their codon frequencies with those of other genes in our data and used two-way χ2 contingency tests to determine whether a codon occurs significantly more frequently in the highly expressed class.
Distinguishing Mutational Bias and Natural Selection
A correlation between CUB and expression could be due to natural selection or to expression-related mutational bias, a selectively neutral process (Beletskii and Bhagwat 1996). To distinguish between these possibilities, we used three tests. First, we estimated the correlations of expression level with both GC content at third codon positions (GC3) and intron GC content (GCi) using data from the 43 genes in our data set where both exonic and intronic sequences were available. Under mutational bias alone, the two correlations should be similar.
Our second method was to estimate selection in coding regions and introns using the method of Cutter and Charlesworth (2006), which uses polymorphism data to estimate the selective difference between two alternative variants at a site. In the coding regions, we treated preferred (P) and unpreferred (U) codons as the two alternative variants whose selection is estimated, whereas in the introns, we treated G/C and A/T as the two types. The intensity of selection is estimated as the quantity γ, which symbolizes 4Nes, where s is the selection coefficient against the deleterious variant. We used polymorphism data from ten autosomal genes and eight X-linked genes (the genes and references are listed in supplementary table S1, Supplementary Material online). Y-linked genes were not included in this test because they have few segregating sites (the mean silent site diversity in seven Y-linked genes was 0.14%; Qiu et al. 2010).
Previous studies have found significant negative correlations between gene length and the frequency of preferred or optimal codons (Fop; Ikemura 1985) in many organisms (Duret and Mouchiroud 1999; Sharp et al. 2005; reviewed in Drummond and Wilke 2009; Zeng and Charlesworth 2009). In our third approach, we therefore tested whether genes' CUB is related to their protein length, even within sets of genes with similar expression level. We inferred protein lengths of the S. latifolia genes from the homologous A. thaliana sequences identified as described above. We divided the genes into three equal-sized groups with respect to protein length: short (<294 amino acids), intermediate (294–460 amino acids), and long (>460 amino acids). Then, we further classified each protein length group into three classes, high, moderate, and low based on the expression levels in A. thaliana. We calculated the average Fop for each of the nine classes of genes and the 95% confidence intervals. Genes in our S. latifolia EST set that had no tag detected in the MPSS database were excluded from this analysis.
Codon Usage in Sex-Linked Genes
We analyzed ten S. latifolia sex-linked genes from which both coding sequences and suitable outgroup sequences were available. Nine genes have previously been studied (see supplementary table S1, Supplementary Material online), and sex linkage was recently established for an additional gene, SlCSP41A–XY (Bergero R, Qiu S, Forrest A, Borthwick H, Charlesworth D, unpublished data). The X and Y sequences for SlCSP41A–XY as well as the orthologuous sequence from S. vulgaris (see below) were submitted to GenBank under accession numbers HQ129855–HQ129857. To increase statistical power, the genes were concatenated, and GCi, GC3, and the overall GC content (GC) were computed for the concatenated sequence.
In addition, we also estimated the equilibrium values of GCi, GC3, and GC (denoted as GCi*, GC3*, and GC*, respectively) as follows. We first reconstructed the ancestral sequence for the X and Y by two methods: 1) a parsimony method (Fitch 1971) using the DNAPARS program implemented in the PHYLIP package (Felsenstein 1989) and 2) a maximum likelihood method using the BASEML program implemented in the PAML package (Yang 2007). The orthologous sequences of S. vulgaris, which is a closely related species that does not have sex chromosomes (Marsden-Jones and Turrill 1957; Charlesworth and Laporte 1998), were used as outgroup sequences for the reconstructions. For the parsimony method, we used only sites at which an ancestral state could be inferred unambiguously. For the maximum likelihood method, we reconstructed the ancestral sequence using a general time reversible model (Tavaré 1986) for the intron regions and a nucleotide substitution model, which treats the three codon positions differently (Yang 1996) for the protein coding regions. In both models, we assumed that rates can vary freely among the three branches. S.latifolia and S. vulgaris are closely related species, with an average synonymous divergence of 12% (Filatov and Charlesworth 2002; Qiu et al. 2010). Previous studies have shown that, for this level of divergence, the parsimony method should produce reliable results (Yang et al. 1995; Kern and Begun 2005), and both methods produce virtually identical results (see below).
Then, we counted the numbers of the two types of substitutions, NAT→GC and NGC→AT, from the reconstructed ancestral sequences to the X and to the Y. Finally, we computed GCi*, GC3*, and GC* using the formula: u/(u + v), where u is defined as NAT→GC divided by the number of A/T sites in the ancestral sequence and v is NGC→AT divided by the number of G/C sites in the ancestral sequence (Sueoka 1962; Haudry et al. 2008). Fop values for the concatenated X and Y sequences were also estimated. As in Haudry et al. (2008), we also estimated the stationary Fop value, Fop*, up/(up + uu), where up is the substitution rate from unpreferred to preferred codons and uu the reverse rate. The up and uu were estimated by a method similar to that used for estimating the substitution rates between GC and AT (see above). To further investigate whether codon usage is different between sex-linked and autosomal genes, we also calculated GC3, GC, and Fop for 58 autosomal genes, which have been mapped to S. latifolia autosomal linkage groups (Bergero R, Qiu S, Forrest A, Borthwick H, Charlesworth D, unpublished data).
Results and Discussion
Codon Usage Bias in S. latifolia
Correspondence analysis was performed on the RSCU value of each codon of each of the 1,608 genes. The first two axes explain low fractions of the total variation (7.8% and 6.8%, respectively), and the other axes account for at most 4.6% of the total variation. However, there is evidence that the expression levels affect the positions of the genes on the first axis. For example, all 52 ribosomal genes, which are probably highly expressed (see Materials and Methods), cluster toward one extreme of axis 1 (supplementary fig. S1A, Supplementary Material online); most of them also have negative values on axis 2. The expression level inferred by the expression data in A. thaliana (see Materials and Methods) is also strongly positively correlated with axis 1 (Pearson’s r = +0.35, P < 2.2 × 10⁻¹⁶) but not with axis 2 (Pearson’s r = +0.035, P = 0.18). Of the 80 putatively highly expressed genes, 74 have positive values on axis 1. For the six genes having negative values, they are all very close to zero (supplementary fig. S1B, Supplementary Material online). These observations suggest that the trend represented by axis 1 is most likely caused by differences in expression between the genes.
To be conservative in identifying preferred codons, we used three different methods. We defined a codon as putatively preferred if the χ2 test detected a difference at a significance level of 1% in the frequency of appearance between two classes of genes that are expected to differ 1) if some amino acids have major codons (as identified by the correspondence analysis) or 2) if some codons are selectively preferred (as identified by the expression based analysis detailed in the Materials and Methods). The results are presented in table 1.
Codon Preferences Inferred in Silene latifolia.
| Amino Acids | Codons | RF(CA)a | RF(RP)b | RF(HE)c |
| Ala | GCA | 0.38 | 0.60 | 0.76 |
| GCCd | 2.95* | 1.15 | 1.25* | |
| GCG | 0.52 | 0.56 | 0.67 | |
| GCT | 1.21* | 1.28* | 1.11* | |
| Arg | AGA | 0.56 | 0.75 | 0.97 |
| AGG | 1.52* | 1.30* | 1.23* | |
| CGA | 0.40 | 0.53 | 0.49 | |
| CGC | 2.67* | 1.02 | 0.82 | |
| CGG | 0.26 | 0.35 | 0.49 | |
| CGT | 1.99* | 1.53* | 1.37* | |
| Asn | AAC | 2.49* | 1.36* | 1.36* |
| AAT | 0.43 | 0.73 | 0.73 | |
| Asp | GAC | 2.33* | 1.07 | 1.35* |
| GAT | 0.60 | 0.96 | 0.82 | |
| Cys | TGC | 1.58* | 1.48* | 1.03 |
| TGT | 0.71 | 0.63 | 0.97 | |
| Gln | CAA | 0.65 | 0.81 | 0.92 |
| CAG | 1.80* | 1.24* | 1.10 | |
| Glu | GAA | 0.48 | 0.77 | 0.81 |
| GAG | 1.88* | 1.23* | 1.21* | |
| Gly | GGA | 0.82 | 0.86 | 0.95 |
| GGC | 1.11 | 0.97 | 0.90 | |
| GGG | 0.38 | 0.58 | 0.72 | |
| GGT | 1.59* | 1.36* | 1.23* | |
| His | CAC | 2.98* | 1.51* | 1.46* |
| CAT | 0.39 | 0.67 | 0.70 | |
| Ile | ATA | 0.17 | 0.29 | 0.43 |
| ATC | 2.70* | 1.60* | 1.39* | |
| ATT | 0.89 | 0.97 | 1.02 | |
| Leu | CTA | 0.59 | 0.63 | 0.81 |
| CTC | 2.94* | 1.21 | 1.20* | |
| CTG | 0.83 | 1.06 | 0.86 | |
| CTT | 1.24* | 1.24* | 1.07 | |
| TTA | 0.13 | 0.32 | 0.54 | |
| TTG | 1.07 | 1.08 | 1.18* | |
| Lys | AAA | 0.32 | 0.43 | 0.62 |
| AAG | 1.96* | 1.44* | 1.29* | |
| Phe | TTC | 2.02* | 1.29* | 1.25* |
| TTT | 0.52 | 0.76 | 0.80 | |
| Pro | CCA | 0.96 | 1.19 | 1.12 |
| CCC | 2.92* | 1.38* | 1.40* | |
| CCG | 0.60 | 0.54 | 0.71 | |
| CCT | 0.71 | 0.83 | 0.83 | |
| Ser | AGC | 1.41* | 1.01 | 1.23* |
| AGT | 0.52 | 0.85 | 0.86 | |
| TCA | 0.66 | 1.07 | 0.93 | |
| TCC | 2.93* | 0.89 | 1.22* | |
| TCG | 0.42 | 0.49 | 0.84 | |
| TCT | 1.11 | 1.25* | 0.96 | |
| Thr | ACA | 0.42 | 0.68 | 0.72 |
| ACC | 3.11* | 1.39* | 1.54* | |
| ACG | 0.22 | 0.46 | 0.62 | |
| ACT | 0.99 | 1.13 | 0.97 | |
| Tyr | TAC | 2.30* | 1.30* | 1.35* |
| TAT | 0.36 | 0.74 | 0.69 | |
| Val | GTA | 0.27 | 0.56 | 0.64 |
| GTC | 3.21* | 1.19 | 1.22* | |
| GTG | 0.74 | 0.91 | 0.95 | |
| GTT | 0.91 | 1.12 | 1.05 |
Relative codon frequencies in 5% high-biased versus 5% low-biased gene classes in correspondence analysis.
Relative codon frequencies in 52 putative ribosomal protein genes versus the rest of the data set.
Relative codon frequencies in the 5% genes with highest levels of expression versus the rest of the data set.
Putatively preferred codons supported by multiple methods are underlined.
Codons have significant increases in relative frequency in highly biased/expressed genes, as detected by a χ2 test (P < 0.01) (see Materials and Methods).
Among the 23 major codons identified by correspondence analysis, 22 were also more frequent in the set of highly expressed genes inferred by the MPSS database, relative to the rest of the genes; the difference is significant in 19 of the comparisons. Only one codon, identified as a major codon by correspondence analysis (CGC) appears to be used less frequently in the highly expressed genes, but the difference is nonsignificant. Conversely, the analysis of expression levels found significant differences for 20 codons, and only one of them, TTG, was not identified by correspondence analysis, although this analysis did find increased usage of this codon in highly biased genes (table 1). Finally, using the set of ribosomal genes, we found 17 preferred codons, 16 of which were also among those found by the correspondence analysis, whereas only one codon (TCT) was not identified by correspondence analysis, but again this codon occurred more frequently in the highly biased genes identified by correspondence analysis.
Thus, all three methods seem to identify similar sets of putatively preferred codons in S. latifolia. We therefore defined a conservative set of preferred codons for this species as those 1) significantly preferred by at least two methods and 2) found by the third method to show the same trend. This defined 21 preferred codons (underlined in table 1), which we used for the following analyses.
Among the 21 preferred codons, most (13) are C-ending; we inferred four codons ending in G, four ending in T, and none ending with A. The four codons that are defined as preferred codons in our species (TTC, TAC, ATC, and AAC) are also consistent with the suggestion of Ikemura (1985) that codons of the (A/U)-(A/U)-pyrimidine type, whose first and second positions have weak interactions with their anticodons, have an optimal interaction strength between the codon and anticodon if the third letter of the codon is C.
Despite the large estimated time since the common ancestor of the Brassicaceae and Caryophyllaceae, the 21 preferred codons identified here were previously found to be preferred codons in A. thaliana (Chiapello et al. 1998; Wright et al. 2004; Morton and Wright 2007). The average Ka value for S. latifolia and A. thaliana obtained from our 1,608 gene fragments is 0.216 ± 0.136 (average Ks is 3.03 ± 0.759, and all the gene fragments except one have Ks > 1). These values are underestimate of divergence because the gene fragments used were for genes with high similarity between the two species, but they are in line with the estimate that these two species split more than 100 Ma (Bell et al. 2010). The conservation of preferred codons suggests that the mechanisms underlying CUB may have remained largely conserved across this large evolutionary time. Similar sets of preferred codons were also found in five Populus species (Ingvarsson 2008) and two other dicotyledon species Nicotiana tabacum and Pisum sativum (Kawabe and Miyashita 2003). Thus, it seems that the set of preferred codons is well conserved between diverse dicotyledonous plants.
As expected on the hypothesis of selection, there is a strong overall correlation between Fop (calculated for each gene as explained in the Materials and Methods) and the estimated expression level (Pearson’s r = 0.336, P < 2.2 × 10⁻¹⁶; fig. 1). However, most genes have similar codon bias, and only the genes with the very highest expression levels show a strong increase in Fop. This is consistent with results from A. thaliana suggesting that codon bias is restricted to genes in the highest expression classes (Wright et al. 2004).
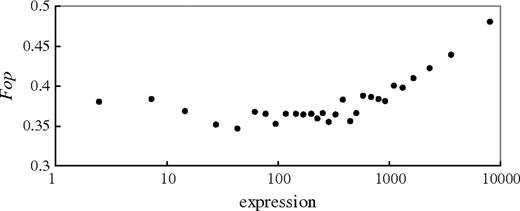
Relationship between gene expression and codon bias in Silene latifolia. Genes were divided into 29 equal-sized classes according to their expression levels estimated from the Arabidopsis thaliana MPSS database (there are 50 genes in each class). The average values of expression for the classes are shown on the x axis.
Tests for Mutational Bias and for Selection
Since most of the preferred codons identified end with G or C (table 1), there is a positive correlation between GC content in third codon positions (GC3) and expression level (Pearson’s r = 0.228, P < 2.2 × 10⁻¹⁶). However, this observation does not imply the operation of natural selection on codon usage because it could be due to expression-related mutational bias. For example, transcription-induced mutation occurs in Escherichia coli (Beletskii and Bhagwat 1996, 2001), yeast (Lippert et al. 2004), and probably also in A. thaliana (DeRose-Wilson and Gaut 2007; Morton and Wright 2007). One way to distinguish the two effects is to test whether gene expression shows a relationship with intron GC content (GCi) similar to that with GC3, which would be expected if there is no selection. Using 43 genes with both exon and intron data currently available, we no longer find a significant correlation between GC3 and expression (Pearson’s r = 0.151, P = 0.33), probably because of the small number of genes that could be analyzed, although there is a weak relationship. In contrast, GCi decreased significantly with expression (Pearson’s r = −0.4, P = 0.008). There is also a (nonsignificant) negative correlation between GC3 and GCi (Pearson’s r = −0.287, P = 0.06), similar to the results previously found in two model organisms A. thaliana (Marais et al. 2004) and C. elegans (Duret and Mouchiroud 1999). The significant negative correlation between GCi and expression suggests an expression-related mutation pressure driving the base composition in the direction opposite to that of selection; if confirmed, this would suggest that selection, rather than mutational bias, is probably the major cause of CUB.
To further examine the possibility of natural selection, we estimated the intensity of selection on synonymous codons as well as introns, as measured by the parameter γ = 4Nes. The method we used (Cutter and Charlesworth 2006) is based on polymorphism data and therefore reflects ongoing selection acting on genes, rather than long-term selection. This analysis suggests a significant selective difference between preferred and unpreferred codons in the exons of the X-linked genes (γ = 1.033, P = 0.006) and possibly also the autosomal genes (γ = 0.573, P = 0.07). In contrast, it does not detect selection in the introns of either the autosomal genes (γ = 0.002, P = 0.992) or the X-linked genes (γ = 0.006, P = 0.972). This result further supports the view that selection on codon usage is still active, or was acting recently in S. latifolia, and that biased gene conversion is rather weak in our species.
Finally, we studied estimated Fop values in relation to protein lengths. Fop has been shown to be strongly negatively correlated with the length of the protein encoded in several eukaryotes (Duret and Mouchiroud 1999; Zeng and Charlesworth 2009) and prokaryotes (Drummond and Wilke 2008; Charlesworth B and Charlesworth D 2010). To investigate whether the same pattern also exists in S. latifolia, we inferred the protein lengths of our S. latifolia genes from their inferred A. thaliana orthologs. We too found a significant negative correlation between Fop and protein length (Pearson’s r = −0.124, P = 5.89 × 10⁻⁷). However, because Fop is positively correlated with expression, to control for the effects of different levels of expression between genes, we divided the genes into nine classes (see Materials and Methods). Because there is so far no evidence that protein lengths correlate with local recombination rates, or that genes encoding proteins of different lengths will be subject to different mutational biases, correlations would not be expected within expression classes in the absence of selection. However, we found a clear decrease of Fop with protein length in each expression class, supporting the action of selection (fig. 2); a partial correlation analysis, controlling for the difference in expression in all the genes, gives a similar conclusion (partial r = −0.1, P = 1.17 × 10⁻⁴). The Fop values for genes in the low- and moderate-expression classes are generally similar within each length group, and the 95% confidence intervals overlap considerably (fig. 2). However, the Fop value of the high-expression class is always much higher than that of the other classes, which is consistent with our conclusion above that only the most highly expressed genes have CUB caused by selection.
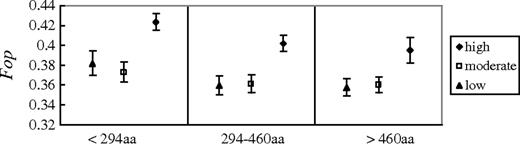
Relationship between Fop, expression level, and protein length in Silene latifolia. Average Fop values were calculated for different groups of gene with different expression levels (high, intermediate, and low) and different protein lengths. Error bars indicate the 95% confidence intervals.
Codon Usage on the Sex-Linked Genes
If codon usage is at equilibrium on the sex chromosomes, the numbers of U→P and P→U substitutions should not differ significantly from equality in the X and Y sequences. To test this hypothesis, we reconstructed the ancestral sequences using both a maximum parsimony method and a maximum likelihood method. Because both methods produced virtually identical results (see tables 2 and 3), we used the results obtained by the parsimony method in the following discussions. Table 2 shows that there is a weakly significant excess of U→P over P→U substitutions in the X-linked genes (P = 0.036, χ2 test against a 1:1 null hypothesis), contrary to the equilibrium prediction; no such effect was found for the homologous Y-linked genes (P = 0.31). Fop for the X is slightly, but significantly, higher than that for the Y, as suggested by a Wilcoxon signed rank test (P = 0.016). Furthermore, the expected equilibrium value, Fop*, is marginally significantly higher for the X than for the Y (P = 0.025; table 2). We also found slightly, but nonsignificantly, more nonsynonymous substitutions on the Y-linked genes than their X homologs (43 vs. 29, P = 0.099; table 2). These results indicate that the X chromosome may be evolving toward a higher codon bias.
Comparison of Fop and Fop* between X-Linked, Y-Linked, and Autosomal (A) Genes. The P Values Are for the Comparison between the X- and Y-Linked Sequences.
| Type of Gene | Nnsa | Fop | P Valuec | Fop* | U→Pb | P→Ub | P Valued |
| X | 29 (31) | 0.336 | 0.016 | 0.474 (0.474) | 33 (33) | 18 (18) | 0.025 (0.031) |
| Y | 43 (48) | 0.327 | 0.275 (0.282) | 27 (28) | 35 (35) | ||
| A | 0.356 |
| Type of Gene | Nnsa | Fop | P Valuec | Fop* | U→Pb | P→Ub | P Valued |
| X | 29 (31) | 0.336 | 0.016 | 0.474 (0.474) | 33 (33) | 18 (18) | 0.025 (0.031) |
| Y | 43 (48) | 0.327 | 0.275 (0.282) | 27 (28) | 35 (35) | ||
| A | 0.356 |
NOTE.—The values outside parentheses are based on a parsimony ancestral reconstruction method, whereas those inside parentheses are based on a maximal likelihood ancestral reconstruction method.
Numbers of nonsynonymous substitutions from the reconstructed ancestral sequences to the X and to the Y.
Numbers of unpreferred→preferred and preferred→unpreferred codon substitutions from the reconstructed ancestral sequences to the X and to the Y.
A one-sided Wilcoxon signed rank test against the null hypothesis that Fop is lower in the X sequences than in the Y sequences.
A χ2 contingency table test comparing the numbers of U→P and P→U substitutions in the concatenated X and Y sequences.
Comparison of GC and GC* at Different Positions between X-Linked, Y-Linked and Autosomal (A) Genes. The P values Are for the Comparisons between the X- and Y-Linked Sequences.
| Type of Gene | GCi | Pa Value | GCi* | ATib ↓ GCi | GCib ↓ ATi | Pc Value | GC3 | Pa Value | GC3* | AT3b ↓ GC3 | GC3b ↓ AT3 | Pc Value | GC | Pa Value | GC* | ATb ↓ GC | GCb ↓ AT | Pc Value |
| X | 0.354 | 0.227 | 0.401 (0.387) | 97 (99) | 78 (86) | 0.166 (0.241) | 0.368 | 0.016 | 0.467 (0.458) | 40 (40) | 26 (27) | 0.098 (0.139) | 0.442 | 0.082 | 0.529 (0.521) | 40 (40) | 28 (29) | 0.115 (0.16) |
| Y | 0.350 | 0.336 (0.335) | 113 (123) | 120 (134) | 0.361 | 0.337 (0.342) | 41 (42) | 46 (46) | 0.439 | 0.404 (0.41) | 44 (45) | 51 (51) | ||||||
| A | 0.353 | 0.378 | 0.441 |
NOTE.—The values outside parentheses are based on a parsimony ancestral reconstruction method, whereas those inside parentheses are based on a maximal likelihood ancestral reconstruction method.
One-sided Wilcoxon signed rank tests against the null hypothesis that the value of the measure of GC content of interest is smaller on the X than on the Y.
Numbers of AT→GC and GC→AT substitutions in the intron, third codon positions and all coding region, from the reconstructed ancestral sequences to the X and to the Y.
χ2 contingency table tests comparing the numbers of AT→GC and GC→AT substitutions in the different positions in the concatenated X and Y sequences.
In all codon positions, the X sequences tend to have slightly higher GC content than the Y sequences (table 3); this difference is in the predicted direction if recombination leads to higher GC content (Marais and Galtier 2003; Nam and Ellegren 2008). Using Wilcoxon signed rank tests, the difference is marginally significant for GC3 and the overall GC content in coding regions (Ps = 0.016 and 0.08, respectively) but not for GCi (P = 0.227). Compared with the Y, the X-linked sequences yield a higher predicted equilibrium GC content for all codon positions, although none of the differences is significant (table 3).
Although some of these analyses do not yield significant P values, and more data are needed, all the results are consistent with more effective selection on codon usage in X-linked than Y-linked sequences. Interestingly, it seems that the difference is mainly due to ongoing positive selection acting on the X in S. latifolia, rather than to weaker selection on the Y. As shown above, the polymorphism data also suggest that the selection coefficient on codon usage on the X-linked genes is twice as high as that for the autosomal genes; however, the difference between the two is also not significant (P = 0.36). This is nonetheless consistent with the observation that the X chromosome has a slightly more biased usage of codons than the other chromosomes in many species of Drosophila (Vicario et al. 2007; Zeng and Charlesworth 2010). Two possibilities have been proposed: hemizygosity of the X in males and dosage compensation (see Introduction). The S. latifolia X-linked genes may not be hemizygous in males because all the genes studied here are pairs of X and Y homologs, in which all the Y-linked alleles appear to be intact and functional (see references in supplementary table S1, Supplementary Material online), although the expression levels of the few Y-linked genes for which estimates exist are considerably lower than those for their X-linked counterparts (Marais et al. 2008). However, it is not yet certain whether the expression differences represent reduced Y-linked expression because of functional degeneration (which might lead to relaxed selection on codon usage in the Y-linked alleles, and also perhaps to more effective selection on the X-linked alleles as these genes approach hemizygosity in males) or dosage compensation through elevated X-linked expression in males (and possibly also in females, as a pleiotropic consequence; reviewed by Cline and Meyer 1996; Gupta et al. 2006; Nguyen and Disteche 2006).
We therefore compared the values of Fop and GC content for the 58 genes that have been mapped to autosomal locations (Bergero R, Qiu S, Forrest A, Borthwick H, Charlesworth D, unpublished data) with the X-linked results but found no significant difference by a Mann–Whitney test. Similarly, in D. pseudoobscura, in which an autosome was fused to the X ∼13 to 22 Ma, forming a neo-X/Y pair (Russo et al. 1995; Tamura et al. 2004), the CUB of genes in the formerly autosomal arm is indistinguishable from that of genes in other autosomal arms (Vicario et al. 2007). The lack of a detectable difference between the S. latifolia X-linked and autosomal genes is therefore probably because codon usage evolves slowly, and a long time is needed.
Previous analyses showed that S. latifolia Y-linked genes may be undergoing genetic degeneration, as they show slightly, but significantly faster protein evolution, lower expression levels, and 20- to 30-fold lower diversity than their X homologs (Filatov et al. 2001; Ironside and Filatov 2005; Laporte et al. 2005; Filatov 2008; Marais et al. 2008; Qiu et al. 2010). We might thus also expect an accumulation of unpreferred codons in genes located in the nonrecombining region of the Y, as in D. miranda (see Introduction). However, we found no clear excess of deleterious substitutions (P→U) on the Y for the genes studied (table 2). Possibly Y degeneration is only in a very early stage, and there has not been enough time for deleterious mutations to accumulate and a clear picture to be seen. This might seem to be contradictory to the findings of changed codon usage in genes on the D. miranda neo-Y chromosome. However, the event that created the D. miranda neo-Y caused an entire autosomal arm to become confined to males and stop recombining, whereas the situation in our study plant was probably different, in that only a region of the Y ceased recombination at any time (Bergero et al. 2007); there were thus probably fewer genes subject to selection that could drive hitch-hiking processes and lower the Y effective population size and reduce the efficacy of selection. Changes in the S. latifolia Y might therefore occur over a much longer time scale.
Finally, we also plotted the expression estimates for individual X-linked genes against their GC3, GCi, and Fop values (fig. 3). Our analysis excluded the SlX9 gene, with less than 60 codons, and SlX1 because no expression of its A. thaliana homolog was detected. Even in this reduced set of genes, expression still correlates positively and strongly with GC3 (Pearson’s r = 0.91, P = 0.002) and Fop (Pearson’s r = 0.726, P = 0.041) but negatively with GCi (Pearson’s r = −0.15, P = 0.72). This is despite the fact that only one gene, DD44X, falls into the high-expression category (it also has considerably higher GC3 and Fop values than the other X-linked genes, which all have very similar GC3 and Fop values; see fig. 3). If our conclusion above is correct that only genes with extremely high-expression levels experience selection on codon usage, it is not surprising that comparisons between chromosomes fail to detect differences because most genes will not be in the category that is undergoing selection. Therefore, many more sex-linked genes will be needed to test this possibility further.
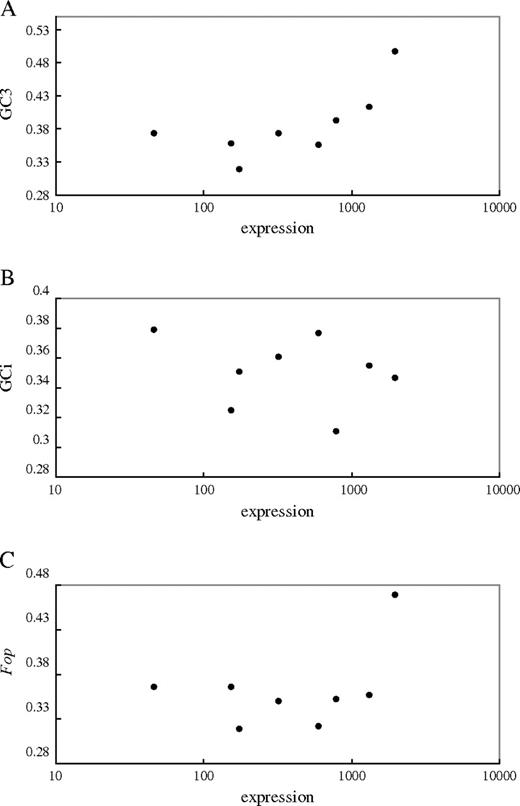
Plots of gene expression against (A) GC3, (B) GCi, and (C) Fop for eight X-linked genes in Silene latifolia.
We are grateful to Paul Sharp and Laura Emery for help with the correspondence analysis and to N. Takebayashi and two anonymous reviewers, whose comments improved the quality of this work. S.Q. was supported by the grants from NSFC (30730008, 40976081), the 973 program (2007CB815701), the National S&T Major Project of China (2009ZX08010-017B), and the Chang Hung-Ta Science Foundation of Sun Yat-Sen University. R.B. was supported by a grant from the Biotechnology and Biological Sciences Research Council of the United Kingdom, and K.Z. was supported by a Biomedical Personal Research Fellowship given by the Royal Society of Edinburgh and the Caledonian Research Foundation. This work has made use of the resources provided by the Edinburgh Compute and Data Facility (http://www.ecdf.ed.ac.uk/), which is partially supported by the e-Science Data, Information and Knowledge Transformation initiative (http://www.edikt.org.uk).
References
Author notes
Associate editor: Naoki Takebayashi
