


Abstract
Patterns of synonymous codon usage vary between organisms and are controlled by neutral processes (such as drift and mutation) as well as by selection. Here we show that an additional neutral process, GC-biased gene conversion (gBGC), plays a part in shaping patterns of both synonymous codon usage and amino acid composition in a manner dependent upon the local recombination rate. We obtain estimates of the strength of gBGC acting on synonymous sites in five species of yeast, which we find to be a much weaker force than selection. We use this to correct estimates of the strength of selection on codon usage bias, which are normally confounded by the action of gBGC. Our estimate of the rate of gBGC agrees well with an experimentally determined value obtained from Saccharomyces cerevisiae. We also find that, contrary to expectation, codon usage bias is highest in areas of intermediate levels of recombination for GC-ending optimal codons. Possible reasons for this are discussed.
Introduction
Patterns of biased codon usage are thought to be jointly controlled by mutation, selection, and drift (Li 1987; Bulmer 1991; Hershberg and Petrov 2008). Differences in mutational bias or effective population size (Ne) can thus affect patterns of codon usage, because the effectiveness of selection on alternative synonymous codons is determined by the product of Ne and the selective advantage (s) of a variant coding for an optimal codon over its alternatives at the same nucleotide site (Bulmer 1991; Akashi 1994, 1997). This selective advantage is typically very small (s ≈ 10−6), so that a large effective population size is required for selection to be effective relative to genetic drift (Hershberg and Petrov 2008; dos Reis and Wernisch 2009). Differences in Ne will thus be associated with difference in the effectiveness of selection on codon usage for a given selection regime. Drosophila miranda provides an example of how reduced Ne is associated with an excess of fixations of unpreferred codons compared with preferred codons (Bartolome and Charlesworth 2006; Bachtrog 2007).
In the case of a largely inbreeding/selfing species, such as yeast (here a term collectively applied to species of the Saccharomyces sensu stricto group) (Fischer et al. 2000), a low frequency of outcrossing also reduces Ne (and hence the efficacy of selection) as a function of the inbreeding coefficient, F, because Ne is reduced by a factor of 1/(1 + F) in the presence of inbreeding (Pollak 1987). In yeast, F is extremely high, for example, for Saccharomyces paradoxus, F is estimated to be approximately 0.95 (Johnson et al. 2004). In addition, the efficacy of recombination is reduced genome-wide by a factor of (1 − F) in inbreeders due to their low heterozygosity (Nordborg 1997), which is expected to lead to larger Hill–Robertson effects (Hill and Robertson 1966; Felsenstein 1974; Charlesworth et al. 2010) than in outbreeding species, further reducing Ne.
Mutational biases can also affect patterns of codon usage (Li 1987; Bulmer 1991). Mutation accumulation experiments using asexually dividing S. cerevisiae have shown that the mutational process associated with mitotic division is AT biased, with a 2.9-fold bias toward GC > AT substitutions (Lynch et al. 2008). At equilibrium under mutation and drift alone (Bulmer 1991), this would lead to a GC content of 1/3.9 = 0.26, whereas S. cerevisiae has a present-day mean GC content of approximately 40% in both coding regions and genome-wide, and GC3s, defined as the GC content at degenerate third position sites, is equal to 38% (Sharp and Lloyd 1993).
Furthermore, the process of GC-biased gene conversion (gBGC) can also alter base composition. During meiosis, gene conversion events can happen at sites where recombinational exchanges occur. At a site that is heterozygous for AT versus GC, gBGC can act to convert the AT allele to the GC allele, leading to an excess of the GC allele in meiotic products (Marais 2003). This process formally resembles directional selection (Gutz and Leslie 1976; Nagylaki 1983), although it can potentially be distinguished from selection by the fact that it does not induce a hitchhiking effect on linked sites (Galtier and Duret 2007).
Because mutational bias and gBGC appear to act in opposite directions in yeast, changes in the intensity of either process can lead to alterations in genome-wide nucleotide composition. The effectiveness of gBGC as an evolutionary force is dependent upon both Ne and the rate of recombination at any given site (Spencer et al. 2006; Duret and Arndt 2008). Because it occurs only in heterozygotes, its efficacy is also reduced by a factor of (1 − F) in inbreeding populations, in addition to the effect of reduced effective size mentioned above (Marais et al. 2004). A decrease in Ne due to a population size reduction or a prolonged increase in selfing or other form of inbreeding can thus lead to changes in base composition toward a higher equilibrium level of AT due to the decreased effectiveness of gBGC (Smith et al. 2002; Marais et al. 2004; Haudry et al. 2008). Equally, alterations in the recombination rate can alter the frequency of gBGC events and hence nucleotide composition (Galtier and Duret 2007). Although much of the evidence for the operation of gBGC has come from comparative genomics and population genomics studies, a recent study has demonstrated the occurrence of gBGC events in S. cerevisiae when polymorphic strains were crossed and their meiotic products genotyped (Mancera et al. 2008).
The action of gBGC or mutational bias can confound the identification of preferred or optimal codons (Sharp et al. 1993; Marais et al. 2001; Novembre 2002). Some of the most effective methods for establishing the identity of preferred codons are those that use gene expression data, such as relative synonymous codon usage (RSCU) analysis (Duret and Mouchiroud 1999; Cutter et al. 2006). For this method, sets of highly and weakly expressed genes (regardless of local base composition) are used to identify codons that are significantly overrepresented in the class of highly expressed genes. The extent of codon usage bias for a gene is represented by the frequency of degenerate codons that are identified as optimal—Fop (Ikemura 1981). In contrast, other measures such as effective number of codons (also known as Nc) are more susceptible to confounding by mutational biases (Novembre 2002).
Although there have been many studies of codon usage in S. cerevisiae (Sharp et al. 1988; dos Reis et al. 2004; dos Reis and Wernisch 2009), little is known about the extent of codon usage bias in closely related species. The species of the sensu stricto group of Saccharomyces yeast, which includes S. paradoxus, S. mikatae, S. kudriavzevii, and S. bayanus, differ in their geographical distribution and environmental niches (see Greig 2007; Sampaio and Goncalves 2008; Liti et al. 2009). Because whole-genome sequences and population genetic data for some species (Tsai et al. 2008; Liti et al. 2009) are now available, these are ideal organisms for studying how the composition of the genome may be altered by habitat and life cycle.
In this study, we explore how codon usage bias and base composition varies between species within the sensu stricto group of Saccharomyces yeasts and whether there is evidence for gBGC having affected patterns of codon usage. We report both differences in nucleotide composition and the strength of selection for biased codon usage across the Saccharomyces sensu stricto group in a way that depends upon the rate of recombination. We also present evidence that patterns of amino acid substitutions have altered in a way that depends on recombination rate, in a manner consistent with the action of gBGC. We introduce a new method for estimating the strength of gBGC and compare the results with the direct estimate of Mancera et al. (2008). We also examine the extent to which Hill–Robertson effects may have caused the relations between recombination rate and codon usage.
Materials and Methods
Ortholog Identification
Comparisons were made between a full list of open reading frames (ORFs) from S. cerevisiae and lists of ORFs for each of the sequenced species S. paradoxus, S. mikatae, S. kudriavezzi, and S. bayanus obtained from the annotated lists of ORFs previously published (Cliften 2003; Kellis et al. 2003) in order to identify orthologs conserved between all five species of yeast (n = 2256). ORFs were checked for internal stop codons and correct start and termination codons. Custom Perl and R scripts (available on request) were used in preparing these data. All sequences were downloaded through Saccharomyces Genome Database (www.yeastgenome.org).
Expression and Recombination Data
As gene expression data are not currently available for each yeast species, expression data from S. cerevisiae were used (Holstege et al. 1998) on the assumption that expression levels had not significantly altered for orthologous genes. The expression data from the study of Holstege et al. (1998) were gathered in standard growth medium, in which all yeast species in this study are known to grow. Data from this study are expressed in units of copies per cell.
As with the expression data, no data on the recombination rates of the different yeast species were available, so S. cerevisiae was used as a proxy (Gerton et al. 2000). The data from Gerton et al. (2000) were provided as a ratio of double-strand break (DSB)-enriched DNA to total genomic DNA, with a ratio of 1 representing an ORF with the genome-wide average level of DSBs.
Identification of Optimal Codons by ΔRSCU Analysis
Sets of orthologous, highly expressed genes (n = 40) and weakly expressed genes (n = 50) were constructed and used for calculating optimal codon usage. As described previously, optimal codons were identified by ΔRSCU analysis (Duret and Mouchiroud 1999; Cutter et al. 2006). ΔRSCU is simply the difference in average RSCU between highly expressed and weakly expressed genes. The significance of differences was assessed by t-tests with a significance threshold of P < 0.01. Calculations were carried out in the R environment (R Development Core Team 2009). GC3s (the GC content at third coding positions for the 18 amino acids with 2-fold or more fold degeneracy) and Fop values were calculated using the program codonw (available from http://codonw.sourceforge.net/) using tables of optimal codons inferred from the ΔRSCU analysis for each of the yeast species (Sharp et al. 2005).
Phylogeny
The phylogeny of the Saccharomyces sensu stricto group was estimated using MrBayes (Ronquist and Huelsenbeck 2003) using the general time reversible model with gamma-shaped rate variation with a proportion of invariable sites. Genes used were selected from the 50 most weakly expressed orthologs (used in the ΔRSCU analysis), situated in areas of medium recombination (n = 11). Sequences were concatenated, with start and termination codons removed.
Calculating the Strength of Selection and Biased Gene Conversion
The strength of selection for codon usage bias at 2-fold degenerate codons was calculated using the Li–Bulmer equation (Bulmer 1991), and confidence intervals for each 2-fold degenerate codon were calculated by parametric bootstrapping (n = 10,000) using custom R scripts similar to those of (dos Reis and Wernisch (2009). For this purpose, classes of highly and weakly expressed genes were selected from gene expression data from a single species (S. cerevisiae) as no other gene expression data for other yeast species are available.
 is the estimate of the scaled selection coefficient for highly expressed genes (Sharp et al. 2005).
This, however, ignores the possible effects of gBGC on codon usage. If gBGC is acting with a scaled intensity SBGC on the codons in question, then  is in reality an estimate of the product κ exp (−SBGC). If GC codons are optimal, then the effect of gBGC will be to cause an underestimate of κ when using equation (1) and hence an overestimate of S from equation (2); if AT codons are optimal, the opposite will be true.
 LR into equation (1):
Data binned both by messenger RNA (mRNA) expression and recombination were used for this purposes, with a mean bin size of n = 30. Bin sizes were identical for each recombination rate and expression class across species.
Amino Acid and Nucleotide Frequencies
Amino acid composition was determined in a similar way to RSCU, by calculating the relative amino acid frequency of each amino acid for each gene, and then taking the mean value across all genes (in a particular recombination or expression class) for each species. Nucleotide frequencies at first, second, and third positions were calculated by determining the relative proportions of G and C per ORF.
Results
Given that there are both gene expression and recombination rate data for S. cerevisiae, there is the potential to quantify the strength of both codon usage bias and biased gene conversion. The results presented here are in two sections: the first part describes empirical observations about codon usage bias and gBGC in S. cerevisiae and closely related species, in the form of correlates between observations, whereas the second attempts to explain and quantify the strength of the processes that are likely to have caused these patterns, using an extension of a previous mathematical model (see Materials and Methods).
GC3s Content Variation across Yeast Species
In the sensu stricto group, the most distal split is between the lineage leading to S. bayanus and S. kudriavzevii (fig. 1, panel a) and those leading to all other species. There is considerable variation between species in the GC content at degenerate, third position coding sites (as seen in fig. 1, panel b). Saccharomyces bayanus and S. kudrizvzevii have the highest GC3s contents of the five species (table 1). Orthologs with the highest GC3s values appear to display the greatest variation in GC content between the five species. A positive correlation between GC content and recombination rate has previously been found in S. cerevisiae (Sharp et al. 1995; Birdsell 2002; Tsai et al. 2010). This is also the case for all five species of yeast, using recombination data from S. cerevisiae (Spearman's rank correlations ranging between 0.38 and 0.43, P < 2.2 × 10⁻¹⁶—see supplementary fig. 1, Supplementary Material online). Surprisingly, the highest correlation coefficient is for S. bayanus. This suggests that the major features of the recombinational landscape are conserved across these species.
Median Fop and GC3s Values for Five Species of Yeast.
| Species (increasing in GC content from L to R) | Saccharomyces mikatae | S. paradoxus | S. cerevisiae | S. kudriavzevii | S. bayanus |
| Median GC3s content | 0.354 (0.0015) | 0.371 (0.0013) | 0.361 (0.0011) | 0.392 (0.0014) | 0.400 (0.0025) |
| Median Fop | |||||
| All optimal codons (SE) | 0.459 (0.0016) | 0.421 (0.0017) | 0.430 (0.0017) | 0.424 (0.0014) | 0.453 (0.0015) |
| Only AT-ending codons (SE) | 0.425 (0.0016) | 0.415 (0.0015) | 0.418 (0.0016) | 0.398 (0.0018) | 0.400 (0.0018) |
| Only GC-ending codons (SE) | 0.285 (0.0014) | 0.297 (0.0016) | 0.289 (0.0015) | 0.313 (0.0017) | 0.330 (0.0026) |
NOTE.—Fop values have also been calculated separately for AT-ending and GC-ending codons. Nine-five percent confidence intervals (shown in brackets) for GC3s and Fop values were estimated by nonparametric bootstrapping (sampling 100 times). SE, standard error.
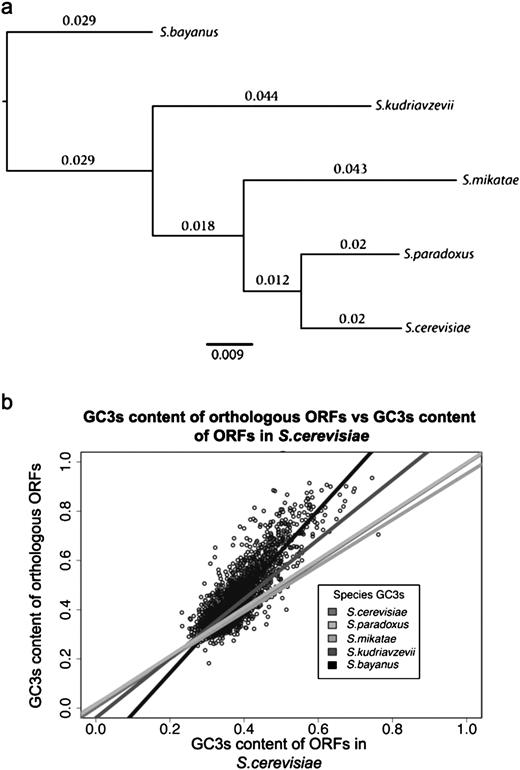
Panel (a), phylogeny of the Saccharomyces sensu stricto group of yeast calculated using MrBayes using a site-specific rate model (general time reversible model with gamma-shaped rate variation with a proportion of invariable sites) for a set of 11 weakly expressed genes located in areas of medium recombination rate. Branch values indicate substitutions per site. The posterior probability for internal nodes was 1. Panel (b), scatter plots of GC3s content of Saccharomyces cerevisiae genes plotted against GC3s content for corresponding orthologs in S. paradoxus, S. mikatae, S. kudriavzevii, and S. bayanus. For clarity, only data points for the S. bayanus versus S. cerevisiae comparison are shown.
Closer examination of GC3s content patterns reveals a strong and highly significant negative correlation in each species between mean chromosomal GC3s content and chromosome length (Spearman's rank correlation range across species: −0.77 to −0.84, P < 5 × 10⁻⁴). This relationship is probably due to the increased per–base pair probability of recombination initiation on shorter chromosomes, given the requirement for at least one crossover per bivalent to avoid meiotic nondisjunction (Martini et al. 2006), and hence a greater per-site probability of a biased gene conversion. The influence of gBGC on chromosomal GC content is further supported by the strong positive correlation between the mean chromosomal GC content and mean chromosomal crossover rate estimated for each species from combined physical and genetic maps for S. cerevisiae (Spearman's rank correlation range across species: 0.71–0.77, P < 2 × 10⁻³: data from Christie et al. 2004).
Optimal Codon Usage in Five Species of Yeast
In yeast, approximately 50% of the optimal codons are AT ending (Sharp et al. 1988). This is in contrast to many other organisms such as Arabidopsis spp. and Drosophila spp., where optimal codons are almost always GC ending (Marais et al. 2004; Vicario et al. 2007). ΔRSCU analysis of codon usage bias revealed only one difference in the optimal codon set between the different yeast species, which was significant at P < 0.01 (in t-tests between strongly and weakly expressed classes of genes): GCC (encoding alanine), which was found to be optimal in S. cerevisiae but not in S. bayanus or S. paradoxus (supplementary table 1, Supplementary Material online).
Optimal Codon Usage Is Affected by GC Content and Recombination Rate
A common measure of codon usage bias is the frequency of optimal codons (Fop), which is simply the fraction of optimal codons among all degenerate codons for a given coding sequence (Ikemura 1981). As expected from previous studies (Drummond and Wilke 2008), there is a strong positive correlation between Fop and mRNA expression level (for all five species, Spearman's rank correlation is >0.55, P < 0.001: see supplementary fig. 2, panels a–c, Supplementary Material online).
In order to examine how optimal codon usage varies with increasing GC content, all ORFs with Fop > 0.55 (and hence expected to be highly expressed) were binned according to their GC3s content (fig. 2). A clear pattern of a higher mean value of Fop at intermediate levels of GC3s content can be observed. At extremely high levels of GC3s content (>0.7), there are no ORFs that have high Fop values in S. cerevisiae, S. paradoxus, or S. mikatae. In areas of high GC content, the decline in mean Fop appears to be less pronounced in both S. kudriavzevii and S. bayanus. A similar pattern to the one in figure 2 is observed when mRNA expression level (for highly expressed genes) is binned by GC content (supplementary fig. 3, panel a, Supplementary Material online) and by recombination rate (supplementary fig. 3, panel b, Supplementary Material online).
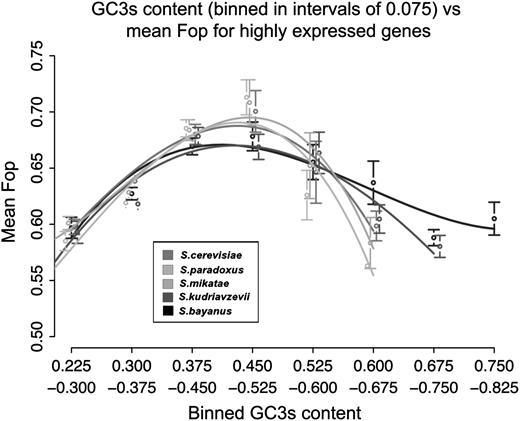
Mean Fop for highly expressed genes binned by GC3s content. Error bars show ±2 standard error.
When considering all genes regardless of mRNA expression levels, an overall positive correlation is observed between physical recombination rate and Fop, even after correcting for the effects of gene expression, which increases in strength when only GC-ending optimal codons (FopGC) are considered (table 2). However, there is a strong negative correlation between Fop for AT-ending codons (FopAT) and recombination rate (table 2). When partitioned by differences in Fop, it is clear that the negative correlation between FopAT and GC3s content for all genes is driven by weakly expressed genes (fig. 3, panels a and c). Further confirmation of this is that the partial correlations between FopAT or FopGC and GC3s content, controlling for gene expression, are stronger than correlations between FopAT or FopGC and GC3s alone (table 2). Interestingly, the median value of Fop differs between AT- and GC-ending codons (table 1), with a higher mean FopAT than FopGC (Mann–Whitney U test P < 2.2 × 10⁻¹⁶, calculated using all orthologous genes) observed across all species.
Relationship between Fop and Recombination.
| Correlation (x, y) or (x, y|z) | Saccharomyces mikatae | S. paradoxus | S. cerevisiae | S. kudriavzevii | S. bayanus |
| Fop, recombination | 0.178 (2.2 × 10⁻¹⁶) | 0.171 (2.2 × 10⁻¹⁶) | 0.193 (2.2 × 10⁻¹⁶) | 0.213 (2.2 × 10⁻¹⁶) | 0.183 (2.2 × 10⁻¹⁶) |
| FopAT, recombination | −0.121 (6.0 × 10⁻⁹) | −0.102 (1.1 × 10⁻⁶) | −0.100 (1.8 × 10⁻⁶) | −0.178 (2.2 × 10⁻¹⁶) | −0.223(2.2 × 10⁻¹⁶) |
| FopGC, recombination | 0.348 (2.2 × 10⁻¹⁶) | 0.349 (2.2 × 10⁻¹⁶) | 0.366 (2.2 × 10⁻¹⁶) | 0.398 (2.2 × 10⁻¹⁶) | 0.419 (2.2 × 10⁻¹⁶) |
| Fop, GC content | 0.268 (2.2 × 10⁻¹⁶) | 0.224 (2.2 × 10⁻¹⁶) | 0.277 (2.2 × 10⁻¹⁶) | 0.292 (2.2 × 10⁻¹⁶) | 0.266 (2.2 × 10⁻¹⁶) |
| FopAT, GC content | −0.389 (2.2 × 10⁻¹⁶) | −0.173 (5.1 × 10⁻¹⁷) | −0.368 (2.2 × 10⁻¹⁶) | −0.498 (2.2 × 10⁻¹⁶) | −0.574 (2.2 × 10⁻¹⁶) |
| FopGC, GC content | 0.730 (2.2 × 10⁻¹⁶) | 0.708 (2.2 × 10⁻¹⁶) | 0.720 (2.2 × 10⁻¹⁶) | 0.757 (2.2 × 10⁻¹⁶) | 0.800 (2.2 × 10⁻¹⁶) |
| Fop, recombination|expression | 0.128 (8.6 × 10⁻¹⁰) | 0.120 (7.7 × 10⁻⁹) | 0.146 (2.3 × 10⁻¹²) | 0.171 (1.5 × 10⁻¹⁶) | 0.134 (1.3 × 10⁻¹⁰) |
| FopAT, recombination|expression | −0.188 (8.2 × 10⁻²⁰) | −0.401 (2.2 × 10⁻¹⁶) | −0.170 (2.7 × 10⁻¹⁶) | −0.240 (8.1 × 10⁻³²) | −0.280 (6.3 × 10−44) |
| FopGC, recombination|expression | 0.326 (2.4 × 10⁻²⁰) | 0.328 (5.3 × 10−61) | 0.346 (7.1 × 10−69) | 0.381 (3.2 × 10−85) | 0.405 (2.4 × 10−98) |
| Fop, GC content|expression | 0.236 (7.30 × 10⁻³¹) | 0.197 (1.0−21) | 0.254 (1.2 × 10⁻³⁵) | 0.275 (7.8 × 10−42) | 0.229 (5.8 × 10⁻²⁹) |
| FopAT, GC content|expression | −0.481 (1 × 10−149) | −0.494 (6.3 × 10−161) | −0.463 (1.4 × 10−135) | −0.578 (2.6 × 10−248) | −0.659 (2.2 × 10⁻¹⁶) |
| FopGC, GC content|expression | 0.748 (2.2 × 10⁻¹⁶) | 0.734 (2.2 × 10⁻¹⁶) | 0.742 (2.2 × 10⁻¹⁶) | 0.783 (2.2 × 10⁻¹⁶) | 0.828 (2.2 × 10⁻¹⁶) |
NOTE.—Spearman's rank correlations between Fop, FopAT, and FopGC and physical recombination rate, GC3s content, and partial correlations, controlling for the effect of gene expression (P values in brackets).
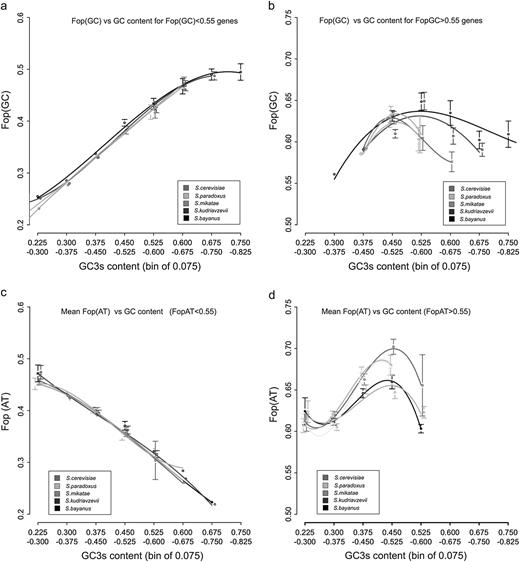
Panel (a), mean FopGC for genes with low Fop binned by GC3s content (0.075 width). Panel (b), mean FopGC for genes with low Fop binned by GC3s content (0.075 width). Panel (c), mean FopAT for genes with low Fop binned by GC3s content (0.075 width). Panel (d), mean FopAT for genes with low Fop binned by GC3s content (0.075 width).
In highly expressed genes (those with Fop > 0.55 or mRNA copies/cell > 12.2), there is a nonlinear relationship between optimal codon usage and GC3s content; both FopAT and FopGC decline when GC3s levels are high (fig. 3, panels b and d). The negative correlation between FopAT and recombination in weakly expressed genes can be plausibly explained by the action of gBGC. However, when considering the relationship between Fop and GC content for highly expressed genes, the nonlinear relationships between both FopAT and FopGC and GC content for highly expressed genes (see fig. 3, panels b and d) suggest that selection for optimal codon usage is weaker for genes that reside in areas with either low or high recombination rates/GC content. Whereas the decline in FopAT might be expected, depending upon the strength of gBGC, a decline in FopGC would not. This relationship is unexpected if Hill–Robertson effects reducing levels of diversity and adaptation are the main causes of the relationship between codon usage and recombination rates because they are expected to be stronger in genomic regions with low recombination rates (Charlesworth et al. 2010), as has been proposed for aspects of protein sequence evolution in yeast (Connallon and Knowles 2007). We will consider possible causes of this effect in the Discussion.
In order to investigate this phenomenon further, we turn to the population genetics model of codon usage bias described in the Materials and Methods, which allows both the strength of selection and the strength of gBGC (scaled by the effective population size) acting upon 2-fold degenerate codons to be estimated.
Estimates of ![formula]() and S Corrected for gBGC
and S Corrected for gBGC
Having established that there is considerable variation in levels of FopGC and FopAT in both strongly and weakly expressed classes of genes, depending upon local recombination rates, it is important to determine the contributions of mutational bias, selection, and gBGC. Estimates of κ and S are both potentially confounded by gBGC. Specifically, we expect a decrease in estimates of S for GC-ending optimal codons with an increasing strength of gBGC. This may at first seem to be counterintuitive, as the action of gBGC might be expected to increase estimates of S for these optimal codons. However, the action of gBGC in weakly expressed genes in areas with high levels of recombination biases estimates of κ downward, leading to a downward bias in estimates of S when selection acts in the same direction as gBGC, as is the case for GC-ending codons (see Materials and Methods). Supplementary figure 4, panel a (Supplementary Material online), shows that, for weakly expressed genes (with little or no selection for optimal codons), GC-ending codons increase in frequency with increasing recombination rate, whereas AT-ending optimal codons tend to decrease in frequency. In highly expressed genes, where selection is acting upon optimal codons (supplementary fig. 4, panel b, Supplementary Material online), the pattern of optimal codon usage is more complex, as both selection and gBGC appear to affect patterns of optimal codon usage.
To avoid biased estimates of S for highly expressed genes, the apparent mutational bias parameters for each class ( in eq. 2) were calculated from a bin consisting of weakly expressed genes obtained from areas of low recombination. This controls for the possible effect of differences in recombination rate on the contribution of gBGC to . Estimates of have also been obtained directly from S. cerevisiae mutation accumulation experiments and have been estimated to have an approximately 3-fold bias in favor of GC → AT versus AT → GC mutations (Lynch et al. 2008). Our estimates of from regions with low recombination agree reasonably well with this (see supplementary table 2, Supplementary Material online), although they may be biased downward by reduced selection or gBGC.
By binning data both by the normalized estimates of local recombination rates described in the Materials and Methods (r ≤ 1 = low, 1 < r ≤ 1.2 = medium, and r > 1.2 = high) and by log-transformed mRNA expression levels (low expressed is < 0.18 copies per cell and high expressed is > 12.2 copies per cell), estimates of S from highly expressed genes in regions of low, medium, and high recombination were obtained. However, these estimates of S are still a compound parameter involving S and SBGC, and so corrected estimates of S and STRUE (table 3) were calculated by subtracting the contribution of gBGC, estimated from weakly expressed genes with intermediate or high levels of recombination (see Materials and Methods for details).
The Strength of Selection on Codon Usage for Five Species of Yeast.
| Codon/amino acid | Saccharomyces mikatae | S. paradoxus | S. cerevisiae | S. kudriavzevii | S. bayanus | |||||
| Recombination rate | Intermediate | High | Intermediate | High | Intermediate | High | Intermediate | High | Intermediate | High |
| TTT/TTC*/F | 1.15 | 1.01 | 1.31 | 0.99 | 1.32 | 1.2 | 1.16 | 1.05 | 1.42 | 1.29 |
| TTA/TTG*/L | 1.12 | 0.65 | 1.25 | 0.85 | 1.11 | 1.02 | 0.97 | 0.82 | 1.14 | 1.06 |
| TAT/TAC*/Y | 1.5 | 1.19 | 1.6 | 1.54 | 1.51 | 1.39 | 1.86 | 1.35 | 2.11 | 1.47 |
| TGT*/TGC/C | 1.03 | 1.31 | 0.83 | 1.22 | 1.77 | 1.42 | 1.28 | 1.25 | 1.11 | 1.08 |
| CAT/CAC*/H | 1.33 | 0.86 | 1.28 | 1.37 | 1.5 | 1.16 | 1.04 | 1.03 | 1.24 | 1.04 |
| CAA*/CAG/Q | 1.63 | 1.41 | 1.69 | 1.42 | 1.83 | 1.17 | 1.68 | 1.25 | 2.02 | 1.09 |
| ATT/ATC*/I | 0.44 | 0.2 | 0.58 | 0.17 | 0.48 | 0.22 | 0.46 | 0.34 | 0.88 | 0.4 |
| AAT/AAC*/N | 1.73 | 1.3 | 1.81 | 1.68 | 1.73 | 1.57 | 1.56 | 1.62 | 1.79 | 1.83 |
| AAA/AAG*/K | 1.55 | 1.33 | 1.55 | 1.44 | 1.67 | 1.35 | 1.46 | 1.24 | 1.77 | 1.51 |
| AGT*/AGC/S | −0.46 | 0.07 | −0.13 | 0.04 | −0.08 | −0.19 | −0.23 | 0.19 | −0.09 | −0.23 |
| AGA*/AGG/R | 1.95 | 2.52 | 1.9 | 2.36 | 2.02 | 2.35 | 2.7 | 1.95 | 2.76 | 2.4 |
| GAT/GAC*/D | 0.6 | 0.53 | 0.68 | 0.48 | 0.69 | 0.64 | 0.55 | 0.63 | 0.68 | 0.54 |
| GAA*/GAG/E | 1.3 | 1.01 | 1.31 | 1.09 | 1.17 | 1.25 | 1.11 | 1.14 | 1.33 | 1.02 |
| Weighted mean (SE) | 1.22 | 1.01 | 1.29 | 1.11 | 1.28 | 1.12 | 1.22 | 1.06 | 1.46 | 1.15 |
| (4.32 × 10⁻³) | (4.82 × 10⁻³) | (3.59 × 10⁻³) | (5.35 × 10⁻³) | (4.36 × 10⁻³) | (4.37 × 10⁻³) | (6.46 × 10⁻³) | (3.04 × 10⁻³) | (6.06 × 10⁻³) | (4.99 × 10⁻³) | |
NOTE.—Estimate of the strength of codon usage bias (STRUE) in five species of yeast for highly expressed genes in areas of intermediate and high recombination using the mutational bias parameter estimated from weakly expressed genes in regions of low recombination and corrected for the effects of BGC (SBGC). Asterisk indicates optimal/preferred codon in S. cerevisiae. SE, standard error.
Supplementary figure 5, panel a (Supplementary Material online), shows that the magnitude of S follows complex patterns, depending upon the 2-fold degenerate codon that is examined. For clarity, only the two most evolutionarily distant species (S. bayanus and S. cerevisiae) are plotted. Although not a universal trend, for most optimal codons, both corrected and uncorrected estimates of S appear to be largest at intermediate levels of recombination (supplementary fig. 5, panel a, Supplementary Material online), as was seen for overall levels of optimal codon usage when binned by GC content (figs. 2 and 3). This trend is often identical between the two species studied, although the magnitude of S is quite variable between the species. This finding suggests that gBGC alone is not the main cause of lower optimal codon usage for highly expressed genes in areas of high recombination as the reduction in S in high areas of recombination would be expected to disappear after the correction is applied.
In order to assess the significance of the change in selective strength with recombination rate, all GC-ending optimal codons were grouped together and the strength of selection was calculated as previously described (see Materials and Methods) for regions of low, medium, and high recombination. As can be seen in figure 4, panels a and b, there is a significantly lower estimate of STRUE both in regions of low recombination and high recombination for GC-ending codons in both S. cerevisiae and in S. bayanus even after correction for the effects of BGC. The same pattern is seen for AT-ending codons in areas of low recombination; however, differences between intermediate and high levels of recombination are not significant (fig. 4, panels c and d). This is consistent with the data presented in figure 3 (panels b and d), where the confidence intervals for variation in FopAT are much larger than for FopGC and reinforces the point that gBGC must be quite weak. A possible reason for the significant decline in STRUE for GC-ending codons is put forward in Discussion. Comparing the two species, it is interesting to note that, in general, in areas of high recombination, AT-ending optimal codons have higher frequencies in S. cerevisae than in S. bayanus (see supplementary fig. 4, Supplementary Material online). For all 2-fold degenerate codons, GC-ending codons in S. bayanus are at a higher frequency than in S. cerevisiae, in both high- and low-expression categories. This raises the possibility that the strength of gBGC is different in these two species.
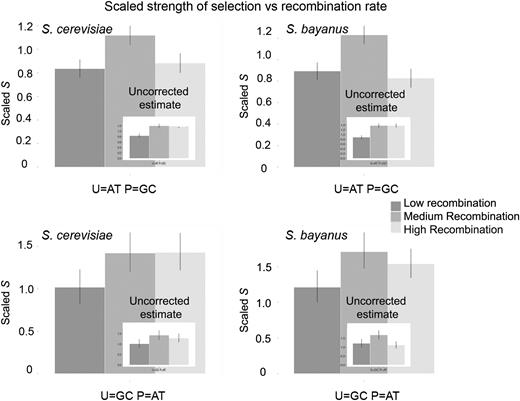
Corrected estimates of S (where P is the preferred/optimal codon and U is the unpreferred/optimal codon) for all GC-ending optimal codons (panels a and b) and all AT-ending optimal codons (panels c and d). Ninety-five percent confidence intervals generated by parametric bootstrapping are also shown. Corresponding estimates of S before correction for the action of BGC are inset into each panel.
The Strength of gBGC in Yeast
By partitioning ORFs by recombination rate, as described in the Materials and Methods, it is possible to calculate an estimate of the scaled strength of gBGC (SBGC) from the frequency of GC base pairs in weakly expressed genes alone (i.e., those where selection for optimal codons is presumed to be absent). Figure 5 and supplementary figure 5, panel b (Supplementary Material online), show estimates of SBGC for each 2-fold degenerate optimal/nonoptimal codon pair. Those that are positive are in cases where GC codons are optimal. As expected on the basis of the above results, the estimates of the strength of gBGC (estimated from regions of high recombination) are consistently higher in S. bayanus than in S. cerevisiae (weighted mean: S. cerevisiae = 0.10, S. bayanus = 0.26; see also supplementary table 3, Supplementary Material online). At all 2-fold sites, SBGC « 1 and is about ten times lower than estimates of S for codon usage bias. This suggests that the average strength of gBGC is so weak compared with selection that the process of drift plays a much more significant role in determining the fate of variants subject to gBGC alone. If genes are partitioned by Fop, instead of mRNA expression, estimates of gBGC are higher (weighted mean: S. cerevisiae = 0.38, S. bayanus = 0.670; see also supplementary table 3, Supplementary Material online). This may reflect a statistical bias caused by the fact that Fop is estimated with some error, so that selecting extreme values of Fop as the basis for selecting genes for comparison will exaggerate the true difference in Fop between high- and low-biased genes. The expression-based values for gene expression are not subject to this bias and hence are likely to be more reliable. Alternatively, it may be due to variation in mutational bias between genes, causing differences in Fop unrelated to expression level.
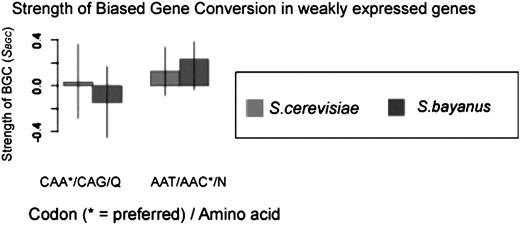
Strength of BGC estimated from weakly expressed genes for glutamine (Q) and asparagine (N). As the optimal codon for Q is CAA, the strength of BGC is estimated as negative, as it is acting to increase the frequency of the nonoptimal codon CAG.
Amino Acid Substitutions Driven by gBGC
Although it seems clear from these results that gBGC has affected patterns of synonymous substitution, we have not yet evaluated the possible effects of gBGC on amino acid substitutions. The results shown in table 4 illustrate the relationship between relative GC content (see Materials and Methods) at first, second, and third codon positions in highly and weakly expressed genes binned by recombination rate. By dividing codons into their first, second, and third positions, we can assess whether GC content differs when all substitutions are nonsynonymous (second position), mostly nonsynonymous (first position), and mostly synonymous (third position). By partitioning with respect to gene expression, we also have a crude measure of how selection acts on highly conserved and less highly conserved classes of genes because there is a negative relationship between expression level and divergence (Pal et al. 2001).
Relationship between Recombination Rate and GC Content.
| Spearman's rank correlation between recombination rate and relative GC content | ||||
| Codon position | All genes | Highly expressed genes | Weakly expressed genes | |
| Saccharomyces cerevisiae | 1 | 0.049 (P = 0.019) | −0.011 (P = 0.87) | 0.028 (P = 0.25) |
| S. bayanus | 1 | 0.094 (P = 7.8 × 10⁻⁶) | 0.050 (P = 0.48) | 0.069 (P = 0.005) |
| S. bayanus–S. cerevisiae | 1 | 0.090 (P = 2 × 10⁻⁵) | ||
| S. cerevisiae | 2 | 0.018 (P = 0.40) | −0.069 (P = 0.33) | 0.026 (P = 0.29) |
| S. bayanus | 2 | 0.055 (P = 0.009) | −0.008 (P = 0.91) | 0.057 (P = 0.018) |
| S. bayanus–S. cerevisiae | 2 | 0.061 (P = 0.003) | ||
| S. cerevisiae | 3 | 0.211 (P < 2. × 10−16) | 0.091 (P = 0.12) | 0.265 (P < 2.2 × 10⁻¹⁶) |
| S. bayanus | 3 | 0.294 (P < 2. × 10−16) | 0.208 (P = 0.003) | 0.353 (P < 2.2 × 10⁻¹⁶) |
| S. bayanus–S. cerevisiae | 3 | 0.181 (P < 2.2 × 10⁻¹⁶) | ||
NOTE.—Spearman's rank correlation (and P values) for the relationship between recombination rate for a given ORF and the relative GC content of the ORF at first, second, and third codon positions. Also shown are correlations between recombination rate and the difference between S. bayanus and S. cerevisiae in GC content of each ORF.
In S. cerevisiae, there is no significant correlation between GC content and recombination rates at first or second positions in either expression class. However, a correlation exists in weakly expressed genes at third position sites. In contrast, there is a small but significant correlation at first, second, and third codon positions for S. bayanus for low-expression genes (also for highly expressed genes at third position sites). The fact that there is a significant positive correlation at the second position of codons suggests that, in some cases, amino acid content can be shaped by gBGC. Examination of the differences in the GC contents of genes between species shows that a significantly positive correlation exists between recombination rate and the difference between S. bayanus and S. cerevisiae in GC content at second position sites (table 4). This correlation is higher at first position sites (where some changes are synonymous) compared with the second position and still higher at third position sites, where most changes are synonymous. The fact that there are no significant correlations in S. cerevisiae suggests that gBGC is weaker in this species than in S. bayanus, a finding supported by the analysis of synonymous codon usage in the previous section. Although a stronger relationship between GC content and recombination exists in S. bayanus, the correlation coefficient, although significant, is still small.
Differences between S. bayanus and S. cerevisiae in relative amino acid frequencies were determined for ORFs binned by recombination rate (supplementary fig. 6, panel a, Supplementary Material online), GC3s content (supplementary fig. 6, panel b, Supplementary Material online), Fop (supplementary fig. 6, panel c, Supplementary Material online), and mRNA expression levels (supplementary fig. 6, panel d, Supplementary Material online). Very similar patterns are observed for data binned by recombination rate and by GC3s content. The amino acids lysine (K), isoleucine (I), and asparagine (N) are consistently lower in frequency in S. bayanus compared with S. cerevisiae, in a manner dependent upon recombination rate, even though their optimal codons are GC ending. A common feature of these codons is that their first and second positions are AT rich. Conversely, arginine (CGN) and alanine (GCN) are both higher in frequency in S. bayanus relative to S. cerevisiae. In contrast to lysine, isoleucine, and asparagine, these are GC rich at first and second positions.
Although involving a synonymous difference, perhaps one of the most striking examples of altered patterns of nucleotide composition is the case of the amino acid leucine, encoded by the 4-fold degenerate CTN codons and the 2-fold degenerate TTR codons. In both S. cerevisiae and S. bayanus, the optimal codon for leucine is TTG. However, across all orthologs, in S. bayanus, the frequency of leucine TTR (L2) codons is lower than in S. cerevisiae and the frequency of CTN (L4) codons is higher (supplementary fig. 6, panels a and b, Supplementary Material online). The extent of these differences increases with increasing recombination rate and GC content. However, when binned by Fop, the largest differences are at intermediate levels of Fop, illustrating the fact that selection acts to retain the optimal TTG codon in highly expressed genes.
Why should there be a smaller difference in the frequency of TTR/CTN codons in genes with low Fop than at intermediate levels of Fop? One potential explanation is that the pattern observed is due to gBGC. Given that there is a positive correlation between Fop and recombination rate, in genes with low Fop in areas of low recombination, the levels of TTR/CTN are determined by mutation and drift. At intermediate levels of Fop (and thus at intermediate rates of recombination), gBGC can act to convert TTR codons to CTR codons without opposition from selection (which would act to retain TTG codons). At the highest levels of Fop (and hence high levels of recombination), TTG codons are preferred; therefore, although gBGC is strong, selection prevents the fixation of CTR codons.
The fact that there is a difference between S. bayanus and S. cerevisiae in the levels of TTR/CTN suggests that there is variation in either the physical or the effective recombination rate between the species and hence more opportunity for gBGC to occur in S. bayanus. A difference in effective recombination rate would also entail a higher Ne, with S. bayanus having a higher effective population size, leading to a greater chance of fixation of a GC allele.
Discussion
Studies of synonymous codon usage illuminate the relative roles of different evolutionary forces in shaping nucleotide composition. From the data here, it is clear that patterns of optimal codon usage and GC3s are dependent upon mutation, selection, drift, and biased gene conversion. In this study, we have estimated the relative contributions of selection and gBGC to the observed patterns of biased codon usage in five species of yeast. To achieve this, we employed a simple population genetics model using the Li–Bulmer equation (eq. 1). This has revealed that the strength of selection on codon usage bias across the Saccharomyces sensu stricto group is variable. After correcting for the effect of gBGC, the strongest population-scaled estimates (S) come from S. bayanus, whereas selection for optimal codon usage appears to be weaker in S. mikatae and S. kudriavzevii (table 3), although these differences are small. However, this pattern is consistent across nearly all 2-fold degenerate sites, and the standard errors of the weighted means are small. The magnitude of S for codon usage bias is similar to recent estimates in Drosophila despite the higher level of selfing seen in yeast (Zeng and Charlesworth 2009). In contrast, the GC content at third positions is much lower than Drosophila despite similar mutational biases; this reflects the use of optimal ending AT codons in yeast.
In the case of S. kudriavzevii, a reduced strength of selection for codon usage bias might be expected due to the fact that its optimal growth rate is both slower than other species and occurs at a lower temperature when compared with other members of the sensu stricto group (see Sampaio and Goncalves 2008 and data not shown), similar to observations in both bacteria and higher eukaryotes (Vieira-Silva and Rocha 2010; McVean and Vieira 1999; Sharp et al. 2005).
In other cases (such as S. mikatae), where optimal growth rates occur at a similar temperature to S. cerevisiae (data not shown), a lower estimate of S might be due to a lower Ne, leading to a reduced efficiency of selection, as has also been seen in comparisons between D. melanogaster and D. simulans (Akashi 1995). At present, there are no population genetics data with which to test this hypothesis. However, alterations in Ne between different species of yeast could potentially be inferred from difference in the strength of gBGC if the physical recombination rate is known to be unchanged. Of all five species studied, S. mikatae has the most AT-rich genome, perhaps suggesting a decreased long-term effective population size or a higher selfing rate. Indeed, when the strength of gBGC across all 2-fold degenerate sites is estimated for S. mikatae using contrasts in Fop values, it is found to be lower than for S. cerevisiae (weighted mean S. mikatae = 0.237 vs. S. cerevisiae = 0.381). However, when the strength of gBGC is measured using contrasts in gene expression, it is slightly higher in S. mikatae than in S. cerevisiae. Gene expression measurements for each species, further population genetics studies of these organisms, and a more detailed understanding of their ecological niches may lead to a resolution of this problem.
For all species examined here, when the strength of gBGC is estimated using data from 2-fold degenerate sites in weakly expressed genes partitioned by their recombination rate, the estimates of SBGC that are obtained are always «1, with a mean of approximately 0.09 for S. cerevisiae, using high recombination, low-expression genes (supplementary table 3, Supplementary Material online). This suggests that gBGC is a relatively weak force genome-wide, approximately 3-fold weaker than selection for biased codon usage. Despite the relative weakness of gBGC, it is clear that it has an effect on estimates of the strength of selection for codon usage bias. Indeed, the strength of gBGC in local recombination hot spots may be much higher and have much more profound impacts upon biased codon usage (Galtier et al. 2009).
In yeast, rates of crossing over and gene conversion have been measured directly across the whole genome (Mancera et al. 2008): it was found that gene conversion events affect up to 1% of the genome per meiosis, with 2.4% of polymorphic sites undergoing a gene conversion event in the cross in question. This led to an increase in GC content of 1.4% at polymorphic sites where gene conversion events occurred (Mancera et al. 2008).
The estimates from this study can be compared with our estimates as follow. Let k be the frequency of GC-carrying gametes (one-half in the absence gBGC) derived from GC/AT heterozygotes and ω be the per–base pair probability of a biased gene conversion event in such heterozygotes. A simple model of gene conversion yields the relation k = ½(1 + ω/2) (Charlesworth B and Charlesworth D 2010, p. 528–529). The estimate of 0.014 for the increase in GC content is conditioned on the occurrence of a gene conversion event, so we need to multiply this by the probability of a gene conversion event in order to obtain ω. Given that gene conversion and crossover events are approximately equal in frequency in yeast, we can estimate the frequency of a gene conversion event from the mean frequency of a crossover per base pair, which is approximately 4.5 × 10⁻⁶ (www.yeastgenome.org). The probability of a conversion event involving a given nucleotide site can be obtained by multiplying this by the average length of a conversion tract (L), which is about 2 × 10³ bp (Mancera et al. 2008). This gives a net probability of an event of 0.009, which is close to the direct estimate of Mancera et al. (2008). We then have k = 0.5 + 0.009 × 0.014, and so ω = 5.04 × 10⁻⁴ for a given sexual generation.
In S. paradoxus, sexual reproduction is estimated to occur only once every 1000 generations (Tsai et al. 2008), so that ω = 5.04 × 10⁻⁷ per cell generation. In addition, yeast has a high rate of inbreeding, with F ≈ 0.95 in S. paradoxus (Johnson et al. 2004). This must be taken into account in any estimate of the net effect of gBGC on the frequencies of variants at sites segregating for GC and AT. We can use pqω(1 − F)/2 instead of pqω/2 in the expression for the change in p, the frequency of GC at a site (Charlesworth B and Charlesworth D 2010, p. 528). We also require a value for Ne in order to estimate SBGC = 4Neω(1 − F)/2 = 2Neω(1 − F). By equating the estimate of nucleotide site diversity π at 4-fold degenerate sites in S. cerevisiae (see Schacherer et al. 2009) to the neutral expectation 4Neu (where u is the mutation rate per site) and using the mutation rate estimate from Lynch et al. (2008), we obtain an estimate of Ne = 1.8 × 10⁶, so that SBGC = 0.09 (Lynch et al. 2008; Schacherer et al. 2009). This is identical to the above estimate of SBGC of 0.09.
gBGC also has an effect upon amino acid usage. For some species of yeast in both intraspecies and interspecies comparisons, a small but significant difference can be seen in the relative GC content at second position sites (at which all substitutions are nonsynonymous) in regions of high and low recombination (table 4). It is clear that the magnitude of this effect varies depending upon the species examined. In interspecies comparisons of individual amino acids, a clear relationship between the relative frequencies of some amino acids and recombination rate can be observed. This effect is particularly pronounced for the amino acids isoleucine (I), asparagine (N), and lysine (K), all of which are encoded by codons that are AT rich at first and second coding positions. These decline in frequency with recombination rate in S. bayanus relative to their levels in S. cerevisiae.
In all five species studied, the mean frequency of optimal codons, estimated from highly expressed genes binned by their levels of GC3s, is highest at intermediate levels of GC3s content. The fact that FopAT declines with increasing recombination rate in weakly expressed genes (table 2) and that recombination rate and GC content are positively correlated (supplementary fig. 1, Supplementary Material online) might suggest that the action of gBGC (which increases in strength with recombination rate) would have caused overall levels of FopAT to be reduced in highly expressed genes in areas of high recombination. However, our estimates of the strength of BGC are much lower than those for codon usage bias, so that selection for codon usage bias is expected to overcome any effect of BGC (compare figs. 4 and 5). Indeed, when all 2-fold sites are pooled and the overall corrected strength of selection on AT-ending codons is estimated, although in some species (S. bayanus) there is a slight decline in the estimate of STRUE, the confidence intervals are such that there is no significant effect (see fig. 4). Consistent with this, the standard errors of FopAT for highly expressed genes, binned by GC content, do not allow a distinction between FopAT at intermediate and high levels of recombination in S. cerevisiae (see fig. 3). In S. bayanus where a significant difference between FopAT at intermediate and high levels of recombination is seen, the difference is sufficiently small to be explained by the action of BGC, which we have estimated to be stronger in this species than in S. cerevisiae. However, as no gene expression data or recombination rate data exist for this species, this result should be treated with caution.
In contrast, FopGC levels do appear to differ significantly between highly expressed genes in regions of intermediate and high GC content (fig. 3). This decline cannot be explained by the action of BGC, as even after correction for BGC, estimates of the strength of selection for codon usage bias are lower for GC-ending codons in areas of high recombination than in areas of intermediate recombination (table 3 and fig. 4). Furthermore, levels of mRNA expression for highly expressed genes are significantly lower in areas of high recombination when compared with highly expressed genes at intermediate levels of recombination (supplementary fig. 3, Supplementary Material online).
Why do highly expressed genes in areas of high recombination (and hence high GC content) show significantly lower codon usage bias for GC-ending optimal codons than seemingly equivalent genes in areas of intermediate recombination rate (see supplementary fig. 3, Supplementary Material online and fig. 3), reflecting a reduced intensity of selection in their favor (fig. 4)? One possible explanation is that mRNA folding energy is negatively correlated with protein abundance but is positively correlated with GC content, as found for the beginning (more specifically, the first third) of many ORFs, at least in Escherichia coli (dos Reis et al. 2003; Kudla et al. 2009). This relationship suggests that there could be a simple mechanistic explanation; tightly folded mRNAs (those with high folding energy) obstruct translation initiation and reduce protein expression (Kudla et al. 2009). These potentially deleterious effects of higher GC content could thus reduce the selective advantage of GC-ending optimal codons, particularly for highly expressed genes for which the level of protein production is presumably at a selective premium. This raises the question of why regions of the genome with elevated GC content exist and why they are associated with higher levels of recombination. No definite answer can be given to this, but there is some evidence in yeast for a causal relation between high GC content and increased recombination rate (Mieczkowski et al. 2006). High GC/high recombination regions could then reflect either lower mutational bias toward AT in these regions or selection for a localized increase in recombination rate. These effects might be counteracted by the deleterious effects of higher GC content on gene expression for genes for which high levels of expression are advantageous, explaining the negative relation between gene expression and high recombination that we have noted.
Future molecular and population genetic studies of recombination and diversity will allow the relationship between gBGC, recombination, and effective population size and their effects upon fitness to be fully explored.
The authors thank Paul Sharp, Laura Emery, and Andrea Betancourt for useful discussions and both reviewers for insightful comments. This work was supported by a Medical Research Council, United Kingdom Special Retraining Fellowship in Biomedical Informatics to R.H.
References
Author notes
Associate editor: Aoife McLysaght
