


Abstract
Reticulate evolution may function both at the species level, through homoploid and polyploid hybridization, and below the species level, through inter and intragenic recombination. These processes represent challenges for the reconstruction of evolutionary relationships between species, because they cannot be represented adequately with bifurcating trees. We use data from low-copy nuclear genes to evaluate long-standing hypotheses of homoploid (interspecific) hybrid speciation in Nicotiana (Solanaceae) and reconstruct a complex series of reticulation events that have been important in the evolutionary history of this genus. Hybrid origins for three diploid species (Nicotiana glauca, N. linearis, and N. spegazzinii) are inferred on the basis of gene tree incongruence, evidence for interallelic recombination between likely parental alleles, and support for incompatible splits in Lento plots. Phylogenetic analysis of recombinant gene sequences illustrates that recombinants may be resolved with one of their progenitor lineages with a high posterior probability under Bayesian inference, and thus there is no indication of the conflict between phylogenetic signals that results from reticulation. Our results illustrate the importance of hybridization in shaping evolution in Nicotiana and also show that intragenic recombination may be relatively common. This finding demonstrates that it is important to investigate the possibility of recombination when aiming to detect hybrids from DNA-sequence data and reconstruct patterns of reticulate evolution between species.
Introduction
Hybridization followed by change in ploidy is recognized as a widespread and important phenomenon in plant evolution (see recent reviews by Hegarty and Hiscock 2008; Leitch and Leitch 2008). However, other processes of reticulate evolution may also have a significant role in contributing to species diversity in plants. Recent progress has been made in understanding how homoploid (interspecific) hybridization has acted to generate new species in groups such as Helianthus (reviewed by Rieseberg 2006), Iris (reviewed by Arnold 2006), and Paeonia (e.g., Ferguson and Sang 2001; Pan et al. 2007). It has been estimated that at least 25% of plant species are known to hybridize with at least one other species (Mallet 2005), thus suggesting that sufficient opportunities occur in nature for homoploid hybrid speciation (Rieseberg 1997). Development of novel molecular techniques has allowed insights into genetic processes that may accompany hybrid speciation, such as widescale changes in gene expression patterns, increases in genome size, and chromosomal rearrangements (reviewed by Hegarty and Hiscock 2005; Baack and Rieseberg 2007; Paun et al. 2007). Nevertheless, the number of confirmed cases of homoploid hybrid species in plants remains low compared with that of allopolyploid taxa. There are only approximately 20 firmly established examples of homoploid species in plants (Gross and Rieseberg 2005; Rieseberg and Willis 2007; Paun et al. 2009), whereas estimates of the occurrence of polyploids suggest that 15% of angiosperm species and 31% of fern species arose via polyploidization (Wood et al. 2009). Although this estimate includes autopolyploid as well as allopolyploid species, many examples of allopolyploidy can be identified from the literature (e.g., see Paun et al. 2009).
Disparity between the number of confirmed polyploid hybrid species and that of homoploid hybrids may be an artifact of the difficulty involved in accurately identifying the latter and is likely to represent an underestimate of their true occurrence (Seehausen 2004; Mallet 2005). The increase in discovery of homoploid hybrid species that has accompanied improvements in molecular techniques adds weight to this hypothesis (Seehausen 2004; Rieseberg and Willis 2007). The current lack of knowledge relating to the relative importance of homoploid hybrid speciation has been considered remarkable given that it is central to our understanding of the origin of species (Coyne and Orr 2004). Several factors contribute to the difficulty of identifying species of homoploid hybrid origin. Although an increase in chromosome number can provide an obvious indication of polyploidy (albeit not solely those cases involving hybridization), there is no such easily observable characteristic that can be used to diagnose homoploid hybrid taxa (Rieseberg and Willis 2007). Added to this is the fact that the successful establishment of a hybrid species may lead to the extinction of one or both of its parental species (McCarthy et al. 1995; Buerkle et al. 2003), effectively removing the evidence of its origin (Mallet 2007). Furthermore, in cases where backcrossing to parental taxa occurs, their genomic contributions in the hybrid will no longer be divided equally (Baack and Rieseberg 2007; Mallet 2007, 2008). As a result, homoploid hybrid species are harder to define than allopolyploids (Mallet 2007; see Jiggins et al. 2008 for suggested definitions of alternative models of homoploid hybrid speciation) and difficult to distinguish from taxa that have acquired alleles via introgression (Mallet 2005). The power of a phylogenetic approach for detecting homoploid hybrids, based on identifying incongruence between individual gene trees, has been emphasized (e.g., Rieseberg 1997; Sang and Zhong 2000; Linder and Rieseberg 2004), but this may also be limited by the occurrence of a variety of confounding processes that mimic species-level reticulation. Included among these processes are phenomena such as incomplete lineage sorting (deep coalescence), duplication and differential loss of genes, lateral gene transfer, and intragenic recombination (reviewed by Doyle 1992; Maddison 1997; Linder and Rieseberg 2004). To distinguish between hybridization and stochastic population-level or molecular evolutionary processes such as those listed above, it is necessary to examine gene trees from multiple, unlinked loci (Doyle 1992; Rieseberg 1997; Pamilo and Nei 1988).
Nicotiana L. (Solanaceae) is a genus in which reticulation has been proposed as a major mode of evolution (Goodspeed 1954). Allopolyploidization is recognized as having a key role in shaping this genus, with approximately half of the 76 naturally occurring species being allotetraploids (see Knapp et al. 2004 for the most recent classification). Among these allopolyploids are the economically important species Nicotiana tabacum and N. rustica and the model species N. benthamiana. Although allopolyploid taxa have been the main focus of numerous studies (e.g., Kovarik 2004, 2008; Lim et al. 2004, 2006, 2007; Clarkson et al. 2005; Leitch et al. 2008), hybridization among species of the same ploidy has received little attention. In his monograph of Nicotiana, Goodspeed (1954:285) placed great importance on the influence of homoploid as well as polyploid hybridization in the genus, describing homoploid hybridization as a “mechanism which appears to have played a prominent evolutionary role” and hypothesizing hybrid origins for some sections as well as individual species at both the diploid and tetraploid levels. Goodspeed also alluded to the difficulty of resolving relationships of hybrid taxa, stating that “natural hybridization may have been a factor in more instances of speciation than those in which its effect can today be recognized” (Goodspeed 1954: 285). Studies of nuclear genes in Nicotiana have so far shown that both parental homoeologues may be maintained in allopolyploids (e.g., Kelly et al. 1995; Clarkson et al. 2009, although not in all cases, e.g., Wu et al. 2005) and thus allow likely progenitor lineages to be identified; evidence for homoploid hybrid speciation in Nicotiana has been more difficult to recover. Clarkson et al. (2009) proposed putative hybrid origins for two diploid taxa, N. glutinosa and N. linearis, on the basis of conflict between the gene tree for nuclear-encoded plastid-expressed GLUTAMINE SYNTHETASE (ncpGS) and the existing classification based on data from plastid DNA, nuclear ribosomal DNA (nr DNA), and morphology (Knapp et al. 2004). However, additional data from other genes are needed to confirm this interpretation, because scenarios that do not involve hybridization could be invoked to explain the observed incongruence. Thus, although several phylogenetic studies have rigorously examined evolutionary relationships within Nicotiana (e.g., Chase et al. 2003; Clarkson et al. 2004), we have yet to gain a full understanding of the extent to which reticulate processes have been responsible for shaping the evolution of Nicotiana.
In this study, we use sequence data from five low-copy nuclear genes, the structural genes ALCOHOL DEHYDROGENASE (ADH) and WAXY/GRANULE BOUND STARCH SYNTHASE I (WAXY/GBSSI) and the floral regulatory genes GLOBOSA/PISTILLATA (GLO/PI), LEAFY/FLORICAULA (LFY/FLO), and MADS1/FRUITFULL (MADS1/FUL), to evaluate hypotheses regarding the reticulate nature of diploid species in Nicotiana. Through the reconstruction of recombination events, comparison of individual gene trees, and inference of supernetworks, we reveal new evidence for a complex history of reticulate evolution in Nicotiana.
Materials and Methods
Taxon Sampling
We sampled 34 diploid species of Nicotiana (83% of the total diploid species, and 44.7% of the genus, as recognized by Knapp et al. 2004). Multiple individuals per species were analyzed where possible, including four accessions for the putative homoploid hybrid N. glutinosa (from Ecuador, Peru, and Bolivia; spanning the geographical distribution of the species). Representatives of Anthocercideae were used as outgroups because members of this tribe have been identified as sister to Nicotiana on the basis of plastid data (Olmstead et al. 1999, 2008; Clarkson et al. 2004) and data from the nuclear genes Salicylic Acid Methyltransferase (Martins and Barkman 2005) and WAXY/GBSSI (Kelly LJ, unpublished data). For a list of taxa included and details of voucher specimens see supplementary table S1, Supplementary Material online.
Molecular Methods and Data Set Assembly
DNA extractions from the DNA Bank at the Royal Botanic Gardens, Kew (http://data.kew.org/dnabank/homepage.html), were used (for extraction protocol see Clarkson et al. 2004). Selection of target regions for phylogeny reconstruction was based on an initial screen of potential loci in representative study-group taxa. Regions from the ADH, GLO/PI, LFY/FLO, MADS1/FUL, and WAXY/GBSSI genes were selected on the basis of demonstrating appropriate levels of variation and absence of evidence for paralogy. In addition, WAXY/GBSSI is included within the conserved ortholog set II (COSII), a group of conserved orthologous genes identified as being present in single copies within the euasterids (Wu et al. 2006). Details of primer design, polymerase chain reaction (PCR), cloning, and sequencing procedures are given in supplementary text 1, Supplementary Material online, and details of sequence alignment and data set optimization in supplementary text 2, Supplementary Material online.
Tests for Recombination
Individual cloned sequences were visually inspected for evidence of PCR recombination (Bradley and Hillis 1997; Cronn et al. 2002); any obviously chimeric clones were removed from the data set (where a given sequence type was represented by a single recombinant clone, and where other nonrecombinant cloned sequences were obtained from the same individual, the recombinants were treated as PCR artifacts; ADH: three clones; GLO/PI: one clone; LFY/FLO: two clones; MADS1/FUL: two clones; and WAXY/GBSSI: four clones). Tests for in vitro or in vivo recombination were also carried out using GARD (Kosakovsky Pond et al. 2006a, 2006b), RDP3 (Martin et al. 2005), and pairwise homoplasy index (PHI; Bruen et al. 2006); multiple methods were selected, as analyses of simulated data have illustrated that no single method is optimal under all conditions and using several methods that operate on different principles (e.g., phylogenetic methods, compatibility methods, and distance methods) may increase chances of detecting recombination events (Posada and Crandall 2001; Wiuf et al. 2001). GARD, RDP3, and PHI can all be used to test for the presence of recombination. GARD and RDP3 can infer positions of breakpoints; RDP3 also identifies the most likely recombinant/s and their parental sequences (this can only be inferred indirectly with GARD through the examination of the phylogenetic trees that form part of the output).
Any sets of identical sequences shared by >1 accession/species were reduced to retain a single example for these analyses. Initial screening of the entire data set for each gene region was conducted in GARD under the best-fit model of evolution (as assessed using akaike information criterion [AICc]; Sugiura 1978) using the single-breakpoint option run on the Datamonkey server (www.datamonkey.org; analyses for ADH and LFY/FLO were run on the Applecross/San Diego Alliance cluster). Subsets of sequences identified as potentially being involved in recombination events (i.e., putative “daughter” and “parent” sequences; see supplementary table S2, Supplementary Material online, for details of the data sets) were then screened for multiple breakpoints under the best-fit model of evolution using the GARD algorithm through the Datamonkey server, with β–Γ rate variation and three rate classes. Additional independent tests for recombination were carried out in the RDP3 program (Martin et al. 2005) using all seven detection methods: Bootscanning (Salminen et al. 1995); Chimaera (Posada and Crandall 2001); GENECONV (Padidam et al. 1999); MaxChi (Maynard Smith 1992); RDP (Martin et al. 2005); SiScan (Gibbs et al. 2000); and 3SEQ (Boni et al. 2007). We also used the four additional methods for rechecking results of primary detection methods: distance plots (Martin et al. 2005); LARD (Holmes et al. 1999); PhylPro (Weiller 1998); and TOPAL (McGuire and Wright 2000). Settings were optimized in accordance with recommendations in the RDP3 manual (see supplementary table S3, Supplementary Material online). Putative recombination events detected via the automated screen in RDP3 were checked further through examination of MaxChi plots and matrices, as well as Neighbor-Joining trees from the inferred fragments, to assess recombinant designation and breakpoint placement. The PHI test for recombination (Bruen et al. 2006), as implemented in SplitsTree4 V4.10 (Huson and Bryant 2006), was also used to test each set of sequences identified as potentially being involved in a recombination event.
Recombinants obtained via direct sequencing of PCR products were interpreted as evidence of in vivo recombination. Additionally, recombinants comprising a consensus between multiple clones were interpreted as most likely being derived from in vivo recombination (although in vitro recombination cannot be ruled out entirely). Individual cloned sequences inferred as being derived from the same recombination event as direct sequences were interpreted as evidence of in vivo recombination. Individual cloned sequences representing unique recombination events were treated as most likely being the product of in vitro recombination.
Phylogenetic Analyses
Maximum parsimony (MP) analyses were implemented in PAUP* v4.0b10 (Swofford 2003). Heuristic searches were conducted with equal character weighting, DELTRAN character-state optimization, performing 1,000 random addition sequence replicates with tree-bisection–reconnection branch swapping, holding 10 trees at each step, MulTrees in effect and gaps treated as missing data. Node support was assessed using the bootstrap (Felsenstein 1985); 1,000 full-heuristic pseudoreplicates were conducted, using the same settings as described above, but with a single random addition sequence replicate per pseudoreplicate. Consistency and retention indices were calculated for most parsimonious trees (MPTs) in PAUP* v4.0b10. Searches were carried out both with and without outgroup taxa to assess the effect of their inclusion on the ingroup topology. To evaluate effects of inclusion of putative recombinants on levels of resolution and support, analyses were carried out both with and without sequences identified as recombinants. Analyses were also conducted both with and without all retrotransposon sequences and with and without presence/absence characters for these elements (see supplementary text 1, Supplementary Material online). Coding of short interspersed nuclear elements (SINEs) as presence/absence characters, as an addition to the sequence data, did not change the results of MP analyses; these characters were not included in the final analyses. For GLO/PI, several sequences contained a relatively large number of ambiguous bases that resulted from the presence of multiple homopolymer regions. Preliminary analyses were conducted both with and without segments of the data set corresponding to these characters; inclusion of ambiguous characters did not alter the results, and they were therefore included in the final analysis. In addition to analysis of the full data sets, searches under MP were conducted for data sets of putative recombinant and parent sequences. Data sets were partitioned along all breakpoints indicated by GARD and RDP3, with separate analyses conducted for each partition. Analysis settings were as described above, with the exception that for sets of <20 sequences, branch and bound searches were run with compute initial upper bound set to stepwise, addition sequence set to furthest, and minimal trees retained. Strict consensus trees were constructed for partitions generating multiple MPTs.
For Bayesian analyses, the best-fit models of evolution for each data set were selected using the AIC in MrModeltest v2.2 (Nylander 2004). Data sets were partitioned into first, second, and third codon positions, introns, and individual retroelement insertions, and each partition evaluated separately. Analyses were carried out using the parallel version of MrBayes v3.1 (Huelsenbeck and Ronquist 2001; Ronquist and Huelsenbeck 2003; Altekar et al. 2004) through the University of Oslo Bioportal (www.bioportal.uio.no). In each search, four chains were run, three heated using the default setting, starting from a random tree, sampling every 1,000 generations and using flat priors. Four independent 10 million generations runs were performed for each data set. Parameter values from each run were viewed in Tracer v1.4 (tree.bio.ed.ac.uk/software/tracer) to confirm appropriate effective sample sizes had been obtained for each parameter and that the chain had reached stationarity. Trees from the first 500,000 generations were discarded as the burn-in. The remaining trees were combined in PAUP* v4.0b10 to construct a majority-rule consensus tree showing all compatible groupings for each data set.
Lento Plots and Network Analyses
To explore reticulate patterns of evolution further, we used Spectronet v1.27 (Huber et al. 2002) to construct Lento plots (Lento et al. 1995) for groups of sequences that had tested positive for recombination; several outlier sequences (i.e., that were not involved in the same recombination event as the other sequences) were included to aid interpretation of the plots. Characters with ambiguous bases for one or more taxa were excluded to allow NEXUS files to be read by the program. No evidence for substitutional saturation was found in the data sets; splits (i.e., partitions of the taxa into two nonempty subsets) were therefore inferred directly from the data. The “resolve nucleotides to R/Y when necessary” option was used, and the weight of R/Y splits set at 1.0. Plots were constructed from all splits with a weight of ≥2.
Supernetworks have been recommended as useful tools for visualizing conflicting signals from discordant gene trees and reconstructing patterns of reticulate evolution (McBreen and Lockhart 2006; Holland et al. 2008; Whitfield et al. 2008). Combinatorial network methods, such as the Z-closure method used for supernetwork construction, may be sensitive to false positive splits that can result from homoplasy or tree-estimation errors, and filtering of splits in supernetworks is recommended (Huson et al. 2006). Therefore, analyses were performed for each data set with the FilteredSuperNetwork method (Huson et al. 2006) in SplitsTree4 V4.10 (Huson and Bryant 2006) and differing levels of filtering stringency applied using the MinNumberofTrees setting to assess which splits were most highly represented by the input trees. Supernetworks were constructed for the ingroup taxa, with separate networks reconstructed for groups of taxa from which sequences showed the greatest evidence of recombination (i.e., including putative recombinants and “parental” sequences). For N. petunioides and N. noctiflora, which each yielded two closely related ADH and LFY/FLO sequence types, a single sequence per gene region was selected as a representative. The five species from sect. Alatae with n = 9 chromosomes (see supplementary table S1, Supplementary Material online) were excluded as they yielded multiple sequence types, and the relationship between sequences from different gene regions is not clear. Partial trees (either single MPTs or strict consensus trees where ≥one MPT was found) reconstructed from each putatively nonrecombinant partition of the data sets were used as the input for network construction; gene regions were partitioned along the breakpoints detected by GARD, and along those inferred by RDP3. Nodes were collapsed to retain only those with a bootstrap percentage (BP) ≥70. All star trees were removed from the set of input trees.
Results
Sequences from all five target regions were obtained for 28 (82%) of the 34 ingroup species sampled (supplementary table S1, Supplementary Material online). For the GLO/PI region, the preferential amplification of processed pseudogenes (Vanin 1985) prevented the target region being obtained from N. acuminata and N. pauciflora (sect. Petunioides) and N. noctiflora (sect. Noctiflorae). For MADS1/FUL, it was not possible to amplify the entire region for sect. Tomentosae, N. obtusifolia, and the outgroup taxon Symonanthus bancroftii; a reduced portion of the region was amplified using the MADS1 470F + 640R primers, corresponding to positions 396–1,785 in the aligned matrix. The majority of taxa yielded a single sequence type per gene region; the outgroup taxa S. bancroftii and Anthocercis intricata and the ingroup taxa N. noctiflora, N. petunioides, and the five n = 9 species of sect. Alatae generated ≥two sequence types for ≥one of the gene regions. Most n = 9 species from sect. Alatae produced multiple sequences for each of the five gene regions. Some differences between sequences from individual clones could result from Taq-polymerase incorporation error during the PCR (estimated lower/upper limits are ADH: 0.48–19.05 bp; GLO/PI: 0.23–24.38 bp; LFY/FLO: 0.59–29.93 bp; MADS1/FUL: 0.41–25.07 bp; and WAXY/GBSSI: 0.56–23.08; see supplementary text 2, Supplementary Material online, for details of error rates used). In other cases, where multiple clones were used to construct consensus sequences, natural differences are clearly being represented, for example, for the N. forgetiana 1 and 2 sequences for MADS1/FUL (see Gene Trees section below).


Strict consensus trees obtained from MP analysis of five low-copy nuclear gene regions: (a) ADH, consensus of 720 trees; (b) GLO/PI, consensus of 990 trees; (c) LFY/FLO, consensus of 434 trees; (d) MADS1/FUL, consensus of 240 trees; (e) WAXY/GBSSI, consensus of 12 trees. Numbers above branches indicate BP of ≥70. Numbers below branches are PPs of ≥0.95. Asterisks above branches indicate nodes with ≥0.95 PP but <70 BP. Asterisks below branches indicate nodes with ≥70 BP but <0.95 PP. Alternating black and white bars denote groups of sequences derived from sections of Nicotiana and the outgroup (note that the colors are arbitrary and not equivalent between individual gene trees); three-letter codes indicate the section represented by each group of sequences (see key in bottom right-hand corner of figure). For terminals representing cloned sequences, the number of clones is indicated in parentheses after the taxon name. Accession numbers (corresponding to those in supplementary table S1, Supplementary Material online) are indicated for taxa that are represented by more than one individual; N. tomentosiformis sequences marked with the ± symbol represent both accessions of that species. Where multiple sequences derive from a single accession, sequence numbers are given after the taxon name (note that numbers are not necessarily equivalent between data sets, e.g., N. alata 12906 1 for ADH and N. alata 12906 1 for LFY/FLO). Asterisks after taxon names indicate sequences identified as recombinants.
The LFY/FLO region shows the greatest variability; 28.1% of the included characters vary between the ingroup. ADH is the least variable region; 21.5% of the included characters vary within the ingroup. The range of sequence lengths observed within the ingroup is as follows: ADH: —949–997 bp; GLO/PI: 455–1,276 bp; LFY/FLO: 1,170–1,566 bp; MADS1/FUL: 808–1,312 bp; and WAXY/GBSSI: 1,116–1,208 bp. Most of the length variation in the GLO/PI, LFY/FLO, and MADS1/FUL regions results from multiple retrotransposon insertions within introns (mostly SINEs; supplementary table S4, Supplementary Material online). Retrotransposons were detected in sequences from four sections (Alatae, Noctiflorae, Paniculatae, and Petunioides), as well as in the outgroup taxa (supplementary table S4, Supplementary Material online). The largest number of insertion events (five) was detected in sect. Alatae; individuals representing this section may have been involved in recent hybridization events (see Gene Trees section below). All sequences have been submitted to GenBank (supplementary table S1, Supplementary Material online).
Interallelic Recombination
Evidence for Recombination.
Evidence for recombination was found for all five gene regions. GARD detected recombination in 22 of the 23 tested data sets; the exception being the WAXY/GBSSI sequences for sect. Tomentosae (table 1). Analyses conducted in RPD3 found recombination with ≥two detection methods for 15 of the 23 tested data sets, with two separate events detected for the MADS1/FUL N. linearis versus Noctiflorae and Petunioides data set (table 2). A further three data sets (ADH N. miersii vs. Noctiflorae & Petunioides, ADH N. wigandioides vs. Paniculatae & Undulatae, and WAXY/GBSSI N. acaulis vs. Noctiflorae & Petunioides) tested positive for recombination with a single method in RDP3 (results not shown). Of the multiple methods employed in RDP3, SisScan detected the most events (13 of the 16 events inferred by multiple methods), whereas RDP was the only primary scanning method not to detect any evidence for recombination (table 2). PHI found significant evidence of recombination in six of the 23 data sets tested (table 3), all of which had also tested positive for recombination with multiple tests in RDP3 (table 2). GARD detected recombination in five data sets not testing positive with RDP3 or PHI (table 1).
Results of GARD Recombination Analyses.
| Data Seta | Position of Breakpoint(s) b/Averaged Model Support Using AICc |
| ADH | |
| N. alata 12609 1 versus Alatae | 604 (639)/0.280; 825 (927)/0.713 |
| N. acaulis versus Noctiflorae & Petunioides | 464 (516)/0.636; 852 (979)/0.561 |
| N. glauca versus Noctiflorae & Petunioides | 212 (233)/0.374; 460 (512)/0.976; 713 (821)/0.532; 851 (1008)/0.620 |
| N. glutinosa versus Paniculatae, Tomentosae, & Undulatae | 303 (325)/0.534 |
| N. linearis versus Noctiflorae & Petunioides | 315 (356)/0.358; 858 (1008)/0.487 |
| N. miersii versus Noctiflorae & Petunioides | 460 (512)/0.422; 524 (583)/0.137; 850 (1008)/0.879 |
| N. spegazzinii versus Noctiflorae & Petunioides | 460 (512)/0.416; 850 (1008)/0.602 |
| N. wigandioides versus Paniculatae & Undulatae | 801 (921)/0.999 |
| GLO/PI | |
| Tomentosae versus ingroup | 771 (1731)/0.124 |
| LFY/FLO | |
| N. bonariensis 2, N. alata 2369 & 12906 1 versus Alatae | 553 (887)/0.994; 928 (1736)/0.454; 1320 (2233)/0.357 |
| N. glauca versus Noctiflorae & Petunioides | 185 (249)/0.094; 478 (1188)/0.727; 606 (1338)/0.591; 760 (1803)/0.483; 939 (2016)/0.591 |
| N. glutinosa versus Paniculatae, Tomentosae & Undulatae | 220 (559)/0.975; 1155 (2285)/0.989 |
| N. linearis versus Noctiflorae & Petunioides | 196 (249)/0.031; 660 (1390)/0.259; 835 (1880)/0.549 |
| N. longiflora & N. plumbaginifolia versus Alatae & N. sylvestris | 199 (255)/0.466; 622 (973)/0.573; 749 (1269)/0.419 1170 (2078)/0.988 |
| N. miersii versus Noctiflorae & Petunioides | 204 (249)/0.071; 667 (1382)/0.387; 896 (1931)/0.918 |
| N. mutabilis 1 versus Alatae & N. sylvestris | 603 (949)/0.573; 746 (1269)/0.400; 1169 (2078)/0.769; 1311 (2226)/0.656 |
| N. spegazzinii versus Noctiflorae & Petunioides | 262 (321)/0.046; 837 (1880)/0.566 |
| N. wigandioides versus Paniculatae & Undulatae | 306 (905)/0.946; 531 (1325)/0.396; 661 (1728)/0.623; 804 (1932)/0.470 |
| MADS1/FUL | |
| N. linearis versus Noctiflorae & Petunioides | 511 (1130)/0.776; 766 (1424)/0.229 |
| N. noctiflora & N. petunioides versus Noctiflorae | 130 (328)/0.996; 353 (573)/0.991; 556 (983)/0.110; 787 (1249)/0.614; 850 (1318)/0.531 |
| N. spegazzinii versus Noctiflorae & Petunioides | 394 (602)/0.292; 526 (1145)/0.482; 670 (1320)/0.164 |
| WAXY/GBSSI | |
| N. acaulis versus Noctiflorae & Petunioides | 703 (758)/0.411 |
| Tomentosae versus ingroup minus N. acaulis | n/a |
See supplementary table S2 (Supplementary Material online) for further details of sequences included in each data set.
Relative to the aligned length of the data sets, see supplementary table S2, Supplementary Material online; numbers in parentheses indicate the position of breakpoints in the full data set.
Results of RDP3 Recombination Analyses.
| Data Seta | Position of Breakpointb | Methods Detecting Event /P Valuec | Recombinant(s) (Minor/Major Parent[s])d |
| ADH | |||
| N. alata 12609 1 versus Alatae | Ue | SS:0.000; 3S:0.004 | N. alata 12609 1 (unknown/Alatae) |
| N. acaulis versus Noctiflorae & Petunioides | n/a | n/a | n/a |
| N. glauca versus Noctiflorae & Petunioides | n/a | n/a | n/a |
| N. glutinosa versus Paniculatae, Tomentosae & Undulatae | n/a | n/a | n/a |
| N. linearis versus Noctiflorae & Petunioides | n/a | n/a | n/a |
| N. miersii versus Noctiflorae & Petunioides | n/a | n/a | n/a |
| N. spegazzinii versus Noctiflorae & Petunioides | 460 (512) | M:0.006; 3S:0.009 | N. spegazzinii (unknown/Petunioides) |
| N. wigandioides versus Paniculatae & Undulatae | n/a | n/a | n/a |
| GLO/PI | |||
| Tomentosae versus ingroup | 243 (1256)-1073 (2206) | C:0.004; M:0.004; SS:0.000; 3S:0.000 | Tomentosae (N. acaulis, N. glauca, N. mutabilis/N. benavidesii, N. cordifolia, N. glutinosa, N. knightiana, N. paniculata, N. solanifolia, Trigonophyllae) |
| LFY/FLO | |||
| N. bonariensis 2, N. alata 2369 & 12906 1 versus Alatae | 471 (539) | B:0.000; C:0.003; G: 0.006; L:0.000; M:0.004; SS:0.000; 3S:0.000 | N. bonariensis 2, N. alata 2369 & 12906 1 (N. mutabilis 2 & N. forgetiana 2/forgetiana 1 & N. bonariensis 3) |
| N. glauca versus Noctiflorae & Petunioides | 514 (1231) | L:0.000; M:0.002; SS:0.000; 3S:0.047 | N. glauca (unknown/N. acaulis, N. noctiflora) |
| N. glutinosa versus Paniculatae, Tomentosae & Undulatae | 488 (1251)–746 (1835) | B:0.005; L:0.000; SS:0.000 | N. glutinosa (N. benavidesii, N. cordifolia, N. raimondii, N. solanifolia/ N. undulata) |
| N. linearis versus Noctiflorae & Petunioides | n/a | n/a | n/a |
| N. longiflora & N. plumbaginifolia versus Alatae & N. sylvestris | U | B:0.013; C:0.013; L:0.000; M:0.000; SS:0.000; 3S:0.000 | N. longiflora & N. plumbaginifolia (N. sylvestris/Alatae) |
| N. miersii versus Noctiflorae & Petunioides | 322 (837) | B:0.005; C:0.001; L:0.000; M:0.022; SS:0.000; | N. miersii (N. corymbosa, N. pauciflora/N. noctiflora) |
| N. mutabilis 1 versus Alatae & N. sylvestris | U | M:0.004; SS:0.000; 3S:0.000 | N. mutabilis 1 (N. sylvestris/N. bonariensis 1, 3 & N. alata 12906 2) |
| N. spegazzinii versus Noctiflorae & Petunioides | 488 (1188)–867 (1910) | L:0.000; SS:0.000 | N. spegazzinii (Petunioides/unknown) |
| N. wigandioides versus Paniculatae & Undulatae | 567 (1370)–754 (1873) | B:0.000; G:0.022; SS:0.040; 3S:0.000 | N. wigandioides (N. benavidesii, N. cordifolia, N. raimondii, N. solanifolia/N. thyrsiflora) |
| MADS1/FUL | |||
| N. linearis versus Noctiflorae & Petunioides | 451 (670) & U | B:0.016; SS:0.040 & C:0.013; M:0.033; 3S:0.025 | N. linearis (N. acuminata, N. corymbosa, N. pauciflora/Noctiflorae) & (N. miersii/N. glauca) |
| N. noctiflora & N. petunioides versus Noctiflorae | U | B:0.001; C:0.010; G:0.000; L:0.026; M:0.004; 3S:0.030 | N. noctiflora, N. petunioides 1 & 2 (N. noctiflora & N. petunioides/N. noctiflora & N. petunioides) |
| N. spegazzinii versus Noctiflorae & Petunioides | 272 (473)–766 (1424) | L:0.000; SS:0.000 | N. spegazzinii (N. corymbosa & N. miersii/Noctiflorae) |
| WAXY/GBSSI | |||
| N. acaulis versus Noctiflorae & Petunioides | n/a | n/a | n/a |
| Tomentosae versus ingroup minus N. acaulis | U | M:0.016; SS:0.000; 3S:0.000 | Tomentosae (Undulatae/N. alata, N. longiflora, N. miersii, N. mutabilis & N. plumbaginifolia) |
See supplementary table S2 (Supplementary Material online) for further details of sequences included in each data set.
Relative to the aligned length of the data sets, see supplementary table S2, Supplementary Material online. Numbers in parentheses indicate the position of breakpoints relative to the full data set for each gene. RDP attempts to detect a start and end of each breakpoint; in some cases, only one of these is determined with any certainty.
Only those events that gain significant support from >1 method are reported. Methods are B: Bootscanning; C: Chimaera; G: GENECONV; L: LARD; M: Maxchi; SS: SiSscan; and 3S: 3Seq. Highest acceptable P value was set to 0.05. Additional methods may have detected the same event but not with significant support.
RDP3 suggests parental sequences from among the taxa in the alignment; where all members of a section other than putative recombinants are identified as parental sequences then the sectional name is given (e.g., Noctiflorae); otherwise, individual taxon names are given. Note: recombination may have involved ancestral members of these lineages, rather than any of the extant taxa.
Precise breakpoint undetermined: cases where neither the start nor end of the breakpoint is certain (possibly due to superimposed recombination events).
Results of PHI Recombination Analyses.
| Data Set a | Evidence for Recombination | P Value |
| ADH | ||
| N. alata 12609 1 versus Alatae | Yes | 0.000 |
| N. acaulis versus Noctiflorae & Petunioides | No | 0.109 |
| N. glauca versus Noctiflorae & Petunioides | No | 1 |
| N. glutinosa versus Paniculatae, Tomentosae & Undulatae | No | 0.105 |
| N. linearis versus Noctiflorae & Petunioides | No | 1 |
| N. miersii versus Noctiflorae & Petunioides | No | 0.079 |
| N. spegazzinii versus Noctiflorae & Petunioides | No | 1 |
| N. wigandioides versus Paniculatae & Undulatae | No | 0.069 |
| GLO/PI | ||
| Tomentosae versus ingroup | No | 0.976 |
| LFY/FLO | ||
| N. bonariensis 2, N. alata 2369 & 12906 1 versus Alatae | Yes | 0.000 |
| N. glauca versus Noctiflorae & Petunioides | No | 0.070 |
| N. glutinosa versus Paniculatae, Tomentosae & Undulatae | No | 0.124 |
| N. linearis versus Noctiflorae & Petunioides | No | 0.353 |
| N. longiflora & N. plumbaginifolia versus Alatae & N. sylvestris | Yes | 0.000 |
| N. miersii versus Noctiflorae & Petunioides | Yes | 0.004 |
| N. mutabilis 1 versus Alatae & N. sylvestris | Yes | 0.000 |
| N. spegazzinii versus Noctiflorae & Petunioides | No | 0.296 |
| N. wigandioides versus Paniculatae & Undulatae | No | 0.079 |
| MADS1/FUL | ||
| N. linearis versus Noctiflorae & Petunioides | No | 0.886 |
| N. noctiflora & N. petunioides versus Noctiflorae | No | 0.115 |
| N. spegazzinii versus Noctiflorae & Petunioides | No | 0.778 |
| WAXY/GBSSI | ||
| N. acaulis versus Noctiflorae & Petunioides | No | 0.816 |
| Tomentosae versus ingroup minus N. acaulis | Yes | 0.000 |
See supplementary table S2 (Supplementary Material online) for further details of sequences included in each data set.
Inference of Breakpoint Position and Recombinant/Parental Sequences
Numbers of breakpoints inferred per data set by GARD varied between one and five; levels of support for breakpoints from the AICc also vary considerably (0.031 to 1). In some cases, a breakpoint was detected at the same position in several different putative recombinants. For example, breakpoints corresponding to positions 512 and 1,008 in the ADH alignment for the N. glauca, N. miersii, and N. spegazzinii versus Noctiflorae and Petunioides data sets (table 1). This finding suggests either that several recombinant sequences are derived from the same ancestral recombination event or that the breakpoints are false positives caused by some feature of the sequences other than recombination (e.g., rate heterogeneity). Most of the breakpoint positions detected by RDP3 do not correspond precisely to breakpoints detected by GARD (tables 1 and 2), with two exceptions; those at position 460 in the ADH N. spegazzinii versus Noctiflorae and Petunioides data set and position 703 in the WAXY/GBSSI N. acaulis versus Noctiflorae and Petunioides data set (this event is not shown in table 2 as it was detected by only a single method). Several other breakpoints detected by methods in RDP3 are within <100 bp of a breakpoint detected by GARD, but only two of these correspond to the best supported breakpoint found by GARD (those at position 514 for LFY/FLO N. glauca vs. Noctiflorae and Petunioides data set and 451 for the MADS1/FUL N. linearis vs. Noctiflorae and Petunioides data set; see table 2). All breakpoints inferred by RDP3 are located within introns, whereas eight breakpoints inferred by GARD are located in exons; those at positions 233 and 639 in ADH, 2078, 2226, 2233, and 2285 in LFY/FLO, 573 in MADS1/FUL, and 758 in WAXY/GBSSI.
Table 2 lists sequences identified by RDP3 as recombinants (“daughter” sequences) and those identified as “parent” sequences (making either “major” or “minor” contributions to daughter sequences). Both putative parents are identified for 11 of the data sets. In two cases, recombination is hypothesized within a single section: sect. Alatae for LFY/FLO and sect. Noctiflorae for MADS1/FUL. The other nine cases infer intersectional recombination events, including two between members of sects. Paniculatae and Undulatae and three between sects. Noctiflorae and Petunioides.
Gene Trees
Results of MP (see fig. 1 and supplementary fig. S2, Supplementary Material online) and Bayesian inference (BI) for the complete data sets (i.e., including recombinant sequences) were highly congruent. A small number of clades were recovered under BI with ≥0.95 posterior probability (PP) that were not in the strict consensus trees from MP analyses (see supplementary fig. S3, Supplementary Material online; supplementary table S5, lists models applied during BI, Supplementary Material online) In each of the five individual gene trees, sequences from the ingroup taxa form highly supported groups (fig. 1). However, within the ingroup, there is substantial discordance between the individual gene-tree topologies and between these topologies and those obtained with plastid data (Clarkson et al. 2004) and the internal transcribed spacer (ITS) of nrDNA (Chase et al. 2003). Four of the seven diploid sections of Nicotiana that contain more than a single species (see supplementary table S1, Supplementary Material online), Alatae, Noctiflorae, Petunioides, and Undulatae, are nonmonophyletic in the majority of gene trees (fig. 1a–e). These sections also correspond to those in which the greatest evidence for interallelic recombination was detected (tables 1–3). When data sets were analyzed with recombinant sequences removed, all sections are recovered as well-supported monophyletic groups in at least three of the five gene trees, but no section is resolved as monophyletic in all five trees (supplementary fig. S4, Supplementary Material online). Nevertheless, trees obtained from analyses without recombinant sequences are highly congruent with trees based on analyses of complete data sets; all but one of the well-supported nodes (i.e., BP ≥ 70 and PP ≥ 95) that involve nonrecombinant sequences in the trees based on the complete data sets (fig. 1) are also recovered from phylogenetic analyses with recombinants excluded (supplementary fig. S4, Supplementary Material online). For sect. Alatae, several species yield multiple sequence for ≥one gene region (fig. 1, supplementary fig. S4, Supplementary Material online). In some instances, sequences form species-specific clusters, but in most cases, sequences from different species are intermingled. This pattern suggests incomplete lineage sorting or recent hybridization between the n = 9 species (most probably under glasshouse conditions; all n = 9 species of sect. Alatae are interfertile and can be crossed to produce artificial hybrids, e.g., Ippolito et al. 2004). The greatest degree of incongruence between gene trees is found for sects. Noctiflorae and Petunioides; the results for these groups are described below.
Section Noctiflorae is recovered as monophyletic in a single gene tree; MADS1/FUL (BP 99, PP 1.0; fig. 1d). Section Petunioides is recovered as a well-supported group in the WAXY/GBSSI tree (BP 87, PP 1.0; fig. 1e) and would also be monophyletic in the MADS1/FUL tree (although poorly supported) if not for the N. palmeri sequence (sect. Trigonophyllae) nesting within it. Both sections are resolved as polyphyletic within the ADH tree (fig. 1a). For sect. Noctiflorae, polyphyly results from the recombinant N. glauca sequence being resolved with sect. Petunioides with moderate-to-high support (BP 86; PP 1.0). The nonmonophyly of sect. Petunioides results from the placement of the recombinant N. linearis sequence as sister to a clade composed of members of sect. Noctiflorae. Although the grouping of N. linearis with sect. Noctiflorae receives <50% bootstrap support, it is well supported under BI (PP 0.98; see supplementary fig. S3a, Supplementary Material online). Several ADH sequences from sects. Noctiflorae and Petunioides, in addition to those for N. glauca and N. linearis, are inferred as recombinants by GARD (table 1), although only in the case of N. spegazzinii was recombination also detected by other methods (see table 2). Analysis of the ADH data set with putative recombinants excluded results in an increase in bootstrap support for relationships between the remaining sequences from these sections (supplementary fig. S4a, Supplementary Material online). Trees inferred from putatively nonrecombinant fragments of the ADH data set provide some support for the results of the GARD recombination analysis with one portion of the N. glauca sequence grouping more closely with those from sect. Noctiflorae and the other with sect. Petunioides, both with high bootstrap support (fig. 2a and b). However, similar support for the recombinant nature of the other sequences (those from N. acaulis, N. linearis, N. miersii, and N. spegazzinii) is not recovered (e.g., supplementary fig. S5a–c,g–i, Supplementary Material online).
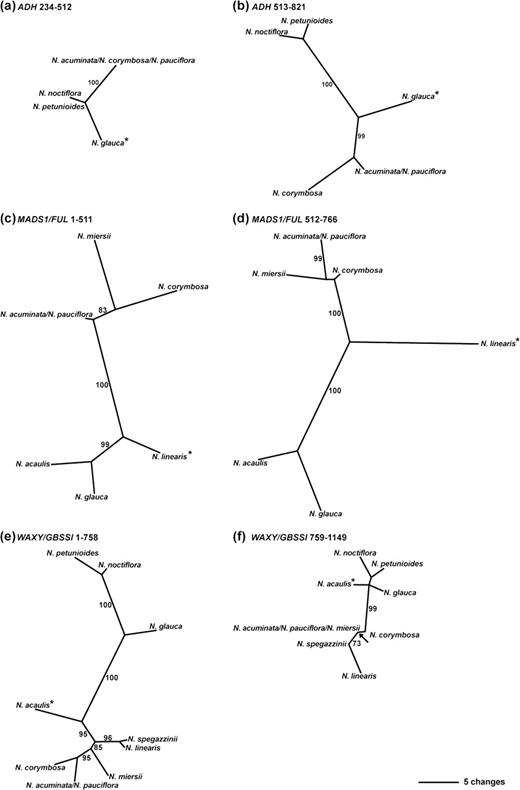
MPTs reconstructed from putative nonrecombinant fragments of the ADH (a,b), MADS1/FUL (c,d), and WAXY/GBSSI (e,f) data sets for members of sects. Noctiflorae and Petunioides; data sets were partitioned along breakpoints identified by GARD (see main text for details). Asterisks indicate sequences identified as recombinants. Branch lengths are shown with DELTRAN optimization; see bottom right-hand corner for scale-bar. Numbers on branches indicate BPs of ≥70. (a) Single MPT inferred from characters 234–512 of the ADH N. glauca versus Noctiflorae and Petunioides data set. (b) Single MPT inferred from characters 513–821 of the ADH N. glauca versus Noctiflorae and Petunioides data set. (c) One of two MPTs inferred from characters 1–511 of the MADS1/FUL N. linearis versus Noctiflorae and Petunioides data set. (d) Single MPT inferred from characters 512–766 of the MADS1/FUL N. linearis versus Noctiflorae and Petunioides data set. (e) Single MPT inferred from characters 1–758 of the WAXY/GBSSI N. acaulis versus Noctiflorae and Petunioides data set. (f) One of eight MPTs inferred from characters 759–1,149 of the WAXY/GBSSI N. acaulis versus Noctiflorae and Petunioides data set; an arrow indicates the node collapsing in the strict consensus tree.
In the GLO/PI tree, sect. Noctiflorae is polyphyletic, whereas sect. Petunioides is unresolved. Sequences from N. acaulis and N. glauca form a pair; the other sequence from sect. Noctiflorae (N. petunioides) is sister to N. linearis and N. spegazzinii (both sect. Petunioides), albeit with weak support (fig. 1b). The two remaining sequences from members of sect. Petunioides (N. miersii and N. corymbosa) form a well-supported pair (BP 86, PP 1.0) but are unresolved with respect to the other sequences from this section. Removal of the putatively recombinant sect. Tomentosae sequences does not alter the topology for sects. Noctiflorae and Petunioides (supplementary fig. S4b, Supplementary Material online).
Sections Noctiflorae and Petunioides are polyphyletic in the LFY/FLO gene tree (fig. 1c). The sequence from N. glauca (identified as recombinant by GARD and RDP3) is placed sister to N. sylvestris and members of sect. Alatae (with poor bootstrap support, 63%, but a PP of 0.99). For sect. Petunioides, the putatively recombinant sequences (from N. linearis, N. miersii, and N. spegazzinii) are grouped together with moderate-to-high support (BP 76, PP 1.0) but placed within a clade containing members of sect. Alatae and Sylvestres rather than with the rest of sect. Petunioides. Analysis of nonrecombinant portions of the LFY/FLO data set reveals that sequences from N. glauca and N. miersii either cluster most closely with sect. Noctiflorae or more closely with sect. Petunioides, depending on the data partitions analyzed (supplementary fig. S5d,e,j–n, Supplementary Material online).
Sequences from sect. Noctiflorae form a strongly supported group (BP 99, PP 1.0) in the WAXY/GBSSI tree (fig. 1e) with the exception of N. acaulis, which is sister to sect. Petunioides with poor bootstrap support (BP < 50), but a PP 0.95 (fig. 1e; supplementary fig. S3e, Supplementary Material online). Low bootstrap support for the placement of N. acaulis can be explained by the recombinant nature of this sequence. The table of bipartition frequencies from the bootstrap analysis including the full N. acaulis sequence (data not shown) shows that this sequence groups with those from sect. Petunioides in 49.9% of pseudoreplicates and with sect. Noctiflorae in 22.3% of pseudoreplicates. Furthermore, if the N. acaulis sequence is partitioned along the recombination breakpoint and both fragments analyzed simultaneously with the other full-length sequences, N. acaulis groups with sect. Petunioides with a BP of 76 on the basis of characters 1–758 and with sect. Noctiflorae with a BP of 80 on the basis of characters 759–1149 (supplementary fig. S6, Supplementary Material online). Analysis of the WAXY/GBSSI data set with recombinants removed recovers an identical topology for the nonrecombinant sequences to that reconstructed from the complete data set (compare fig. 1e with supplementary fig. S4e, Supplementary Material online), although bootstrap support for several nodes increases slightly.
Lento Plots
Lento plots, constructed for sequences from sects. Noctiflorae and Petunioides (fig. 3), reveal both conflict with splits represented in the strict consensus trees from the complete data sets (fig. 1) and support for splits not found in these trees, supporting the inference of reticulation within these data sets. In the ADH Lento plot (fig. 3a), the sum of support for splits conflicting with the split placing N. linearis with members of sect. Noctiflorae (column 17) outweighs the support for the split itself. This is also the case for splits placing N. glauca (column 15) and N. spegazzinii (column 18) with members of sect. Petunioides. For the LFY/FLO data set (fig. 3b), support is found for a split that groups N. glauca, N. linearis, N. miersii, and N. spegazzinii together (column 14), but there is also substantial conflict with this split. An incompatible split is also found that places the N. glauca sequence with sect. Noctiflorae (column 27), supporting the inferred recombinant nature of this sequence. In the MADS1/FUL plot (fig. 3c), competing splits are found that place the N. linearis and N. spegazzinii sequences with either sect. Noctiflorae or sect. Petunioides (columns 17 and 19); this is congruent with the RDP3 results (table 2) that identify members of these two sections as the parents of the N. linearis and N. spegazzinii sequences. In the Lento plot for the WAXY/GBSSI data set (fig. 3d), incompatible splits are found that place the N. acaulis sequence with either sect. Noctiflorae (column 8) or sect. Petunioides (column 16), again supporting the results of recombination analysis (table 2). Lento plots for sect. Alatae, Paniculatae, Tomentosae, and Undulatae (data not shown) revealed evidence for substantial conflict in the data sets but in general did not provide clear evidence for incompatible splits to support the recombination events detected during the recombination analyses.
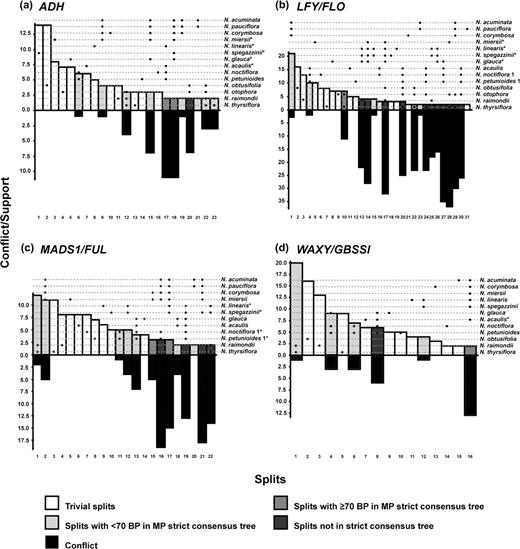
Lento plots for sects. Noctiflorae and Petunioides, plus outliers, constructed from sets of gene sequences testing positive for recombination (see main text and tables 1–3 for further details); (a) ADH; (b) LFY/FLO; (c) MADS1/FUL; and (d) WAXY/GBSSI. Bars above the X-axis show all splits supported by ≥two substitutions. Bars below the X-axis represent the sum of support for all splits that are incompatible with the split directly above. The number of substitutions that support, or conflict with, a given split is shown along the Y-axis. Taxa represented in each plot are listed on the right-hand side; asterisks indicate sequences identified as recombinants; black dots indicate taxa represented on one side of each split (dashed lines act as a visual guide, to connect dots to taxon names, and do not relate to values on the Y-axis). Columns are numbered from left to right for ease of reference to the main text. Note: where multiple sequences occur in a single taxon, numbers are not necessarily equivalent between data sets (e.g., N. noctiflora 1 for LFY/FLO and N. noctiflora 1 for MADS1/FUL).
Supernetworks
Figure 4. shows filtered supernetworks reconstructed from trees inferred when data sets were partitioned along the breakpoints detected by GARD (fig. 4a; displaying splits found in ≥11 of the 34 input trees) or breakpoints detected by RDP3 (fig. 4b; displaying splits found in ≥6 of the 18 input trees). In figure 4a, the part of the network containing sects. Pamiculatae and Tomentosae is more or less tree-like. There is greater evidence for conflict in the rest of the network, illustrating the incongruence found between different data partitions. For sects. Noctiflorae and Petunioides, where many breakpoints were inferred by GARD, relationships between the species are clearly not tree-like. In figure 4b, there is a greater degree of conflict. The increased conflict in this network, compared with that in figure 4a, reflects the fact that fewer breakpoints were detected by RDP3, and therefore partitions of the data inferred as nonrecombinant were larger than those identified by GARD. The small size of many nonrecombinant partitions inferred by GARD resulted in highly unresolved input trees (in addition, all nodes with BP < 70 were collapsed; results not shown), and therefore, less incongruence is displayed within the resulting network (fig. 4a).
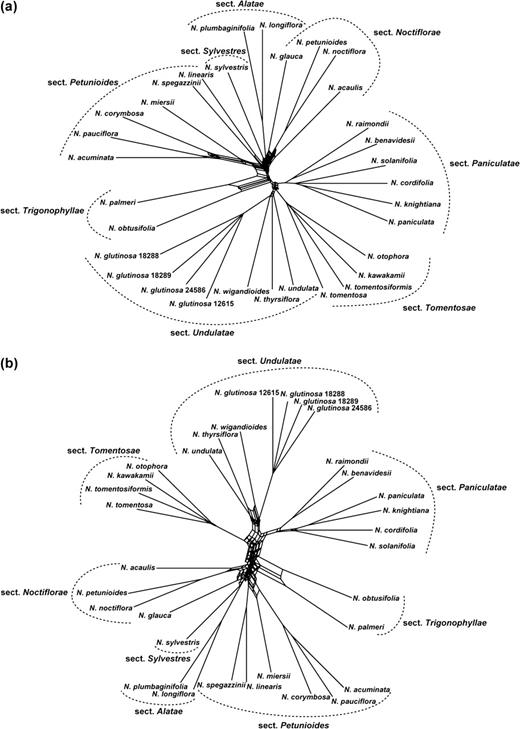
Filtered supernetworks for the ingroup taxa, constructed from combined sets of partial trees inferred from gene regions partitioned along recombination breakpoints identified by GARD and RDP3. (a) Supernetwork reconstructed from 34 partial trees using GARD breakpoints; all splits in the network are present in ≥11 input trees. (b) Supernetwork reconstructed from 18 partial trees using RDP3 breakpoints; all splits in the network are present in ≥six input trees.
Filtered supernetworks for sects. Noctiflorae and Petunioides (the groups of taxa showing the greatest evidence of recombination) can be seen in supplementary figure S7, Supplementary Material online, with no difference obtained between that using input trees inferred when data sets were partitioned along the breakpoints detected by GARD and that using RDP3 breakpoints. In each network, only two non–tree-like portions are recovered one involving N. acaulis/N. glauca and one involving N. corymbosa/N. miersii (supplementary fig. S7, Supplementary Material online). These splits are present in ≥12 of the 37 input trees for the “GARD” network (supplementary fig. S7a, Supplementary Material online) and ≥6 of the 22 input trees for the “RDP3” network (supplementary fig. S7b, Supplementary Material online) The supernetworks for sects. Noctiflorae and Petunioides reveal that the difference in breakpoint positions inferred by GARD and RDP3 has not resulted in different splits being inferred from the input trees. This is likely due to the fact that for sects. Noctiflorae and Petunioides, the sequences from taxa with putative reticulate origins are placed as sister to groups of sequences from nonreticulate taxa in the input trees, rather than nesting within them, although conflict is indicated by the differing branch lengths between the likely recombinant and its putative parental lineages (see fig. 2; supplementary fig. S5, Supplementary Material online).
Discussion
Reticulate Evolution of Nicotiana
Goodspeed (1954) presented a complex scenario of reticulate evolution in Nicotiana, comprising a series of homoploid and polyploid hybridization events. These hypotheses were the culmination of 30 years of study, including detailed examination of the distribution, morphology, and cytology of all species in the genus. Our results provide new evidence to support an important role for reticulate evolution in the diploid species of this genus.
Evidence for Intragenic Recombination
Chimeric gene sequences were detected for several species that could result from recombination between divergent alleles that have either been retained as a result of incomplete lineage sorting or between distinct parental alleles derived from hybridization or introgression. It is also possible that, rather than indicating intragenic recombination between divergent alleles, some events detected could provide evidence for intergenic recombination between closely related paralogues. However, this scenario is less likely as it would also require multiple occurrences of differential gene loss to produce the patterns observed. We identified five diploid sections in which one or more species have recombinant sequences that appear to have arisen via interallelic reticulation events. In the case of sect. Tomentosae, a single recombination event prior to the diversification of the extant species is inferred for two genes, GLO/PI and WAXY/GBSSI. However, Lento plots do not support this inference, and the signal of recombination could represent a false positive. Recombinants are also detected for two genes in sect. Alatae. Two events apparently involve intrasectional recombination; both inferred parental sequences are from sect. Alatae. This may result from interallelic recombination subsequent to recent hybridization events (such as between individuals maintained in ex situ collections). For the LFY/FLO gene, sequences from three species (N. longiflora, N. plumbaginifolia, and N. mutabilis) are inferred as recombinants between members of sect. Alatae and N. sylvestris. As this pattern is not detected for any other gene, it more likely results from recombination between separate alleles retained via incomplete lineage sorting. However, for three sections, Noctiflorae, Petunioides, and Undulatae, recombinants with parents from different sections are found from multiple genes in several species. This indicates recombination between distinct parental alleles, potentially subsequent to intersectional hybridization. For example, ADH, LFY/FLO, and MADS1/FUL sequences from N. linearis and N. spegazzinii are inferred as recombinants between alleles from sects. Noctiflorae and Petunioides. ADH and WAXY/GBSSI sequences from N. acaulis are inferred as recombinants between alleles from sects. Noctiflorae and Petunioides, and ADH and LFY/FLO sequences from N. thyrsiflora are identified as recombinants between alleles from sects. Paniculatae and Undulatae. Moreover, likely recombination between members of sects. Noctiflorae and Petunioides has also been detected for a region of the ncpGS gene (Clarkson et al. 2009). These examples, where the same pattern is detected in more than one gene, provide stronger evidence for reticulate origins of taxa; incomplete lineage sorting is unlikely to produce such results if these multiple genes are unlinked.
The fact that recombination is detected for all five genes included in this study, as well as for ncpGS (Clarkson et al. 2009), suggests that intragenic recombination is relatively common. However, the dramatic difference between results from the 13 recombination methods used here, ranging from 96% of data sets testing positive for recombination with GARD to 0% with the RDP method in RDP3, raises questions regarding whether all of the inferred events are real. Alternatively, it could illustrate that some methods lack the power to detect recombination in real data sets. Tests of recombination detection methods with empirical and simulated data have found that Chimaera, MaxChi PhylPro, and GENECONV are among the most powerful of methods while also lacking an excessive rate of false positives (Posada and Crandall 2001; Posada 2002). However, Bruen et al. (2006) reported that under certain conditions, MaxChi may show a high false positive rate, falsely inferring recombination in more than 50% of cases. In addition, even the most efficient methods are not particularly powerful (Wiuf et al. 2001) and may require several recombination events in a data set before recombination can be detected (e.g., at least 12 recombination events to detect recombination 80% of the time; Posada and Crandall 2001). For example, in a study of known recombination events in mitochondrial DNA, White and Gemmell (2009) found that, although PHI was able to routinely detect recombination in simulated data sets, it could not detect recombination in real data. In the current study, GARD detects more recombination than any other test, including evidence for recombination in five data sets not found by any other method. Kosakovsky Pond et al. (2006a) used the GARD multiple breakpoint method to analyze simulated data and found that the number of breakpoints was overestimated in some cases. Furthermore, if the evolutionary model underlying the data differed from that assumed by the method then the most accurate breakpoint placement possible (i.e., at the variable site closest to the true breakpoint) was achieved in only 20% of cases (Kosakovsky Pond et al. 2006a). This suggests that under certain conditions, the breakpoint locations inferred by the GARD algorithm may not be particularly accurate, and it may infer more breakpoints than are actually present. This fact could explain the disparity between the results obtained with GARD and RDP3 (tables 1 and 2) in terms of the number and location of breakpoints. Nevertheless, the relative performance of recombination detection methods in terms of accuracy in inferring breakpoint position and identifying recombinant and parental sequences has not been assessed (Lemey and Posada 2009). Thus, it cannot be concluded whether the reconstruction of breakpoints is more accurate using the methods within RDP3 than it is with GARD.
Evidence for Homoploid Hybrid Speciation
On the basis of data from five low-copy nuclear genes, three diploid species of Nicotiana, N. linearis, N. spegazzinii, and N. glauca, can be identified as having likely hybrid origins. These species belong to two sections, Noctiflorae and Petunioides, and it appears that multiple reticulation events have occurred between these groups (or species ancestral to the extant species). The best candidate for a homoploid hybrid species of Nicotiana is N. linearis. In the current classification (Knapp et al. 2004), N. linearis is placed in sect. Petunioides, reflecting the relationship recovered from the analysis of plastid DNA data (Clarkson et al. 2004) and data from the nontranscribed spacer (NTS) of 5S nrDNA (Clarkson et al. 2005). However, there is incongruence in the placement of N. linearis in gene trees based on separate nrDNA regions, with ITS data resolving this species with sect. Noctiflorae (Chase et al. 2003) albeit with poor support. Data from low-copy nuclear genes resolve N. linearis either as a well-supported member of sect. Petunioides (for WAXY/GBSSI; fig. 1e, supplementary fig. S4e, Supplementary Material online) or with one member of sect. Noctiflorae in the case of trees for the GLO/PI (fig. 1b, supplementary fig. S4b, Supplementary Material online) and ncpGS regions (the ncpGS sequence from N. linearis is likely recombinant, with one parent from sect. Noctiflorae; Clarkson et al. 2009), but with poor support. Furthermore, for three of the five nuclear gene regions analyzed in the current study (ADH, LFY/FLO, and MADS1/FUL) the sequence for N. linearis is inferred as a recombinant between members of sect. Noctiflorae and Petunioides. Our results show that in two cases, ADH and MADS1/FUL, the recombinant N. linearis sequence is placed with one of its progenitor lineages: sect. Noctiflorae in the case of the ADH tree (with low BP but a PP of 0.98); sect. Petunioides in the MADS/FUL tree (with low support). Parsimony analysis of putatively nonrecombinant fragments of MADS1/FUL shows that data from one portion of the gene groups N. linearis with sect. Noctiflorae with high support (fig. 2c). This supports the inference that the recombinant nature of the N. linearis sequence results in poor support for its placement in the MADS1/FUL tree (fig. 1d). Further evidence comes from the MADS1/FUL Lento plot (fig. 3c), which recovers splits that either place N. linearis with sect. Petunioides or sect. Noctiflorae. The ADH Lento plot also provides support for the reticulate nature of the N. linearis ADH sequence (fig. 3a), illustrating a large amount of conflict with the split placing N. linearis with sect. Noctiflorae. Taken together, the results from recombination analyses, gene trees, and Lento plots provide evidence for contributions from both sect. Noctiflorae and sect. Petunioides within the genome of N. linearis and suggest an origin for this species through homoploid hybridization between members of sect. Noctiflorae and sect. Petunioides (or their ancestors). The fact that extant members of these sections have overlapping geographic distributions, occur in similar habitats, and are interfertile (Goodspeed 1954) suggests that opportunities for hybridization may occur in nature.
The second species of putative hybrid origin is N. spegazzinii (sect. Petunioides). In four of the five gene trees in this study, sequences from N. spegazzinii and N. linearis form a highly supported pair (BP ≥ 95, PP 1.0); as for N. linearis, the N. spegazzinii ADH, LFY/FLO, and MADS1/FUL sequences are inferred as recombinants between members of sects. Noctiflorae and Petunioides (and possibly also for the ncpGS region; Clarkson et al. 2009). Previous studies based on ITS data (Chase et al. 2003) and ncpGS data Clarkson et al. 2009) also support a close sister relationship between these two taxa (N. spegazzinii was not included in the plastid or NTS trees; Clarkson et al. 2004, 2005). Therefore, N. spegazzinii and N. linearis may have diverged subsequent to a single homoploid hybridization event that gave rise to their common ancestor. In the ADH tree, the N. spegazzinii sequence does not group with N. linearis as sister to sect. Noctiflorae; rather, it is placed with sect. Petunioides (BP 58, but PP of 0.98). However, this result could be explained by recombination occurring after speciation; if both parental alleles of ADH were present at the time of speciation subsequent independent recombination between these alleles in the two species could result in both containing chimeric ADH sequences that differ in their parental bias. Support for the reticulate nature of the N. spegazzinii ADH sequence can be seen in the Lento plot (fig. 3a, column 18), which reveals a large amount of conflict with the split placing this species with sect. Petunioides. N. spegazzinii was suggested by Goodspeed (1954), on the basis of its intermediate inflorescence morphology, to have arisen via intrasectional homoploid hybridization between N. linearis and N. acuminata (both sect. Petunioides). However, our results point to a single reticulate origin for both N. spegazzinii and N. linearis via intersectional hybridization between sect. Noctiflorae and sect. Petunioides.
The third likely homoploid hybrid is N. glauca (sect. Noctiflorae). Data from previous phylogenetic studies (Chase et al. 2003; Clarkson et al. 2004) place N. glauca with sect. Noctiflorae. In the present study, N. glauca ADH and LFY/FLO sequences are identified as recombinants. In the ADH tree (fig. 1a), N. glauca groups with sect. Petunioides (BP 86, PP 1.0), but on the basis of one fragment of the gene region (characters 234–512; fig. 2a), N. glauca clusters with members of sect. Noctiflorae. In the LFY/FLO tree, N. glauca is placed with N. sylvestris and recombinant sequences from sect. Alatae (with poor bootstrap support but a high PP). However, both parsimony analyses of nonrecombinant fragments of LFY/FLO and the Lento plot for this data set show support for the placement of N. glauca with sect. Noctiflorae (fig. 3b, supplementary fig. S5k, Supplementary Material online) and thus agree with RDP3 in identifying members of sect. Noctiflorae as the major parent for the N. glauca sequence (table 2). Although the other parent in the recombination event is uncertain, two portions of the LFY/FLO data set (characters 250–1,188 and 1,339–1,803; supplementary fig. S5j, l, Supplementary Material online) group N. glauca more closely with sequences from sect. Petunioides than with sect. Noctiflorae. Therefore, data from both ADH and LFY/FLO suggest that N. glauca may be a product of a hybridization event between members of sects. Noctiflorae and Petunioides or their ancestors. Notably N. glauca has become highly invasive outside of its native range (Goodspeed 1954), a trait associated with interspecific hybridization (Ellstrand and Schierenbeck 2000).
Implications for the Detection of Hybrids and Reconstruction of Reticulate Evolution
A phylogenetic approach to the identification of homoploid hybrid species has been promoted because reconstruction of multiple gene trees should result in conflicting tree topologies where hybrids are resolved with one or other of the parental lineages (Rieseberg 1997; Sang and Zhong 2000). However, recombination between alleles in hybrid taxa can confound this interpretation as recombinant alleles may group with neither of the two progenitors and instead a topology that differs from all of the true trees may be inferred (Posada and Crandall 2002). In addition to using gene tree incongruence to indicate evidence of hybridization, tree-based statistical tests for detection of hybrids have been developed, but these may also make the assumption of no intragenic recombination (e.g., Joly et al. 2009).
An example of the confounding effects of recombination on phylogenetic analysis can be seen in the LFY/FLO tree, in which sequences from N. linearis and N. spegazzinii are not resolved with either of their putative parental lineages (fig. 1c). Another recent example comes from Yuan and Olmstead (2008), who found that the position of a PHOT1 recombinant from Junellia uniflora (Verbenaceae) in the inferred phylogeny reflected neither of the alternative resolutions obtained from analyses of nonrecombinant fragments. Moreover, even if recombinant sequences do group with one parental lineage, we find that support for such relationships may be low or inconsistent between methods. In several cases, we find nodes where support from MP bootstrap analyses is at a level that can be considered poor (i.e., <70%), whereas posterior probabilities from BI provide what would normally be considered good support (i.e., ≥0.95). For example: BP<50 versus PP 0.98 for N. linearis in the ADH tree, BP<50 versus PP 0.95 for N. acaulis in the WAXY/GBSSI tree, and BP 63 versus PP 0.99 for N. glauca in the LFY/FLO tree. This illustrates that the nonparametric bootstrap may be more sensitive to recombination than is Bayesian analysis and that strong support may be obtained for the placement of recombinant sequences in trees inferred by BI such that there is no indication of the underlying conflict in the data.
Despite evidence that recombination can confound phylogenetic inference (Schierup and Hein 2000; Posada and Crandall 2002), many phylogenetic studies using nuclear gene data fail to test for recombination. Moreover, newly developed phylogenetic methods, such as those designed for species tree estimation (e.g., Ané et al. 2007; Kubatko et al. 2009), often assume that intragenic recombination does not occur (Edwards 2009). In their study of the effect of recombination on phylogeny reconstruction, Posada and Crandall (2002: 396) stated that “phylogenetic studies based on DNA sequences typically ignore the potential occurrence of recombination.” We find support for this statement. In a review of papers using nuclear gene sequence data for phylogenetic analyses of eukaryotes (excluding those using nrDNA or loci from non–pseudoautosomal parts of heterogametic sex chromosomes) published during 2008 in five journals that regularly feature molecular phylogenetic studies (Cladistics, Evolution, Molecular Biology and Evolution, Molecular Phylogenetics and Evolution, and Systematic Biology), only 27 of 248 studies (10.9%) mention conducting formal tests for recombination. Therefore, checks for recombination in DNA sequences prior to phylogeny reconstruction remain an exception rather than a routine practice, despite recommendations to the contrary (Posada and Crandall 2002; Kosakovsky Pond et al. 2006a). Perhaps one factor acting to delay widespread adoption of these methods is the plethora of programs available (see www.bioinf.manchester.ac.uk/recombination/programs.shtml). Indeed, Bruen et al. (2006: 2666) described the array of available methods as “bewildering,” and Kosakovsky Pond et al. (2006a: 1891) stated that using and integrating the results from multiple methods may be “excessively laborious.” However, it is strongly recommended that multiple methods be employed (Wiuf et al. 2001; Posada 2002; Posada et al. 2002), as no single method has been identified as optimal under all circumstances (Salminen and Martin 2009). Moreover, many methods appear to have low power to detect recombination events (Posada 2002; Posada and Crandall 2001; Wiuf et al. 2001). Our results in Nicotiana are in agreement with these conclusions, as results of the methods applied varied widely, and even apparently obvious examples of recombination (such as the N. acaulis WAXY/GBSSI sequence, where there is strong phylogenetic support for a single recombination breakpoint; fig. 2e and f; supplementary fig. S6, Supplementary Material online) were missed by the majority of methods.
Conclusion
Our results from Nicotiana show that intragenic recombination may be a relatively common occurrence and can provide evidence for distinct parental contributions within diploid species of likely reticulate origin (i.e., homoploid hybrid species). Moreover, these findings emphasize that recombination should be taken into account when aiming to detect hybrids using DNA-sequence data from regions that are capable of recombining (i.e., almost all DNA in all organisms; Schierup and Hein 2000). In addition, attempts to explore or reconstruct patterns of reticulate evolution using tree-based methods such as supernetworks (Huson et al. 2004) or concordance analysis (Ané et al. 2007; Baum 2007) will also require that data sets be partitioned into nonrecombinant fragments. Studies to evaluate how accurately the available methods infer breakpoint locations will be needed.
We thank members of the Molecular Systematics and Conservation Genetics sections at RBG, Kew, for advice and technical support on various aspects of this project, J. Timberlake for generating some of the ADH sequences used in this study, S.L. Kosakovsky Pond for running the single-breakpoint GARD analyses for the ADH and LFY/FLO data sets on the Applecross/San Diego Alliance cluster, and E.W. McCarthy, O. Paun, J. Tosh and two anonymous reviewers for helpful comments that allowed us to improve this manuscript. We also thank E.W. McCarthy for useful discussions on the sequencing and analysis of LFY/FLO, D.H. Huson for advice on the construction of supernetworks, and J. Tosh for assisting in the preparation of figures. This work was supported by the Natural Environment Research Council (NE/C511964/1 to A.R.L. and M.W.C.).
References
Author notes
Associate editor: Hervé Philippe
