


Abstract
DNA extracted from archaeological and paleontological remains is usually damaged by biochemical processes postmortem. Some of these processes lead to changes in the structure of the DNA molecule, which can result in the incorporation of incorrect nucleotides during polymerase chain reaction. These base misincorporations, or miscoding lesions, can lead to the inclusion of spurious additional mutations in ancient DNA (aDNA) data sets. This has the potential to affect the outcome of phylogenetic and population genetic analyses, including estimates of mutation rates and genetic diversity. We present a novel model, termed the delta model, which estimates the amount of damage in DNA data and accounts for its effects in a Bayesian phylogenetic framework. The ability of the delta model to estimate damage is first investigated using a simulation study. The model is then applied to 13 aDNA data sets. The amount of damage in these data sets is shown to be significant but low (about 1 damaged base per 750 nt), suggesting that precautions for limiting the influence of damaged sites, such as cloning and enzymatic treatment, are worthwhile. The results also suggest that relatively high rates of mutation previously estimated from aDNA data are not entirely an artifact of sequence damage and are likely to be due to other factors such as the persistence of transient polymorphisms. The delta model appears to be particularly useful for placing upper credibility limits on the amount of sequence damage in an alignment, and this capacity might be beneficial for future aDNA studies or for the estimation of sequencing errors in modern DNA.
Introduction
The postmortem degradation of nucleic acids presents a significant challenge to ancient DNA (aDNA) research. After death, DNA molecules are subject to hydrolytic and oxidative fragmentation and to cross-linking, which can adversely affect subsequent polymerase chain reaction (PCR)–based analyses (Pääbo 1989; Lindahl 1993; Handt et al. 1996; Höss et al. 1996). Ultimately, DNA damage leads to a reduction in both the number and the length of potential template molecules available for PCR amplification, limiting the utility of ancient sequences in subsequent analysis.
The forms of damage that are most problematic for genetic analyses are miscoding lesions, which do not necessarily hinder PCR replication but lead to the incorporation of erroneous bases during PCR. Miscoding lesions have been characterized in numerous aDNA analyses (Höss et al. 1996; Hansen et al. 2001; Hofreiter et al. 2001; Gilbert, Hansen, et al. 2003; Gilbert et al. 2007), but the relative importance of the various types of DNA damage remains contentious. This is at least partly due to the experimental difficulty in characterizing the miscoding lesions. Most statistical investigations into aDNA damage have relied on cloning to generate a distribution of mutations for individual samples. Cloned sequences can be derived from either of the complementary DNA strands; however, it has been difficult to distinguish between the actual damage event and the associated base modification on the complementary strand. As a consequence, Hansen et al. (2001) proposed that all types of miscoding lesions could be subdivided into 6 complementary groups (A → C/T → G; A → T/T → A; A → G/T → C; C → G/G → C; C → T/G → A; and C → A/G → T) and that the 2 most commonly observed changes in aDNA be referred to as Type I (A → G/T → C) and Type II (C → T/G → A) transitions. Recent analyses using emulsion-based clonal sequencing, which makes it possible to identify strand-specific damage, have shown that the majority of damage-derived miscoding lesions were Type II transitions (Stiller et al. 2006; Gilbert et al. 2007).
Several experimental protocols have been proposed in order to limit the number of damaged sequences available as template molecules for PCR, such as treatment with uracil-N-glycosylase (UNG) to eliminate modified uracil residues which result from the deamination of cytosine (Pääbo 1989; Hofreiter et al. 2001). Post-PCR cloning of amplification products can be used to visualize the spectrum of mutations at each site, with the aim of identifying the true sequence (e.g., Gilbert, Willerslev, et al. 2003; Shapiro et al. 2004), but it has been suggested that extensive cloning (>20 clones per fragment) might be required in order to achieve an acceptable degree of confidence in the accuracy of the sequence (Bower et al. 2005). Such experimental protocols are therefore expensive and time consuming and may not always be feasible, particularly for the large data sets required for population genetic analyses (e.g., Lambert et al. 2002; Shapiro et al. 2004). Additionally, when the amount of damage is high and the starting number of templates is very small, it might never be possible to eliminate the effects of damage completely from an aDNA data set.
Effect of Miscoding Lesions on Phylogenetic Analysis
The level of accuracy achieved in a sequencing project is a compromise between cost (both practical and economic) and coverage (taxonomic and/or genomic). For some purposes, such as identification of homologues, moderate sequence accuracy may suffice (States and Botstein 1991). For phylogenetic analyses, however, it is important to obtain nucleotide sequences that are as accurate as possible. Errors in sequences can artificially increase the observed level of genetic diversity, which will influence the estimation of demographic parameters, substitution model parameters, divergence times, and mutation rates (Clark and Whittam 1992). For example, even relatively low rates of sequence damage can inflate estimates of genetic diversity: in an alignment of 500 bp from 100 individuals, a rate of 1 damaged site per 1,000 nt in an alignment will lead to 40 haplotypes being observed (assuming that damage is Poisson distributed; see supplementary table S1, Supplementary Material online) Sequence errors have a particularly large impact on studies of data sets which have low genetic variation, such as those from individuals within a population, where they can lead to considerable overestimation of molecular evolutionary rates (Ho et al. 2005). Miscoding lesions will behave as additional mutations along the terminal branches in a phylogeny, artificially increasing the length of these branches and potentially misleading phylogenetic inference. Sequence errors are less likely to have a detrimental impact on phylogenetic analyses of data sets with moderate levels of genetic variability because they will represent a smaller proportion of the total sequence variation. Nevertheless, erroneous sequences have the potential to misinform primer design and, for instance, result in quantitative PCR errors.
Over the past decade, aDNA data sets have been increasing considerably in size, with large population studies and genome projects becoming more frequent (Lambert et al. 2002; Shapiro et al. 2004; Noonan et al. 2005; 2006; Poinar et al. 2006). With this growing database of aDNA sequences, a better understanding of the distribution of damage in these data and of the effect of miscoding lesions on population genetic and phylogenetic analyses will be paramount to conducting accurate and successful studies of aDNA. Such information can aid in the identification of spurious polymorphisms caused by damage and in detecting damage-related biases in subsequent sequence analyses.
To investigate the effect of miscoding lesions in aDNA analyses, we introduce a simple model of sequence damage in a Bayesian phylogenetic framework. This model introduces a single parameter providing a measure of the nucleotide error rate, which represents a combination of postmortem damage and polymerase-derived base misincorporation. The parameter accounts for some of the sequence variation on the tips of the tree, thereby compensating for spurious mutations due to miscoding lesions.
Using simulation, we generate sequences with known amounts of damage in order to explore the capacity of the delta model to estimate miscoding lesions accurately. We then use the delta model to estimate the number of miscoding lesions in a number of aDNA data sets.
Materials and Methods
Delta Model
We implemented a model of DNA damage in the Bayesian Markov chain Monte Carlo (MCMC) program, BEAST v1.3 (Drummond and Rambaut 2003), allowing us to use it in combination with any of the large range of models of nucleotide evolution available in this framework. The damage model adds a single parameter, delta, which represents the average amount of damage per nucleotide. In the BEAST framework, each branch in the tree is ascribed a rate of molecular evolution in units of substitutions per site per unit time. In the simplest case, all branches have the same rate (the molecular clock) but this assumption can be relaxed (Drummond et al. 2006). The product of the rate of a branch and the time that it represents gives the expected number of substitutions per site, which is used to calculate the likelihood of the tree (Felsenstein 1981). The damage model adds delta additional substitutions per site to each external branch to represent substitutions due to DNA damage. The delta parameter is then sampled in the Bayesian MCMC kernel in a similar manner to the other continuous parameters of the model with a uniform prior bounded at zero. For details of the sampling scheme used by BEAST see Drummond et al. (2002) and Drummond et al. (2006).
Simulations
To assess the accuracy of the delta model in identifying the number of miscoding lesions, we first performed analyses on simulated data sets in which nucleotide errors had been introduced in known quantities. Analyses were performed on 2 data sets, which were chosen to approximate the type of data that might be used in an aDNA analysis. This analysis was performed in 3 steps: 1) construction of phylogenetic trees using real aDNA data; 2) simulation of sequence evolution and introduction of erroneous nucleotides; and 3) Bayesian analysis of aDNA data sets using the delta model.
In step 1, 2 aDNA data sets were chosen in order to construct starting trees (see supplementary fig. S1, Supplementary Material online for examples): a 34-taxon cave lion (Panthera leo spelaea) data set, consisting of individuals ranging in age from 12 to 60 (Barnett R, unpublished data), and a 70-taxon bison (Bison bison) data set, with 10 sequences selected randomly from each of 6 age categories (0–10 thousand years ago, 10–20 thousand years ago, …, 50–60 thousand years ago; Shapiro et al. 2004). For each data set, Bayesian phylogenetic analysis was performed using BEAST with a constant-size coalescent prior on the tree and with the ages of the tips given by radiocarbon dates. The substitution model for each data set was chosen by comparison of Akaike information criterion (AIC) scores using Modeltest v3.7 (Posada and Crandall 1998). The MCMC analysis was run for 2,000,000 steps and the tree was recorded every 50,000 steps, resulting in posterior samples of 40 trees from each data set.
In step 2, simulations were performed on each tree using Seq-Gen v1.5.3 (Rambaut and Grassly 1997). In all cases, simulation parameters matched the characteristics of the real sequence data sets, including sequence ages, alignment length, estimated mutation rate, and estimated substitution model parameters. This approach generates parametric replicates of the 2 original data sets, hereafter referred to as the pseudo–cave lion and pseudo-bison data sets. The sequences were artificially “damaged” using a novel program, Sequescence (written by S.Y.W.H., available from http://abc.zoo.ox.ac.uk). The damage was assumed to be Poisson distributed and to consist of 5% type I (A → G/T → C) transitions and 95% type II (G → A/C → T) transitions (Gilbert et al. 2007). Four categories of damage were used: 0, 0.001, 0.005, and 0.01 mean errors per base. Base damage was treated as an irreversible and time-independent process. Each damage category was applied to 10 pseudo–cave lion and 10 pseudo-bison simulated data sets. The “artificial” damage can be taken to represent a combination of sequencing error and damage, but for the sake of simplicity the former can be regarded as negligible compared with the latter.
In step 3, the 80 data sets were analyzed using BEAST with and without the delta model. A uniform prior on the interval [0,1] was used for the delta parameter. Analyses were performed as described above, but with samples drawn every 500 steps over a total of 2,000,000 steps. Samples from the posterior were checked for convergence and acceptable mixing using Tracer v1.3 (Rambaut and Drummond 2004).
Analysis of Real Data
We then used the delta model to estimate the amount of miscoding lesions in 12 published and 1 unpublished aDNA data sets. Unless otherwise indicated, all sequences were from the mitochondrial control region: 1) Adélie penguin (Pygoscelis adeliae); 2) aurochs (Bos primigenius); 3) bison (Bison bison/Bison priscus); 4) brown bear (Ursus arctos); 5) cave bear (Ursus spelaeus); 6) cave hyaena (Crocuta spelaea); 7) cave lion (Panthera leo spelaea); 8) horse (Equus caballus); 9) Mappin's moa (Pachyornis mappini); 10) musk ox (Ovibos moschatus); 11) musk ox, cytochrome b; 12) ox (Bos taurus); and 13) social tuco-tuco (Ctenomys sociabilis), cytochrome b. Due to the availability of abundant modern sequences for bison, we conducted analyses both including and excluding modern sequences in order to determine their effect on the analysis. Some details of these data sets can be found in table 1 and the BEAST input files are available from the authors on request.
Estimates of Damage Levels in a Range of aDNA Data Sets
| Sample Size | Age Range thousand years ago | Aligned Length (bp) | Damage Per Site | Total Damage | |||
| Data Set | Mean | 95% HPD | Per Sequence | Per Alignment | |||
| Adélie penguin | 96 | 0–12 | 313 | 2.42 × 10⁻³ | 8.41 × 10⁻⁴–4.08 × 10⁻³ | 0.76 | 72.8 |
| Aurochs | 40 | 2–12 | 379 | 2.31 × 10⁻⁴ | 3.37 × 10⁻⁸–5.89 × 10⁻⁴ | 0.09 | 3.49 |
| Bison | |||||||
| With modern | 182 | 0–60 | 601 | 1.51 × 10⁻³ | 6.14 × 10⁻⁴–1.71 × 10⁻³ | 0.91 | 165.2 |
| Without modern | 154 | 1–60 | 2.03 × 10⁻³ | 1.34 × 10⁻³–2.81 × 10⁻³ | 1.22 | 187.5 | |
| Brown bear | 30 | 10–59 | 130 | 2.75 × 10⁻³ | 3.63 × 10⁻⁷–5.96 × 10⁻³ | 0.36 | 10.7 |
| Cave bear | 26 | 27–80 | 288 | 9.69 × 10⁻⁴ | 4.17 × 10⁻⁷–2.27 × 10⁻³ | 0.28 | 7.3 |
| Cave hyena | 10 | 38–51 | 366 | 4.05 × 10⁻⁴ | 7.85× 10⁻⁸–1.16 × 10⁻³ | 0.15 | 1.48 |
| Cave lion | 34 | 12–62 | 213 | 6.05 × 10⁻⁴ | 1.07× 10⁻⁷–1.43 × 10⁻³ | 0.13 | 4.4 |
| Horse | 12 | 1–28 | 348 | 3.68 × 10⁻³ | 4.01 × 10⁻⁴–7.24 × 10⁻³ | 1.28 | 15.4 |
| Moa | 14 | 1–6 | 241 | 1.74 × 10⁻³ | 1.75 × 10⁻⁵–3.58 × 10⁻³ | 0.42 | 5.9 |
| Musk ox | 10 | 0–44 | 177 | 6.52 × 10⁻⁴ | 9.81 × 10⁻⁸–1.91 × 10⁻³ | 0.12 | 1.2 |
| Musk ox (cytb) | 10 | 0–44 | 114 | 9.79 × 10⁻⁴ | 1.01 × 10⁻⁷–2.96 × 10⁻³ | 0.11 | 1.1 |
| Ox | 36 | 4–8 | 379 | 3.87 × 10⁻⁴ | 5.11 × 10⁻⁷–8.57 × 10⁻⁴ | 0.15 | 5.3 |
| Tuco-tuco (cytb) | 45 | 0–10 | 253 | 3.26 × 10⁻⁴ | 3.37 × 10⁻⁷–7.94 × 10⁻⁴ | 0.08 | 3.7 |
NOTE.—Data sets were obtained from the following studies: Aurochs (Edwards et al. forthcoming), bison (Shapiro et al. 2004), brown bear (Barnes et al. 2002), cave bear (Loreille et al. 2001; Hofreiter et al. 2002; Orlando et al. 2002), cave lion (Barnett R, unpublished data), horse (Vila et al. 2001), moa (Huynen et al. 2003), musk ox (MacPhee et al. 2005), ox (Bollongino et al. 2006), and social tuco-tuco (Chan et al. 2006).
For each species, aDNA sequences with known radiocarbon ages were collected from GenBank. The substitution model for each data set was chosen by assessment of AIC scores using Modeltest. As above, BEAST analyses were performed assuming a strict molecular clock and incorporating radiocarbon ages as prior information. A constant-size coalescent prior was placed on the tree. For each data set, the MCMC was run for 10,000,000 steps following 1,000,000 discarded burn-in steps, with samples drawn every 1,000 steps. Samples from the posterior were checked for convergence and acceptable mixing using Tracer.
Results
Simulations
In the analyses of simulated data sets with known damage rates, estimates of damage using the delta model were generally accurate for the pseudo–cave lion data sets, whereas there was a small but consistent overestimation of damage in the pseudo-bison data sets (fig. 1a). For both data sets, significantly nonzero estimates of damage levels were obtained even when there was no actual damage in the sequences.
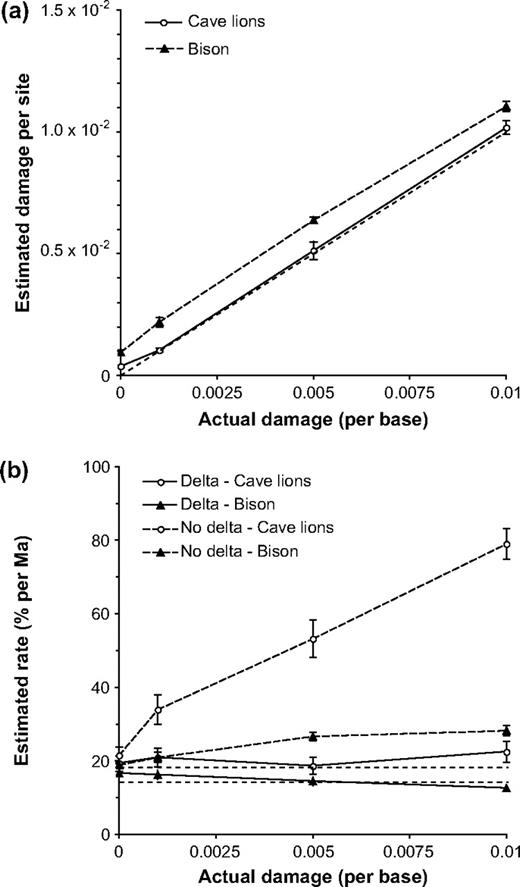
Results from Bayesian phylogenetic analyses of damaged sequence data generated by simulation. All error bars represent ±1 standard error. (a) Estimates of damage per site made using the delta model. The unlabeled dashed line represents y = x. (b) Estimates of the mutation rate made with and without the delta model. The 2 horizontal dashed lines indicate the true mutation rates (i.e., those used for simulation), with the top and bottom lines denoting the rates in cave lions and bison, respectively.
Analyses performed without the delta model tended to overestimate the mutation rate when damage was present (fig. 1b). The pattern of overestimation is particularly noticeable for the pseudo–cave lion sequences. Addition of the delta model removed this bias from the estimates, thereby increasing the accuracy of BEAST in recovering the true mutation rate. For the pseudo–cave lion and pseudo-bison data, the true rate was contained within the 95% highest posterior density (95% HPD) 100% and 90% of the time, respectively.
Real Data
The amount of miscoding lesions estimated from the real aDNA data sets ranged from 2.3 × 10⁻⁴ per site (1 miscoding lesion for every 4,329 nt) in aurochsen to 3.7 × 10⁻³ per site (1 miscoding lesion for every 272 nt) in horses (fig. 2 and table 1). The estimated totals range from 1.1 damaged nucleotides in the musk ox data set (from a total of 1,140 nt) to 165 of 109,382 nt in the full bison data set. Based on regression analyses, no significant relationships were found between the estimated level of damage and the number of sequences, age of the oldest sequence, or the estimated mutation rate. Three studies did not have their sequences checked by independent replication; the damage rates in these data sets were higher, but not significantly so (P = 0.19, 1-tailed t-test).
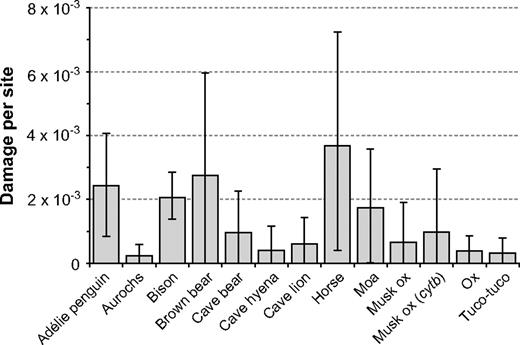
Bayesian estimates of sequence damage for 13 aDNA data sets. The error bars denote 95% HPDs. Details of the data sets are given in table 1.
For each data set, estimated mutation rates were relatively high compared with those estimated from phylogenetic studies (for a discussion of this issue, see Ho et al. 2005). These elevated rates, ranging from 11.1% per MY in horses to 112% per MY in Adélie penguin (table 2), are obtained in spite of the correction of damage-related bias through the delta parameter. The rate estimate from Adélie penguin is consistent with an earlier Bayesian analysis of the same penguin sequences (Lambert et al. 2002). In most cases, however, the mean rate estimates are not particularly meaningful because of very large associated 95% HPDs. Mutation rates could not be estimated from the 2 musk ox alignments due to poor MCMC convergence, which may be due to the limited variation among the sequences. Subsequent analyses, which are not shown here, demonstrated that estimates of the delta parameter did not change when the mutation rate was fixed to an arbitrary value.
Estimates of Mutation Rates in a Range of aDNA Data Sets, Made Using the Delta Model
| Mutation Rate (% per MY) | ||
| Data Set | Mean | 95% HPD |
| Adélie penguin | 112 | 31.8–198 |
| Aurochs | 63.5 | 15.1–118 |
| Bison (all) | 22.5 | 14.7–30.6 |
| Brown bear | 78.3 | 9.43–138 |
| Cave bear | 13.2 | 4.02–25.1 |
| Cave lion | 20.2 | 3.15–40.4 |
| Horse | 11.1 | 1.77–30.8 |
| Moa | 67.2 | 1.30–209 |
| Musk ox | N/Aa | N/Aa |
| Musk ox (cytb) | N/Aa | N/Aa |
| Ox | 13.3 | 0.21–40.8 |
| Social tuco-tuco (cytb) | 41.7 | 9.04–81.0 |
NOTE.—Unless otherwise indicated, all sequences are from the mitochondrial control region.
Mutation rates could not be reliably estimated for the two musk ox data sets, due to convergence problems in the MCMC analysis. This did not affect estimates of the delta parameter.
Discussion
aDNA Damage
The results of the simulations indicate that the delta model is capable of measuring the proportion of damage in DNA sequences with reasonable accuracy. In some cases, there is a slight tendency to overestimate the actual amount of damage, possibly due to the treatment of genuine polymorphisms as damage. For this reason, the delta model appears to be very effective in placing upper limits on the amount of miscoding lesions that may be present in a data set, but it is probably inappropriate for analyzing sequences from multiple species.
Interestingly, there appear to be few miscoding lesions in the majority of the real data sets analyzed in this study, with estimated damage rates of less than 2.0 × 10⁻³ per nucleotide, or 1 damaged site per 500 nt. The most damaged alignments were those from horse, brown bear, and Adélie penguin, which exhibited estimated damage levels of 3.68 × 10⁻³, 2.75 × 10⁻³, and 2.42 × 10⁻³ per base, respectively. As expected, excluding modern (presumably undamaged) sequences from the bison data set results in an increase in the average amount of damage estimated over the data set, although the 95% HPDs between the 2 estimates overlap to some extent. The simulations suggest that when there is no actual damage, the delta model produces mean estimates of around 0.5–2 damaged sites per 1,000 bp. The majority of aDNA data sets have estimated damage falling in this region, indicating that recent aDNA studies have been successful in addressing the problem of damage. In turn, this suggests that current practices in aDNA research, including cloning and UNG treatment, are having a positive effect on reducing the number of spurious mutations introduced by damage. It is also noted that aDNA data are often obtained by amplifying small fragments that are ultimately concatenated to provide the full-length target sequence. In many cases, these small fragments overlap to some extent, resulting in regions within the sequence that are independently replicated. Indeed, any process that generates multiple PCR amplifications of the same sequence fragment, including cloning, overlapping amplification, and replication, will serve to increase the chance of identifying inconsistent bases, thereby reducing the effect of spurious mutations on the data set.
Unfortunately, it was not possible either to quantify or qualify the effects of UNG treatment, replication of full or partial sequences, or cloning on damage rates. Most aDNA studies did not state whether sequences were treated with UNG, and all but one study performed cloning. There was no significant evidence of a higher damage rate in data sets that had not been checked by independent replication, but this may have been due to the limited sample size or the effect of the other forms of replication described above.
High estimated levels of damage in some data sets could be due to sparse sampling, which increases the probability that different sequences will not share polymorphisms. This has the effect of increasing the number of base changes assigned to terminal branches. For this reason, it is expected that the accuracy of the delta model will be greatest for large, thoroughly sampled data sets.
Overall, the delta model appears to work best when a large amount of damage is present in the sequence data. At low levels of damage, the model lacks sufficient power to distinguish between damage and genetic variation, especially if the latter makes a substantial contribution to the total sequence variation. It is also notable that the delta model produced nonzero damage estimates for the undamaged simulated data. This is partly because delta is a scale parameter (bounded at zero but with no upper bound), but it is also likely that the delta model is treating some of the genuine polymorphism as sequence errors. This problem is exacerbated in analyses of data sets comprising fewer than 10 sequences, when there is a significant correlation between the number of tips and the estimated value of delta (results not shown). This correlation disappears for larger data sets; for this reason, our analyses were restricted to data sets comprising at least 10 sequences.
Mutation Rates
The high estimates of mutation rates, combined with the relatively low levels of sequence damage, provide a strong indication that sequence errors alone are insufficient to explain the “time dependency of molecular rate estimates” hypothesis, which postulates that molecular evolutionary rates appear to decline with calibration depth (Ho et al. 2005). Phylogenetic methods are liable to overestimate the mutation rate if spurious polymorphisms are present. This is clearly evident in the analysis of the pseudo–cave lion data sets, for which the overestimation is particularly marked because the original sequences exhibit low variation. As a result, any induced damage will form a substantial proportion of the total sequence variation, hence making a large contribution to the overestimation of the mutation rate.
We were not able to test some of the sequences that were published in the earlier years of aDNA research, when cloning was not routine (Higuchi et al. 1984; Handt et al. 1996), because these data sets are small and consist of short, fragmentary sequences. The delta model would have been particularly useful for investigating these sequences, which might have had high levels of damage because rigorous authentication criteria had not yet been adopted (for the most recent discussion of criteria, see Gilbert et al. 2005).
Future aDNA studies can profit from using the delta model to place upper credibility limits on the amount of sequence damage present in an alignment. It could also be used to assess the efficacy of damage-limiting precautions, such as cloning, UNG-treatment, and high-fidelity Taq polymerases. In theory, the delta model can also be used to detect sequencing errors, provided that multiple sequences from the same loci are available and the amount of error is not negligible. With respect to the latter, for example, genome projects appear to have sequencing errors of about 1 per 10,000 bp (Hill et al. 2000; Schmutz et al. 2004), which is effectively negligible from the perspective of the delta model. In contrast, single-pass sequencing of noncoding regions can yield error rates as high as 3.1 per 1,000 bp (Hill et al. 2000), which is well within the detection range of the delta model. Damage levels are likely to be lower for coding regions, however, for several reasons. First, damage is easier to detect because of the lower amount of natural sequence variation, and second, damage tends to occur at sites that are highly polymorphic, such as the mutation hot spots in the mitochondrial control region (Gilbert, Willerslev, et al. 2003).
The current delta model is simplistic and could be extended in a number of ways. For example, the damage process could be explicitly modeled in finer detail, using a time-independent damage substitution matrix. Rather than being uniform among tips, multiple delta parameters could be assigned among the sequences or could be modeled in an age-dependent manner. The present amount of available aDNA and damage data is perhaps too limited for these models to be tested reliably.
We have demonstrated that the delta model is able to estimate levels of damage accurately from simulated data, but it would be ideal to measure damage in situ. Unfortunately, techniques have not yet been developed to measure molecular damage directly from the DNA molecule. Future advances in molecular biological techniques will undoubtedly improve our understanding of the processes causing sequence damage and increase our power to detect this damage.
We thank Ross Barnett, Ceiridwen Edwards, and Yvonne Chan for providing data. S.Y.W.H. was funded by the Leverhulme Trust, the Commonwealth Scholarship Commission, and Linacre College, Oxford. T.H.H. was funded by the Marie Curie GeneTime program. A.R. and B.S. were funded by the Royal Society.
References
Author notes
Connie Mulligan, Associate Editor
