


Abstract
A recent investigation found evidence that the transition of Arabidopsis thaliana from ancestral self-incompatibility (SI) to full self-compatibility occurred very recently and suggested that this occurred through a selective fixation of a nonfunctional allele (ΨSCR1) at the SCR gene, which determines pollen specificity in the incompatibility response. The main evidence is the lack of polymorphism at the SCR locus in A. thaliana. However, the nearby SRK gene, which determines stigma specificity in self-incompatible Brassicaceae species, has extremely high sequence diversity, with 3 very divergent SRK haplotypes, 2 of them present in multiple strains. Such high diversity is extremely unusual in this species, and it suggests the possibility that multiple, different SRK haplotypes may have been preserved from A. thaliana's self-incompatible ancestor. To study the evolution of S-haplotypes in the A. thaliana lineage, we searched the 2 most closely related Arabidopsis species Arabidopsis lyrata and Arabidopsis halleri, in which most populations have retained SI, and found SRK sequences corresponding to all 3 A. thaliana haplogroup sequences. Our molecular evolutionary analyses of these 3 S-haplotypes provide an independent estimate of the timing of the breakdown of SI and again exclude an ancient transition to selfing in A. thaliana. Comparing sequences of each of the 3 haplogroups between species, we find that 2 of the 3 SRK sequences (haplogroups A and B) are similar throughout their length, suggesting that little or no recombination with other SRK alleles has occurred since these species diverged. The diversity difference between the SCR and SRK loci in A. thaliana, however, suggests crossing-over, either within SRK or between the SCR and SRK loci. If the loss of SI involved fixation of the ΨSCR1 sequence, the exchange must have occurred during its fixation. Divergence between the species is much lower at the S-locus, compared with reference loci, and we discuss two contributory possibilities. Introgression may have occurred between A. lyrata and A. halleri and between their ancestral lineage and A. thaliana, at least for some period after their split. In addition, the coalescence times of sequences of individual S-haplogroups are expected to be less than those of alleles at non–S-loci.
Introduction
Several lines of evidence suggest that transitions from outcrossing to selfing have occurred multiple times in independent lineages. In Angiosperms, such transitions tend to be associated with sets of changes, including differences in morphology(e.g., smaller flower size) and genomic (e.g., reduction in genome size) as well as population genetic properties (e.g., reduced heterozygosity; reviewed in Charlesworth 2003). In most cases, however, the timing and processes driving the transition have remained out of reach of experimental investigation. Even for very well-studied selfing species, such as Caenorhabditis elegans and Arabidopsis thaliana, although it is known that there was a change from outcrossing to selfing (Marais et al. 2001; Nasrallah et al. 2004), the time of the change is unknown, making it difficult to interpret the molecular evolution of their sequences, which are predicted to be affected by the breeding system (Charlesworth and Wright 2001). Recently, the remnants of the ancestral self-incompatibility (SI) locus in the selfing species A. thaliana (Brassicaceae) have been investigated in depth (Nasrallah et al. 2004; Shimizu et al. 2004; Charlesworth and Vekemans 2005), and an estimate of the time this plant lost SI and became selfing has been made (Shimizu et al. 2004).
Sporophytic SI reactions in the Brassicaceae are controlled by 2 closely linked genes, SRK and SCR, which determine the stigma and pollen phenotypes, respectively. The SRK and SCR alleles determine a SI type or “specificity,” and such a combination is termed a SI haplotype (S-haplotype). Recognition between the products of these genes from haplotypes with same specificity leads to inhibition of pollen germination at the stigma surface (Hiscock and McInnis 2003). As predicted by population genetics theory, which shows that negative frequency–dependent selection should maintain high allelic diversity, natural populations have a number of different specificities (Lawrence 2000; Castric and Vekemans 2004). Sequences of alleles known to have different specificities are all highly divergent, again as predicted theoretically (because alleles should be maintained for long evolutionary times [Vekemans and Slatkin 1994]). The sequence differences make it difficult to pinpoint sequence variants responsible for specificity differences (Takebayashi et al. 2003; Chookajorn et al. 2004; Sainudiin et al. 2005), although 3 hypervariable regions in the receptor domain of the SRK are probably involved (Kusaba et al. 1997; Takebayashi et al. 2003; Sainudiin et al. 2005). In Arabidopsis lyrata, multiple specificities have been identified, and portions of cosegregating SRK alleles for many of them have been sequenced (Charlesworth et al. 2000; Kusaba et al. 2001; Schierup et al. 2001; Mable et al. 2003; Schierup et al. 2006). In Arabidopsis halleri, 26 different specificities have recently been sequenced (V Castric and X Vekemans, unpublished data). In both these species, sequence divergence between SRK sequences associated with different SI types is extreme (see cited references).
Despite being self-compatible, A. thaliana has genes that are evidently orthologues of both the SRK and SCR loci (Kusaba et al. 2001). These are also present in its closest self-incompatible relatives A. halleri and A. lyrata. The transition to self-compatibility could, in principle, have occurred at any time since the split between A. thaliana and the common ancestor of the sister species, A. halleri and A. lyrata, which is estimated to have occurred about 5 MYA, based on raw divergence estimates (uncorrected for diversity within species) together with reasonable assumptions about evolutionary rates for plant nuclear genes (Koch et al. 2000, 2001; Ramos-Onsins et al. 2004). In a panel of A. thaliana accessions, Shimizu et al. (2004) found 3 very divergent SRK sequences (termed haplogroups, and noted ΨHapA, ΨHapB, and ΨHapC), whereas the sequences of the longest SCR gene fragment, ΨSCR1, were almost identical. Using coalescent simulations of the loss of diversity during a selective event following a mutation at the ΨSCR1 locus that swept through the population due to a selective advantage to selfing, these authors estimated a very recent transition to selfing in A. thaliana (<320,000 years ago). Nevertheless, at least two recombination events during this process rescued some of the variability at nearby loci, because SRK and a U-box gene have high diversity. High polymorphism within A. thaliana at the SRK locus was also reported by Nasrallah et al. (2004), based on restriction fragment length polymorphism analysis using a Col-0 ψSRK probe. These results furthermore suggest that some A. thaliana accessions carry SRKs different from the ones found by Shimizu et al. (2004). However, in contrast to the results of Shimizu et al. (2004), these authors could not detect ΨSCR1 in 17 out of the 27 A. thaliana accessions investigated, and they confirmed this through polymerase chain reaction (PCR) analyses using ΨSCR1 primers. These results do not support the occurrence of a recent selective sweep at ΨSCR1.
Here, we seek further evidence about the transition to selfing in the A. thaliana lineage by comparing sequences of its SI genes with those in the 2 closely related species, A. lyrata and A. halleri, both of which have retained a fully functional SI system. Among the A. lyrata and A. halleri sequences, 3 sequences were identified that are very similar to those of the 3 A. thaliana SRK haplogroups. In what follows, we use the term “haplogroup” for SRK sequences that are similar between different species and may encode pistil receptor kinases with the same specificity; this is similar to the usage in Brassica, where the assumption about specificities has been tested for some allele pairs in Brassica oleracea and Brassica campestris (see Sato et al. 2002, 2003, and Discussion). We analyzed the sequences of each haplogroup to obtain a new, independent estimate of the time of the transition to self-compatibility in the ancestry of A. thaliana and to suggest the events associated with the loss of SI. We do this by tracking the molecular signature of the predicted changes that will occur when SI is lost. Because SRK was evidently not affected by a selective sweep when SI was lost (as it has high diversity), it is clear that, since the loss of SI, variants in this gene were no longer constrained by selection in A. thaliana. Under the assumption that similar sequences from different species represent the same specificities, we can also investigate the evolution of a single SRK allele over a period of 10 Myr, with the potential to detect genetic exchange due to recombination and/or gene conversion and to identify gene regions with contrasting levels of selective constraints.
Materials and Methods
Identification of Shared Haplotypes
The SRK gene is at least 3,000 bp (lengths differ somewhat between allelic types, with indels in the introns and in exon 1). There are 7 exons in total: exon 1 encodes the extracellular S-domain, the receptor domain responsible for binding with the pollen SCR ligand, exon 2 encodes a transmembrane domain, and exons 3–7 encode an intracellular kinase domain (Stein et al. 1991) (see fig. 1). Based on species-wide surveys of S-domain diversity, using the methods outlined in Schierup et al. (2001), 34 and 26 SRK alleles have currently been sequenced from A. lyrata and A. halleri, respectively, and 27 of these in A. lyrata and 8 in A. halleri have been shown to cosegregate with incompatibility types. We denote the sequences by AlSRK or AhSRK, for the 2 species, followed by a number to indicate the incompatibility type. The length of sequence available for each haplotype varies considerably; for all haplotypes except for AlSRK36, a portion of at least 600 bp including the 3′ end of the S-domain was included (see fig. 1 and supplementary table 1, Supplementary Material online). By examining pairwise nucleotide divergence between SRK haplotypes from the 3 Arabidopsis species, we identified haplotypes in A. halleri and A. lyrata with high sequence similarity to A. thaliana ΨHapA (AhSRK04 and AlSRK37), ΨHapB (AhSRK10 and AlSRK16), and ΨHapC in A. lyrata (AlSRK36).
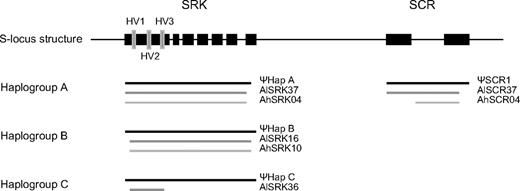
Sequenced regions in the 3 haplogroups. Vertical bars in the S-domain indicate the location of hypervariable (HV) regions.
All PCR amplifications used genomic DNA obtained from leaves by a cetyl trimethyl ammonium bromide extraction method, as in Bechsgaard et al. (2004), in A. lyrata and by the extraction kit Dneasy from Qiagen (Valencia, CA) in A. halleri. The primers and PCR conditions are listed in supplementary table 2, Supplementary Material online. Direct sequencing was done from PCR-amplified fragments, using allele-specific primers. Sequences from this study have GenBank accession numbers DQ520279–DQ520289. The sequences obtained are summarized in figure 1.
The complete sequence of the A. thaliana ΨHapA from the Col-0 ecotype genome sequence was found to be similar to a previously obtained 600-bp sequence from A. halleri, AhSRK04. The AhSRK04 sequence was extended by designing primers from the Col-0 sequence. These primers plus the ones designed from the AhSRK04 sequence were then used to obtain a sequence, named AlSRK37, from A. lyrata. Due to rearrangements in the 3′ end of exon 7 of the ΨHapA Col-0, which apparently occurred in the A. thaliana lineage, we were not successful in amplifying the 3′ end in A. lyrata and A. halleri.
The ΨHapB sequence of Shimizu et al. (2004) is similar to the previously obtained A. lyrata sequence AlSRK16. To extend this sequence and to obtain the A. halleri sequence (AhSRK10), we used primers designed from the haplogroup B sequence.
No sequence similar to the ΨHapC sequences in Shimizu et al. (2004) had previously been found in our population surveys, so a search was initiated to test whether it is present in A. lyrata or A. halleri. We screened a sample of A. lyrata individuals in which only one SRK sequence or none had previously been identified because these alleles might have sequences very different from all those previously identified. For this screen, we used a forward primer designed from the A. thaliana ΨHapC sequences (SRKHGC-F), with the reverse primer PseSRK6751R1E1 of Shimizu et al. (2004) (see supplementary table 2, Supplementary Material online). The sequence obtained was called AlSRK36. A screen in A. halleri with the same 2 primers was unsuccessful for 20 individuals from a single population, each carrying only a single identified S-haplotype. All attempts to extend the A. lyrata sequence beyond the S-domain, using primers from the published A. thaliana ΨHapC sequences, were also unsuccessful.
SCR
In Brassica, SCR is a short gene with extremely high diversity (Sato et al. 2002). In A. lyrata, only 2 alleles of SCR had been previously sequenced, SCRa and SCRb (Kusaba et al. 2001). The A. lyrata alleles have 2 exons (66 and 126 bp) separated by an intron of length 1.5 kb and 78 bp in SCRa and SCRb, respectively (Kusaba et al. 2001). In A. thaliana, the presumed orthologue to SCR is the ΨSCR1 (Shimizu et al. 2004). We identified a sequence similar to ΨSCR1 in an A. lyrata individual carrying the AlSRK37 sequence (haplogroup A), using the PseSCR3 and PseSCR5 primers of Shimizu et al. (2004). This sequence is called AlSCR37. A primer (AlSCR37F, see supplementary table 2, Supplementary Material online) was designed from the full genome sequence of the Col-0 ecotype to amplify the 5′-end sequence. Several attempts were made to design primers to amplify the 3′ end of exon 2, but all failed. Both chromosome walking and inverse PCR were tried to amplify the 3′ end of AlSCR37, but this also failed. Fifteen A. lyrata individuals, all from Icelandic populations, carrying in total 20 different SRKs, including AlSRK16 and AlSRK36, were screened for the ΨSCR1 sequence but failed to amplify. The same strategy was used in A. halleri to identify a similar sequence (here called AhSCR04) in individuals carrying AhSRK04. This sequence includes most of the intron and the first third of the exon 2.
Seven new sequences were generated in this study; namely, AlSRK36 (haplogroup C), AlSRK37 (haplogroup A), AlSRK31, and AlSCR37 from A. lyrata and AhSRK04 (haplogroup A), AhSRK10 (haplogroup B), and AhSCR04 from A. halleri. We have also extended 6 sequences of A. lyrata that have been previously published; namely, AlSRK09, AlSRK16 (haplogroup B), and AlSRK22 (Schierup et al. 2001) and AlSRK06, AlSRK18, and AlSRK25 (Charlesworth, Mable et al. 2003). The data set also includes 4 previously published A. thaliana sequences; namely, ΨHapA and ΨSCR1 (Kusaba et al. 2001), and ΨHapB and ΨHapC (Shimizu et al. 2004).
Data Analysis
Sequences were aligned using ClustalX, followed by manual adjustment using the BioEdit sequence alignment editor (Hall 1999). Separate alignments were made for the SRK sequences of each haplogroup (A, B, and C) because the sequences are sufficiently similar in all 3 species that most of the intron sequences can be aligned. Unalignable intron sequences were excluded from the analyses (most of intron 1 from haplogroup B sequences and a part of intron 1 of haplogroup A sequences that has not been sequenced in A. lyrata). For comparisons within and between specificities (see below), the S-domain portions of the sequences from the 3 haplogroups were aligned with several complete A. lyrata SRK S-domain sequences from other S-haplotypes. A separate alignment was made for the SCR sequences.
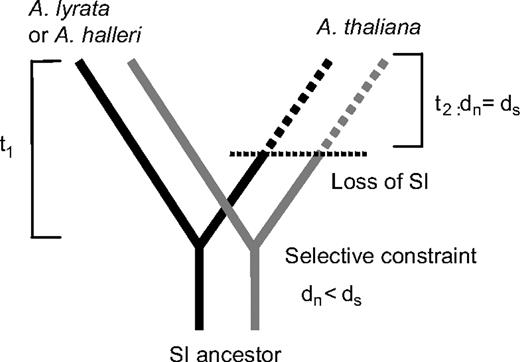
Expected selection pressures within specificities during the time t1 since the split of Arabidopsis thaliana and the ancestor of Arabidopsis lyrata/Arabidopsis halleri with a change at the time t2 when A. thaliana became self-compatible. Two specificities are shown; the selection pressure between these is again assumed to be different from the selection pressure within specificities.
To estimate ωthaliana and ωSI, we applied a codon-based likelihood analysis under different models of selective constraints, using the software codeml in the PAML 3.14 computer package (Yang 1997). Because the different parts of the gene are likely to experience different selection regimens, we obtained separate estimates for the whole S-domain, for the S-domain excluding hypervariable regions, and for the kinase domain.
A phylogeny was reconstructed using the Hasegawa, Kishino, and Yano (HKY) substitution model and the minimum evolution criterion in MEGA 3.1 (Kumar et al. 2004), and its topology was used as the input tree for the PAML analysis. Codons with gaps in the alignment were excluded. The phylogenies, with estimates of branch lengths obtained by maximum likelihood for nonsynonymous as well as synonymous substitutions, were displayed using MEGA 3.1. Nested models with different numbers of free parameters (different numbers of ω ratios) were compared using likelihood ratio tests (LRTs). This included models with different fixed ω values on the A. thaliana branch, in order to determine confidence intervals (CIs) for the time estimates. We performed the analyses separately for the S-domain and the kinase domain because the latter was not sequenced for the haplogroup C SRK.
Estimates of pairwise synonymous divergence within each SRK haplogroup and between the SCRs were done using DnaSP 4.0 (Rozas et al. 2003) with Jukes–Cantor correction. Sequences from 10 reference genes unlinked to the S-locus were downloaded from GenBank for each species (references in table 5). Pairwise synonymous divergences between sequences from the 3 species were analyzed as described above. To test for differences in the evolution of the hypervariable versus other regions of the SRK S-domain, we defined these regions as in Miege et al. (2001). McDonald–Kreitman (1991) tests were then performed using Fisher's exact test (as implemented in the R language, http://www.r-project.org) to compare the numbers of synonymous and nonsynonymous substitutions estimated from the PAML analysis. Sliding-window analyses of sequence divergence were performed using DnaSP 4.0 (Rozas et al. 2003).
Results
Presence of Shared SRK Haplotypes in the 3 Arabidopsis Species
As explained above, we recovered sequences similar to all 3 A. thaliana SRK haplogroups in A. lyrata and to 2 of them in A. halleri (fig. 1). We have several lines of evidence that each of the 3 SRK sequences from A. lyrata and A. halleri with similarity to an A. thaliana haplogroup sequence represents a functional SRK allele with a different specificity, though we have not tested that the specificities are the same in A. lyrata and A. halleri. It should be possible to do this test in the future. Because specificity differences between the species cannot be excluded, we discuss the implications of specificity changes for our conclusions later (see Discussion).
First, we present the evidence that our SRK sequences are probably alleles at the pistil incompatibility locus. Our previous crossing experiments in A. lyrata established linkage of one of these sequences, AlSRK16 (resembling the A. thaliana haplogroup B), to SI (Schierup et al. 2001; Mable et al. 2004; Prigoda et al. 2005). For haplogroup A, the most similar SRK sequence in A. halleri, AhSRK04, is also linked to the SI locus. In a family in which both parents had 2 different SRK sequences, they segregated as expected for alleles at a single locus (AhSRK01/AhSRK04 × AhSRK12/AhSRK21 yielded the following ratio of the 4 putative alleles 10:15:13:12). Incompatibility reactions were tested for 11 progeny plants, including two or more of each of the 4 SRK genotypes. Fifty-six pollinations involved plants whose putative genotypes predict compatibility (no shared AhSRK sequences), and for these fruit set was 100%, except for one combination of genotypes in which 2 of 17 pollinations failed to yield seeds. Fifty-three pollinations involved plants whose putative genotypes predict cross-incompatibility, and the mean fruit set was 11.0%; for plants with the AhSRK04 sequence, relevant to the present study, the value was 10.3%. Thus, the AhSRK04 sequence is probably a functional SRK allele in A. halleri.
Linkage to the S-locus has not been established for A. lyrata sequences resembling haplogroup A and haplogroup C and the A. halleri sequence resembling haplogroup B. However, a second line of evidence that these represent functional SRK genes is that all the A. lyrata and A. halleri sequences appear to encode functional proteins because their coding sequences are intact in both species, in both the S-domain and kinase domain exons. For the haplogroup A sequences, none of the premature stop codons reported by Shimizu et al. (2004) in A. thaliana ecotypes were present in A. lyrata or A. halleri. For haplogroup B, there is a premature stop codon in exon 3 in the A. thaliana Cvi-0 sequence (Shimizu et al. 2004) due to a G → A substitution in the splice site at the end of intron 2, leading to a single basepair frameshift. This splice site is intact in the A. lyrata and A. halleri sequences. Finally, there are no premature stop codons in the haplogroup C sequences.
Thirdly, divergence among species for each haplogroup is much less than that among different SRK alleles within either A. lyrata or A. halleri, for any region of the S-domain; the lowest nonsynonymous divergence between the 11 A. lyrata SRK sequences included in this study is 0.1 (results not shown). Figure 3 illustrates this for the 3 A. lyrata haplogroup sequences; the upper line shows diversity among haplogroup sequences A, B, and C, whereas the 3 lower lines show the divergence of each of them from the corresponding A. thaliana haplogroup. Only the A. lyrata haplogroup C sequences approach the distinctiveness of the different haplogroups (fig. 3). Figure 4 shows the haplogroup sequences for all the species in the context of S-domain sequences from A. lyrata that are known to correspond to 8 other different specificities, showing the great divergence in functionally different SRKs. Synonymous site divergence from the A. thaliana haplogroup C sequence is more than double that for haplogroups A and B, though nonsynonymous divergence is similar.
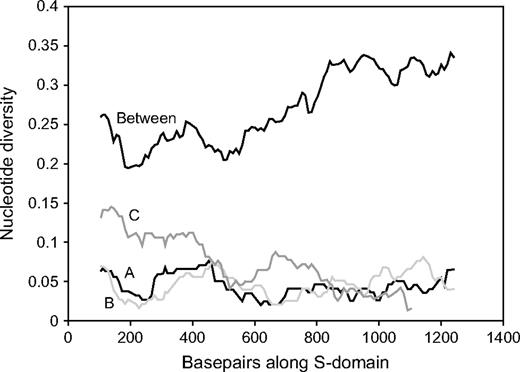
Sliding-window analysis of nucleotide divergence (coding sequence only). The lines labeled “A,” “B,” and “C” show the values between the respective haplogroup sequences of Arabidopsis lyrata and Arabidopsis thaliana. The figure also shows (line labeled “Between”) the mean divergence between the 3 A. lyrata sequences corresponding to the 3 sequenced A. thaliana haplogroups: AlSRK16 (haplogroup B), AlSRK36 (haplogroup C), and AlSRK37 (haplogroup A). The window size is 200 bp, with a step size of 10.

Sequence topology used in the PAML analysis, with branch length estimated by the rate of synonymous substitutions (ds) (upper tree) and nonsynonymous substitutions (dn) (lower tree) in the SRK S-domain as inferred in PAML. The topology was estimated using the HKY substitution model and the minimum evolution criterion. Bootstrap support is below 80% only when indicated with an asterisk.
Also consistent with the haplogroups identifying the same SRK alleles in the different species, rather than paralogues, divergence estimates of their sequences are as expected from the species' relationships, that is, most similar between A. lyrata and A. halleri, with the A. thaliana sequences more diverged (table 1, fig. 4). Divergence from the A. thaliana SRK sequence is very similar for haplogroups A and B, when estimated for either synonymous or nonsynonymous sites in either the S- or the kinase domains or in SCR (table 1). This is as expected if these sequences represent the same alleles from the orthologous gene in A. thaliana and A. lyrata, with divergence being a simple reflection of the divergence times; it is unlikely if the sequences are paralogues.
Overall Synonymous and Nonsynonymous Nucleotide Divergence (Jukes–Cantor corrected) between Sequences from Arabidopsis lyrata (lyr) and Arabidopsis halleri (hal) and Average Divergence from These Species to the Outgroup Arabidopsis thaliana (thal). Results are Presented Separately for the S-Domain and the Kinase Domain of SRK and for SCR
Synonymous | Nonsynonymous | Intronic | |||||||
|---|---|---|---|---|---|---|---|---|---|
| lyr versus hal | lyr/hal versus thal | lyr versus hal | lyr/hal versus thal | lyr versus hal | lyr/hal versus thal | ||||
| SRK S-domain | |||||||||
| Haplogroup A | 0.026 | 0.092 | 0.005 | 0.028 | — | — | |||
| Haplogroup B | 0.029 | 0.086 | 0.008 | 0.031 | — | — | |||
| Haplogroup C | 0.227a | 0.043a | |||||||
| SRK kinase domain | |||||||||
| Haplogroup A | 0.024 | 0.074 | 0.004 | 0.024 | 0.024 | 0.066 | |||
| Haplogroup B | 0.019 | 0.081 | 0.006 | 0.024 | 0.015 | 0.081 | |||
| SCR | NA | 0.065 | NA | 0.025 | 0.044 | 0.105 | |||
NOTE.—NA, not available.
The whole S-domain is not available (see supplementary table 1, Supplementary Material online).
Overall, we thus conclude that the SRK sequences similar to the A. thaliana haplogroups represent segregating SRK specificities derived from an ancestral SI species, that is, shared ancestral SRK haplotypes. It is also likely that they correspond to the same specificities in the different species. If specificity changes have occurred, the changes must have been recent.
SCR Sequences
In A. lyrata and A. halleri, the ΨSCR1 sequences reported in all A. thaliana accessions investigated (Shimizu et al. 2004) were found only in the haplogroup A haplotypes (all tested individuals carrying AlSRK37 and AhSRK04 had ΨSCR1 sequences). All attempts to identify the SCRs of the haplogroup B and C haplotypes of A. lyrata and A. halleri were, however, unsuccessful, suggesting large sequence divergence between their SCR sequences. The finding of intact haplogroup sequences shared between A. thaliana and the 2 self-incompatible species, including haplogroup A sequences with high similarity for both SRK and ΨSCR1 genes, suggests that neither intragenic recombination nor gene conversion has happened between this haplotype and that with any other specificity, during the time since the split of the 3 species; the same conclusion applies to SRK of haplogroup B.
Selective Constraints in Inter- and Intrahaplogroup Comparisons and Estimating the Time of Loss of SI from Interspecies Divergence of SRK Haplogroup Sequences
Selective constraints affecting SRK sequences within and between haplogroups were investigated using codon-based models with the phylogeny shown in figure 4. If each haplogroup has retained the same specificity, greater selective constraint is expected within haplogroups than between them. Table 2 shows that this is indeed observed. The table shows the results of models allowing different numbers of ω ratios estimated from the S-domain only (for which all 3 haplogroups could be analyzed). The simplest model assumes a single ω ratio. A 2-parameter model, with greater selective constraint within haplogroups than between them, gives a significant gain in likelihood, consistent with our hypothesis that the haplogroups' specificities have remained the same for at least much of the time since the species diverged.
Results of ω Ratio Estimations from Models Assuming a Unique ω for Each Branch (A), 3 Different ω's (B), 2 Different ω's (C), and a Single ω (D) (see text). Results of LRTs of Nested Models Are Shown in the Last Column
S-Domain Only, All Haplogroups | |||||
|---|---|---|---|---|---|
| −ln (likelihood) | ω Ratio | −2Δln L | |||
| A: Unrestricted model | 7653.57 | A versus D: 60.3 (P < 0.001) | |||
| B: 3 ω ratios | 7677.76 | 0.4867 (interhaplotype) | B versus D: 11.9 (P < 0.01) | ||
| 0.2533 (thaliana) | B versus C: 0.2 (NS) | ||||
| 0.2973 (lyrata/halleri) | |||||
| C: 2 ω ratios | 7677.86 | 0.4866 (interhaplotype) | C versus D: 11.7 (P < 0.001) | ||
| 0.2748 (intrahaplotype) | |||||
| D: Single ω ratio | 7683.73 | 0.4495 | |||
NOTE.—NS, not significant.
A major aim of our study was to test the hypothesis shown in figure 2, that, after A. thaliana became self-compatible (time t2), selective constraint on its SRK sequence was absent. As explained in Materials and Methods, if the transition to self-compatibility happened long ago, we expect a detectably higher ω ratio for each haplogroup in the branches leading to A. thaliana sequences than in those leading to A. lyrata and A. halleri sequences (including their common branch). Table 2 shows that this is not the case. A 3-parameter model does not fit significantly better than the 2-parameter model. Moreover, the estimated ω ratios differ in the direction opposite from the prediction (perhaps due to high synonymous rates in the branches leading to the A. lyrata and A. halleri sequences). There is thus no sign of relaxed selective constraint in the A. thaliana lineages, suggesting a recent transition to self-compatibility in A. thaliana. We also did analyses of haplogroups A and B including the kinase domain, either separately or together with the S-domain (including analyses excluding the hypervariable regions). There were again no significant differences between models with 2 and 3 ω ratios (results not shown).
To estimate the time since A. thaliana lost SI and its CIs, we fixed the ω ratios on the A. thaliana branches and asked how large ω could be without becoming significantly different from the observed value. Using data from the whole S-domain, our results suggest ωthaliana < 0.40 (LRT, ln L = −7677.76, allowing the A. thaliana branch to have a distinct ω value, vs. ln L = −7679.59 when ω = 0.40, P = 0.056). The results were very similar excluding hypervariable regions (highest consistent ωthaliana = 0.40, ln L = −5044.80 vs. −5046.66, respectively, P = 0.053). However, the CI was much broader when we analyzed only the kinase domain (highest consistent ωthaliana = 0.55; ln L = −3062.39 vs. −3064.18, P = 0.058), most likely because only 2 haplotypes were analyzed. Using the ωthaliana value from the S-domain excluding hypervariable regions (0.39) and assuming t1 = 5 Myr in equation (1), we estimate that the transition to self-compatibility occurred at the most 413,000 years ago. This suggests that A. thaliana has been self-incompatible for at least 91.7% of the time since its split from the ancestor of A. lyrata and A. halleri.
Sequence Evolution within and between Specificities
Under the hypothesis that sequences from the same haplogroup encode the same specificity and that the transition to self-compatibility in A. thaliana occurred recently, we can also use our data to test the importance of the hypervariable regions by comparing sequence evolution within specificities with that between specificities. If these regions play a special role in determining specificity differences, they are likely to be enriched in positively selected substitutions between specificities as compared with within specificities, over the period of about 10 Myr during which these species have been diverging. Tables 3 and 4 show the estimated numbers of synonymous and nonsynonymous substitutions between and within specificities for the hypervariable and nonhypervariable regions separately. We used these to test different contrasts between selective constraints within and between specificities. The ω ratio for hypervariable regions is, as just predicted, larger between than within specificities (tables 3 and 4). McDonald–Kreitman tests detect a significant excess of nonsynonymous substitutions in the hypervariable regions, compared with within-specificity comparisons (tables 3 and 4). This supports the view that the hypervariable regions are important in determining specificity (Kusaba et al. 1997; Miege et al. 2001; Sainudiin et al. 2005).
Summary of the Number of Changes within and between Haplotypes for the Hypervariable Regions and the Nonhypervariable Regions of the S-Domain
HV Region | Non-HV Region | |||||
|---|---|---|---|---|---|---|
| Synonymous | Nonsynonymous | Synonymous | Nonsynonymous | |||
| Haplogroup A | 8.2 | 4.8 | 32.9 | 32.7 | ||
| Haplogroup B | 5.6 | 8.1 | 25.8 | 30.8 | ||
| Haplogroup C | 7.6 | 3 | 51.4 | 30.7 | ||
| Total within haplotypes | 21.4 | 15.9 | 110.1 | 94.2 | ||
| Between haplotypes | 211 | 427.3 | 772.6 | 927.4 | ||
NOTE.—HV, hypervariable.
Fisher's Exact Test for Different Selective Regimes between Hypervariable and Nonhypervariable Regions: Contrasting Synonymous and Nonsynonymous Changes within and between Haplotypes (Upper Part) and Hypervariable and Nonhypervariable Regions within and between Haplotypes for Both Synonymous and Nonsynonymous Changes
Synonymous | Nonsynonymous | Fisher's exact test of independence | |
|---|---|---|---|
| Test of selection within HV regions | |||
| Within haplotypes | 21 | 16 | P = 0.0034 |
| Between haplotypes | 211 | 427 | |
| HV regions | Non-HV regions | ||
| Test of selection contrasting HV and non-HV regions | |||
| Synonymous changes | |||
| Within haplotypes | 21 | 110 | NS |
| Between haplotypes | 211 | 772 | |
| Nonsynonymous changes | |||
| Within haplotypes | 16 | 94 | P < 0.001 |
| Between haplotypes | 427 | 927 |
NOTE.—HV, hypervariable and NS, not significant.
Discussion
Our approach using the change in selection in SRK yields an upper estimate of 413,000 years for the transition to selfing in A. thaliana, supporting the conclusion, based on the lack of ΨSCR1 variation, that the change occurred very recently (Shimizu et al. 2004). Our results are not only consistent with their hypothesis of a selective sweep at ΨSCR1 but also compatible with any other scenario that led to the loss of selective constraint on the SRK gene and do not specifically support the conclusion that a ΨSCR1 mutation led to the loss of SI. Assuming that ΨSCR1 is indeed fixed in A. thaliana (though, as described above, this is not supported by the results of Nasrallah et al. 2004), the finding that a sequence similar to ΨSCR1 is present in the “A” haplotypes found in A. lyrata and A. halleri but not in those with other SRK sequences can be explained in different ways. If self-compatibility indeed evolved by a ΨSCR1 mutation in the ancestor of A. thaliana, at least 2 intergenic recombination events must have occurred in this lineage between SCR and SRK during the fixation process of the self-compatibility mutation. A further recombination event must probably also be invoked on the side of ΨSCR1 opposite from that of SRK because another closely linked gene, the U-box gene of Shimizu et al. (2004), also has very high diversity. Alternatively, loss of SI was due to a mutation in a different gene, perhaps even an unlinked one, and the A. thaliana haplogroups represent the remnants of an ancestrally larger set of S-alleles. Multiple recombination events are again required in A. thaliana's ancestor to bring the ΨSCR1 sequences from haplogroup A into each of haplogroups B and C but are not necessary to account for the high U-box gene polymorphism. Our results exclude the possibility that A. thaliana lost SI by a recombination event between two different S-haplotypes because the A haplogroup is intact in the SI relatives and encodes functional S-alleles (see above).
Our results suggest that recombination and/or gene conversion has been rare in this system, in contrast with observations in another much-studied case of frequency-dependent selection on a multiallelic system, the major histocompatibility locus, where recombination and/or gene conversion are often detected. For instance, Richman et al. (2003) found that after separation of 2 populations of deer mouse, recombination had affected several specificities, perhaps even creating new ones. Our findings provide support for other evidence for recombination suppression in the region (Casselman et al. 2000; Kamau and Charlesworth 2005; Uyenoyama 2005).
It is, however, puzzling that, in the apparently very short time since A. thaliana became self-compatible, there is evidence for at least two recombination events between the physically very close SRK and SCR loci. The evidence for this shows that our assumption of instantaneous fixation of a self-compatibility mutation is certainly not strictly true. If SI was indeed lost by a ΨSCR1 mutation, its fixation, requiring at least two recombination events between the ΨSCR1 and SRK genes, implies considerable time; the same is true if the mutation was at another locus. Under either interpretation, our results suggest that the mutation occurred in a haplogroup A sequence. This haplogroup should then be weighted more highly than haplogroups B and C, in the timing estimate because the other SRK haplogroups must have remained under selective constraints until A. thaliana became fully self-compatible. Including the haplogroup B and C sequences in the analysis could thus underestimate ωthaliana and underestimate the time back to the loss of SI.
Have the Specificities of the 3 Haplogroups Remained Unchanged?
A more serious uncertainty in our conclusion comes from the assumption that the specificities of the 3 haplogroups have remained unchanged since the species split, including the time before loss of SI in A. thaliana. A specificity change in the A. thaliana lineage would most likely have involved amino acid substitutions and thus would have led to an increased ω value (due to increased dn relative to ds) on the A. thaliana branch, mimicking an earlier loss of selective constraint than the true timing and thus overestimating this time. Thus, our conclusion is conservative with respect to the timing estimate of Shimizu et al. (2004). If, on the other hand, specificity changes happened on the lineage leading to A. lyrata and/or A. halleri, the ω ratios on those branches would be increased.
Our results confirm those of Miege et al. (2001) that selective constraint is greater within than between specificities for the hypervariable region. However, sequences from a given haplogroup may not have conserved identical specificity over the total time period since species separation. If this is the case, our evidence for purifying selection within specificities and our conclusions on the action of the hypervariable regions would not be invalidated, but our analysis would underestimate the difference between within-specificity evolution and that between specificities.
Divergence between Haplogroup Sequences of the Different Species
Divergence estimates between A. lyrata and A. halleri for the SCR and SRK sequences of the same haplogroup are much less than for 10 other genes for which data are available, even for synonymous sites (table 5). Synonymous divergence between A. lyrata and A. halleri for haplogroups A and B is only about one-third of the average for the reference genes (0.026 and 0.029 for haplogroups A and B, respectively, vs. 0.081 for the unlinked genes). One possible reason for this is that introgression has occurred. Arabidopsis lyrata and A. halleri can be artificially crossed and viable offspring can be produced in the greenhouse, and shared variants in some other genes give evidence for introgression in nature (Ramos-Onsins et al. 2004). Moreover, SI alleles are particularly likely to introgress because, if an allele is absent from one of the species, it will enjoy a large selective advantage during the introgression process (Schierup et al. 2000). Two related species are, therefore, expected to share a common pool of S-alleles as long as they can cross at all. This is presently being investigated in much larger samples from A. halleri. Synonymous divergence between A. thaliana and the other 2 species is also smaller for the haplogroups than for reference loci (by a factor of almost 2: 0.092 and 0.086 for haplogroups A and B, respectively, vs. 0.162 for the unlinked genes). Natural introgression is very improbable between the present-day species but S-alleles may also have introgressed during the speciation process separating A. thaliana and the ancestor of A. halleri/A. lyrata, shortening the divergence time estimated from these sequences.
Another factor that is likely to be important is that individual S-alleles (i.e., sets of alleles with the same specificity) have much smaller effective population sizes than genes not experiencing balancing selection because their Ne is reduced approximately proportionally to the number of specificities (Vekemans and Slatkin 1994). Their sequences are, therefore, likely to coalesce much more quickly within species than are alleles of other genes. Thus, diversity within each functional allelic class should very be low, as is indeed found in the A. lyrata SRK sequences (Charlesworth, Bartolome et al. 2003). Thus, unlike the usual situation, where alleles in 2 related species diverge before the split of the species (Gillespie and Langley 1979), in the case of a given S-allele, the split should almost coincide with that of the species, so that net divergence should be approximately the same as raw divergence. The difference between divergence for the sequences of 2 particular S-haplotype and the raw divergence for reference loci depends on the effective population size of the ancestral species, which is unknown. The following example shows that the difference could be substantial and compatible with the observations. Assume a generation time of 2 years, a constant effective population size of 500,000 in both the ancestor of A. halleri and A. lyrata and the ancestor of A. thaliana with the other 2 species, and 50 different functional specificities. The expected coalescence time in the ancestral species for 2 copies of a gene not under balancing selection would then be 500,000 × 2 × 2 = 2 Myr, whereas for 2 copies of the same specificity it would be 500,000 × 2 × 2/50, or only 40,000 years. Assuming that the time of the speciation event between A. lyrata and A. halleri was 2 Myr, and that between the ancestor of those two species and A. thaliana was 5 Myr, the respective total separation times for an S-allele lineage would be very close to twice those times (i.e., 4 and 10 Myr because their coalescence times in the ancestors would be close to zero). For reference genes unlinked to the S-locus, however, the expected values for the 2 speciation times are 8 (= 4 + 2 × 2) and 14 (= 10 + 2 × 2) Myr. Thus, we would expect synonymous divergence at the reference genes to be approximately twice that for S-alleles when comparing A. halleri and A. lyrata and 14/10 = 1.4 times greater when comparing A. thaliana with the other 2 species. These figures are not far from the observations summarized in table 5.
Comparison of Average Synonymous Divergence between Arabidopsis lyrata and Arabidopsis halleri Sequences Compared with Divergence with Arabidopsis thaliana for Two SRK Haplogroups and 10 Reference Genes Unlinked to SRK
Gene | Number of Synonymous Sites | Mean Divergence of A. halleri versus A. lyrata | Mean Divergence of A. halleri/lyrata versus A. thaliana | Ratioa | Source |
|---|---|---|---|---|---|
| ADH | 379 | 0.028 | 0.179 | 0.156 | GB1b |
| MTP1 | 364 | 0.079 | 0.143 | 0.552 | GB2c |
| CAD | 306 | 0.062 | 0.168 | 0.369 | ROd |
| CHI | 92 | 0.167 | 0.220 | 0.759 | RO |
| CHS | 409 | 0.079 | 0.178 | 0.444 | RO |
| DFR | 115 | 0.075 | 0.198 | 0.379 | RO |
| F3H | 150 | 0.120 | 0.123 | 0.976 | RO |
| FAH1 | 351 | 0.081 | 0.136 | 0.596 | RO |
| GS | 302 | 0.098 | 0.128 | 0.766 | RO |
| MAML | 130 | 0.020 | 0.142 | 0.141 | RO |
| Mean 10 genes | 233.8 | 0.081 | 0.162 | 0.500 | |
| SRK haplogroup A | 672 | 0.026 | 0.092 | 0.283 | This study |
| SRK haplogroup B | 615 | 0.029 | 0.086 | 0.337 | This study |
We are presently investigating this possibility in more detail by comparing sets of S-alleles between A. lyrata and A. halleri, together with genes linked to the S-locus and unlinked genes. This should allow us to disentangle the relative effects of these factors, test whether introgression rates are much higher for S-alleles as expected, and use the data to estimate ancestral population sizes during speciation processes in these plants.
These two authors contributed equally to this study.
Brandon Gaut, Associate Editor
We thank Adeline Courseaux and Camilla Håkansson for excellent technical assistance, Sophie Plouviez for control pollinations in A. halleri, and Valeria Ruggiero for compiling data from the reference genes. This study was supported by a French CNRS-ATIP grant from the Life Science Department, a Fonds Européen de Développement Régional grant from the European Union, and an Action de Recherche Concertée d'Initiative Régionale grant from the Région Nord-Pas de Calais to X.V.; by grant no. BB/D008859/1 from the Natural Environment Research Council of the United Kingdom to D.C.; and by grant 00001262 from the Danish Natural Sciences Research Council and grant no. 2052-01-0032 from the Danish Agricultural Sciences Research Council to M.H.S.
Funding to pay the Open Access publication charges for this article was provided by the Danish Agricultural Sciences Research Council.
References
Bechsgaard J, Bataillon T, Schierup MH.
Casselman AL, Vrebalov J, Conner JA, Singhal A, Giovannoni J, Nasrallah ME, Nasrallah JB.
Castric V, Vekemans X.
Charlesworth D.
Charlesworth D, Awadalla P, Mable BK, Schierup MH.
Charlesworth D, Bartolome C, Schierup MH, Mable BK.
Charlesworth D, Mable BK, Schierup MH, Bartolome C, Awadalla P.
Charlesworth D, Vekemans X.
Charlesworth D, Wright SI.
Chookajorn T, Kachroo A, Ripoll DR, Clark AG, Nasrallah JB.
Hall TA.
Hiscock SJ, McInnis SM.
Kamau E, Charlesworth D.
Koch M, Haubold B, Mitchell-Olds T.
Koch MA, Haubold B, Mitchell-Olds T.
Kumar S, Tamura K, Nei M.
Kusaba M, Dwyer K, Hendershot J, Vrebalov J, Nasrallah JB, Nasrallah ME.
Kusaba M, Nishio T, Satta Y, Hinata K, Ockendon D.
Lawrence MJ.
Mable BK, Beland J, Di Berardo C.
Mable BK, Schierup MH, Charlesworth D.
Marais G, Mouchiroud D, Duret L.
McDonald JH, Kreitman M.
Miege C, Ruffio-Chable V, Schierup MH, Cabrillac D, Dumas C, Gaude T, Cock JM.
Nasrallah ME, Liu P, Sherman-Broyles S, Boggs NA, Nasrallah JB.
Prigoda NL, Nassuth A, Mable BK.
Ramos-Onsins SE, Stranger BE, Mitchell-Olds T, Aguade M.
Richman AD, Herrera LG, Nash D, Schierup MH.
Rozas J, Sanchez-DelBarrio JC, Messeguer X, Rozas R.
Sainudiin R, Wong WS, Yogeeswaran K, Nasrallah JB, Yang Z, Nielsen R.
Sato K, Nishio T, Kimura R, Kusaba M, Suzuki T, Hatakeyama K, Ockendon DJ, Satta Y.
Sato Y, Fujimoto R, Toriyama K, Nishio T.
Schierup MH, Bechsgaard JS, Nielsen LH, Christiansen FB.
Schierup MH, Mable BK, Awadalla P, Charlesworth D.
Schierup MH, Vekemans X, Charlesworth D.
Shimizu KK, Cork JM, Caicedo AL, et al.
Stein JC, Howlett B, Boyes DC, Nasrallah ME, Nasrallah JB.
Takebayashi N, Brewer PB, Newbigin E, Uyenoyama MK.
Vekemans X, Slatkin M.
Author notes
*Ecology and Genetics, Institute of Biological Sciences, University of Aarhus, Denmark; †Laboratoire Génétique et Évolution des Populations Végétales, UMR CNRS 8016, Université Lille, France; and ‡ICAPB, University of Edinburgh, United Kingdom
