


Abstract
We describe analyses of almost full-length sequences (including both the kinase domain and the S-domain) of the putative SRK incompatibility gene of the self-incompatible plant Arabidopsis lyrata. In A. lyrata, the SRKS-domain controls the pistil recognition specificity, as in self-incompatible Brassica species. In alleles from plants derived from natural A. lyrata populations, nonsynonymous and synonymous site diversity values are very high in both domains; even in exons 3 to 7 of the kinase domain, which probably have no recognition functions, 39% of the amino acids are polymorphic. Within populations, diversity between alleles is high, as expected for an incompatibility locus, which should be under frequency-dependent selection within populations, whereas within the different putative allelic classes polymorphism is very low, as predicted from theoretical models when recombination is rare. Nonsynonymous site variability declines in the kinase domain with increasing distance from the S-domain border, although synonymous diversity remains high, and the introns are unalignable. A decline in nonsynonymous diversity is expected due to selective constraints in the kinase domain, in combination with recombination (allowing diversity to decrease at sites distant from those under balancing selection). However, it is unclear whether recombination occurs in the SRK locus, and interpretation of the observed diversity pattern is complicated by apparent gene conversion with a paralogous gene (or genes). Patterns of linkage disequilibrium in our SRK sequences do not support the conclusion that recombination occurs, which was suggested from previous analyses based on Brassica SLG sequences.
Introduction
Arabidopsis lyrata is a self-incompatible plant whose S-locus has recently been characterized. Like self-incompatible Brassica species, it has a sporophytic self-incompatibility system, and two genes determine plants' pollen and pistil incompatibility types (Nasrallah 2000; Kusaba et al. 2001). The A. lyrata pistil incompatibility locus, SRK, has been identified as a receptor serine-threonine kinase, and sequences of the extracellular “S-domain,” the region determining specificity of the cell-cell recognition reaction, have been compared from several different alleles (Kusaba et al. 2001; Schierup et al. 2001). Extremely high levels of nonsynonymous and synonymous polymorphism were found in this domain (Schierup et al. 2001), similar to the high diversity observed for sequences of gametophytic self-incompatibility alleles (e.g., Uyenoyama 1997).
The very high diversity in the S-domain makes it difficult to evaluate the relative effects of recombination, gene conversion, selection, and genetic drift on its sequence evolution. Saturation hinders detection of genetic exchange, and the fact that even the most similar alleles differ at more than 30% of sites in the S-domain (Schierup et al. 2001) makes it impossible to estimate the proportion of sites determining the specificity. Here we approach these problems by (1) studying the intracellular kinase domain and intervening introns to get much longer sequences and (2) sequencing several copies of each specificity.
Although the kinase domain is unlikely to be involved in determining specificity, polymorphism in this domain is also of great interest. It probably functions in initiating the cascade of events triggered by the recognition of incompatible pollen, so its sequence evolution may be constrained, and the level of nonsynonymous polymorphism should be lower than in the S-domain. Lower diversity and longer sequences should make diversity patterns clearer, in particular, allowing us to test whether synonymous variability declines with distance from the S-domain HV regions. If only the S-domain functions in specificity, neutral diversity should decline if recombination occurs. Studies of a more conserved region such as the kinase domain will also allow better tests for recombination in the S-locus, using patterns of linkage disequilibrium, since such tests are difficult if the sequence alignment is uncertain (Awadalla and Charlesworth 1999).
A study of exons 2 to 5 of eight different Brassica oleraceaSRK alleles suggests lower polymorphism in intron 4 than introns 2 and 3 (Nishio et al. 1997). These data do not show whether variability declines in a consistent manner in the kinase domain, as no quantitative analysis of diversity has been attempted, and the decrease in variability could be solely due to the high intron 2 variability. This intron includes many insertions and deletions (indels), making alignment uncertain, and it may have unusual mutational properties (it is adjacent to a transmembrane domain that has high AT content, which may be under different selective constraints from other parts of the protein).
Theoretical Expectations for Intraallelic and Interallelic Haplotype Structure
To understand the evolution of S-allele sequences, we must understand the factors that affect substitutions within and between these alleles. Polymorphisms at a locus under balancing selection, such as the S-locus, can be divided into variants that cause the functional differences and are themselves under balancing selection (these variants define different allelic classes/specificities) and neutral or weakly selected variants that are associated with the different allelic classes. Such associations are expected to persist for fairly long evolutionary times, because variants arising in a member of a given allelic class may increase in frequency and be fixed within the given class by genetic drift, but only recombination and/or gene conversion between allelic classes allow their movement to a different allele class. Like population subdivision, this can lead to sequence divergence between alleles of different functional classes and thus to linkage disequilibrium for neutral variants in a linked region (e.g., Strobeck 1983; Hudson and Kaplan 1988; Charlesworth, Nordborg, and Charlesworth 1997; McVean 2001). The degree of sequence differentiation, and the extent of the region of linkage disequilibrium, between functional allelic classes depends on the recombination frequency relative to the rate of mutational input of variants that do not affect the functional differences between the alleles. If recombination is absent or very infrequent, extreme haplotype structure may evolve, and neutral variants will often be found at intermediate frequencies in the set of alleles taken as a whole. Thus, only a minority of the variants in S-alleles, and the nearby genomic regions, may be maintained by balancing selection, and much of the diversity is probably a consequence of linkage to these few selected sites. The nonselected variants, including synonymous and intron polymorphisms, will nevertheless betray the operation of balancing selection, first by their high diversity and second because tests such as Tajima's test (Tajima 1993) will detect high variant frequencies.
Because there are many different S-alleles, several polymorphic amino acids must be involved in recognition functions (perhaps at least as many sites as the number of alleles, or lower if different specificities depend on combinations of amino acids; two alternative amino acids at six positions could potentially yield 26 = 64 alleles). If the specificity-determining amino acids occur throughout the S-domain, the region of increased diversity within the locus could thus be extensive (Navarro and Barton 2002; Nordborg and Innan 2003), rather than the sharp peaks expected when only a few alleles are maintained (for example at an allozyme locus where a single amino acid may distinguish the variants [see Hudson and Kaplan 1988]).
Divergence of S-allele sequences will not be restricted to synonymous differences. Even nonsynonymous mutations may drift to high frequency or fixation within classes if alleles do not recombine. Because of the strong selection maintaining a given specificity, an allelic class might accumulate deleterious substitutions without being lost from the population, especially because homozygotes are rarely formed, except for the most recessive S-alleles; recessive deleterious mutations are therefore not selectively eliminated. Thus, numerous amino acid differences in addition to those involved in determining the incompatibility types could accumulate, provided they are not strongly detrimental to the protein's function. The presence of such variants would then lead to minor fitness differences between allelic classes, which may be detectable from deviations from expected equilibrium frequencies in populations surveys.
These processes are accentuated because the maintenance of many different incompatibility types in a species implies low effective population sizes of individual allelic classes. In a gametophytic incompatibility system, the effective size of an allelic class in a panmictic population is approximately f*N, where N is the species' effective population size and f the harmonic mean of the frequency of the allelic class (Vekemans and Slatkin 1994). The effective size is always smaller than N/ne, where ne is the effective number of alleles. In sporophytic systems, more recessive alleles have larger than average effective population sizes (Uyenoyama 2000) but still much smaller than the species' effective population size.
The allelic classes' low effective sizes also imply low diversity among different members within each allelic class. Self-incompatible plant populations are, however, usually subdivided into more or less isolated demes, which will allow differentiation to build up within allelic classes between populations. However, although individual alleles may often be lost from a given deme, the strong advantage of rare S-alleles means that, unless the deme is completely cut off from migration, any lost allele that is still present in other populations will usually be restored. Differentiation is thus predicted to be low for different specificities at loci under balancing selection (such as S-loci) compared with other loci (Schierup, Vekemans, and Charlesworth 2000). On the other hand, extinction of allelic lineages in subpopulations and recolonization from other populations will further reduce the allelic effective population sizes compared with neutral reference genes, similarly to the effects in a metapopulation (Wade and McCauley 1988; Pannell and Charlesworth 1999; Schierup, Vekemans, and Charlesworth 2000). Thus, whereas allelic lineages themselves are ancient, and overall variability at these loci is high, the alleles within a given lineage may have a recent common ancestor, so that little polymorphism is expected within allelic classes.
In Brassica, there have been a few comparisons between sequences of the same functional S-allele from independent individuals. SRKS-domain sequences have been compared between pairs of haplotypes with the same incompatibility types. A pair of recessive (class II) B. oleraceaS2 alleles differ by 31/856 amino acids (97.3% amino acid identity), and a pair of the more dominant S13 alleles by 11/856 amino acids (99.8% amino acid identity) plus a 2-bp indel (Kusaba et al. 2000). In a larger sample of B. oleracea, SLG and SRK sequences from kale, broccoli, and Brussels sprout cultivars, alleles with the S2 specificity formed two haplotypes. These have different linked SLG locus sequences (SLGa or SLGb, differing by up to 12% of the amino acid sites) as well as lesser differences in their SRK sequences, all of them outside the hypervariable regions (Miege et al. 2001), suggesting that the different S2 alleles have existed for prolonged evolutionary times. In wild species, it is difficult to collect sets of alleles with the same specificity, and the only such data for gametophytic S-alleles is the study of one allele in Papaver rhoeas (Lawrence et al. 1993).
Here, we describe a study of SRK allele sequences from natural populations of A. lyrata. We provide sequences of a greater length of the kinase domain than has previously been available and analyze the sequence results from a set of 18 alleles, including within-allelic class variation for nine of them, to test the three questions outlined above: whether variability declines with distance from the S-domain HV regions, whether this is due to recombination in the S-locus, and whether patterns of diversity within and between allelic classes suggest recombination.
Materials and Methods
DNA Extraction and PCR Amplification
Genomic DNA was extracted from leaves of plants from different A. lyrata populations using Fastprep (Qbiogene). Standard PCR amplification conditions were as follows: denaturation at 94°C for 2 min followed by 10 cycles of 94°C for 15 sec, 48°C for 30 sec, and 68°C for 5 min; 21 additional cycles were performed using the same conditions followed by a final extension at 72°C for 10 min. To study the kinase domain, we did PCR amplification with Aly13 forward primers in the S-domain that are specific for individual SRK sequence subtypes known from previous sequencing of the S-domain (referred to as Aly13 subtypes [Schierup et al. 2001]), in combination with a general reverse primer near the end of exon 7 (13-4cR: 5′-TGA ACA CAC AAG AGA CCA ATC-3′). PCR amplification was done using a PTC-200 thermal cycler (MJ Research, Watertown, Mass.). When the amplification with this general reverse primer failed, we used a different primer near the beginning of exon 5 (SRKnasR3: 5′-CCA TCC CGA AAT CCG ATA TCT-3′). Given the large expected product lengths (up to 3.1 kb), we used Expand High Fidelity PCR System Taq polymerase (Roche Molecular Biochemicals). This is a proofreading polymerase optimized for amplification of genomic DNA fragments up to 5 kb (with a stated error rate of 8.5 × 10⁻⁶ per nucleotide [Frey and Suppmann 1995]).
Cloning and Sequencing
All Aly 13 sequence subtypes were cloned from PCR products using TOPO XL (Invitrogen, San Diego, Calif.). DNA sequencing was performed on an ABI 377 automatic sequencing machine using either Big Dye (Applied Biosystems, Foster City, Calif.) or Dyenamic (Amersham Biosciences). Sequences were checked manually for accurate base calling using Sequencher (Gene Codes Corporation). Details of the combinations of sequencing primers used for each allele can be obtained from the authors.
To compare sequences of the same allele from different individuals with known Aly13 subtypes, we studied two sequences of the same Aly13 subtype from the same population of origin and one from a different natural population. As will be seen, a given subtype scored in this way was found to yield almost identical sequences from different individual plants. To ensure that the few differences between sequences of the same Aly13 subtype were not caused by errors in the sequencing procedure, at least three clones were sequenced from the PCR product of each individual for a given Aly13 subtype. This gives an upper estimate of the extent of differences between the same subtype (counting all observed variants) and a lower estimate (discounting variants seen in only one clone).
Sequence Analysis
The nucleotide sequences were aligned using ClustalX version 1.81 (Jeanmougin et al. 1998), and manual adjustments were performed using the SeAl 1.0 sequence editor (http://evolve.zoo.ox.ac.uk/software/Se-Al/main.html). Intron-exon boundaries were determined by aligning our sequences with the published SRKa and SRKb cDNA sequences (Kusaba et al. 2001 [GenBank accession numbers AB052755 and AB052756, respectively]). This was verified using the program Splice Site Prediction by Neural Network (http://www.fruitfly.org/seq_tools/splice.html).
Neighbor-joining and minimum-evolution trees (both using Jukes-Cantor correction) were generated with MEGA version 2.1 (Kumar et al. 2000), using the Nei-Gojobori (1986) method. Trees were estimated for both synonymous and nonsynonymous sites, using the joint alignment of the Aly13 sequences from A. lyrata and several A. thalianaS-domain gene sequences. The A. thaliana genes ARK1, ARK2, and ARK3 encode S-domain proteins that are thought not to be involved in self-incompatibility (GenBank accession numbers M80238, AY045777, AL031187, respectively) and included to root the trees, and T6K22.100 is the putative ortholog of the Aly13 gene (in A. thaliana, T6K22.100 is a pseudogene [Kusaba et al. 2001]).
The nucleotide diversity among the sequences and divergence between Aly13 subtypes from different populations were estimated using the program MEGA (Kumar et al. 2000). Nucleotide positions with indels were removed from the analysis, and most of our analyses were restricted to the exons because the introns were largely unalignable between allelic classes (see below).
Analysis of Recombination
We tested for recombination in the Aly13 sequences, using two methods. The first uses the relationship between linkage disequilibrium (LD) and the distance between polymorphic sites (Awadalla and Charlesworth 1999). Significance of the correlation coefficients of two LD measures with distance (r2 or D′) was determined from 5,000 random permutations of the variable sites using the R2 program (http://www.daimi.au.dk/∼compbio/r2). The second analysis is based on pairs of sites (Hudson 2000) using the composite likelihood finite sites extension to this method (McVean, Awadalla, and Fearnhead 2002), implemented in the LDhat program (http://www.stats.ox.ac.uk/∼mcvean). It is not clear how this approach is affected by balancing selection, but simulations show that LDhat does not falsely infer recombination when balancing selection acts in the absence of recombination (M. H. Schierup, unpublished data). With our data, the results were similar to those of the first approach. Because the sequences include intron regions that differ in length, distances between sites were assumed to include introns with lengths equal to the median length for each intron. Sites with gaps (or missing sequence) in more than two of the sequences were excluded from the analysis. Because of the uncertainty about the evolutionary history of a subset of the sequences, analyses were done on four different subsets of the sequences (see below)
Results
Diversity of the Aly13 Sequences
We sequenced samples of different Aly13 subtypes (putative SRK alleles) amplified from DNA of plants collected in Michigan and North Carolina in the United States, in Scotland, and in several locations in Iceland (see table 1). The sequences were between 2 and 3.1 kb in length and included most of the gene, from the middle of the S-domain to the beginning of exon 7 (or exon 5, in a few cases). The sequences are highly diverse, and several regions cannot reliably be aligned, including all introns, exon 2 (the putative transmembrane domain), and the 5′ portion of exon 3.
Synonymous diversity is high throughout the sequence. As expected for alleles at a single locus, and observed for other S-allele data sets (e.g., Sato et al. 2002), the trees are not well resolved overall, but there are clearly two different kinds of sequences. A subset of six of the sequences (“set B”) differ only moderately from one another in the kinase domain. This is evident in the gene trees (for both synonymous and nonsynonymous sites) of the A. lyrataAly13 sequences (fig. 1). For the kinase domain (exons 3 to 7), the set B sequences are strikingly diverged from the other cluster of sequences (“set A”), with bootstrap support values of 100% for either synonymous or nonsynonymous sites (fig. 1C and D). The A and B sets also differ in the intron and exon lengths, particularly intron 1 (see table 2 below). Most of the length differences between the two sets involve the region between intron 1 and intron 3, with fewer differences in the S-domain (exon 1) or after the end of intron 3. For the S-domain (exon 1), the set B sequences also cluster together. In this domain, however, they differ greatly from one another, like the set A sequences and unlike the situation in the kinase domain. Based on synonymous sites, the set B S-domain cluster has 70% bootstrap support, suggesting some common ancestry for this sequence set (fig. 1A). Using nonsynonymous sites, however, there is 99% bootstrap support for a cluster of four set B S-domain sequences, whereas two of them (13-2 and 13-7 in fig. 1B) cluster separately.
The set A sequences are more similar to the nonfunctional A. thaliana putative SRK ortholog, T6K22.100, than set B (see fig. 1). Set A sequences therefore probably represent the A. lyrata locus orthologous to the A. thaliana T6K22.100; their net divergence Dxy (Nei 1987) and nonsynonymous divergence from T6K22.100 are 0.285, and 0.198, respectively. For set B, the values are 0.402 and 0.287, suggesting that these sequences may be from a paralogous locus (or more than one locus). All the set A sequences have been shown to be linked to the S-locus (Schierup et al. 2001; J. Bechsgaard, L. H. Nielsen, and M. H. Schierup, unpublished data), whereas subtypes 13-2 and 13-7 are unlinked to other subtypes. Linkage data for families with set B sequences are shown in table 3. The results for Aly13-2 were reported in Schierup et al. (2001) but are included in table 3 to show the segregation of the other sequence types. In each family, the parent plant that has three sequence types is informative about linkage of its subtype 13-2 or 13-7 sequences to the other Aly13 subtypes. The first conclusion from the results in this table is that two types segregate as alleles, whereas presence/absence of the 13-2 or 13-7 (as appropriate) segregates independently; that is, the parent can pass four different combinations of sequence types to the progeny (either of the two set A alleles, with or without the 13-2 or 13-7 sequence). The other parent plant's Aly13 alleles always cosegregate with incompatibility alleles in these families, as expected; each progeny plant had one sequence or the other, and the ratios within each family conform to 1:1 (table 3). A second important conclusion is that, unlike 13-2 and 13-7, three of the four other set B sequences, Aly13-3, Aly13-6, and Aly13-14, segregate from the alleles that are linked to the S-locus, although a non-1:1 ratio was found for Aly13-6 (table 3); no segregation data are available for Aly13-8.
These puzzling results can be explained by gene conversion between two or more different loci. The differences in the extent of sequence divergence between and within the two sets of sequences (fig. 1 and tables 4 and 5) show that the two domains have different evolutionary histories. On average, pairs of set B sequences differ at 80 sites in the S-domain, and at 17 sites in the kinase domain versus 30 and 80 fixed differences from the set A sequences in the two domains, respectively; this difference is highly significant by a chi-square test. We cannot, however, define the position and size of any possible patches of gene conversion precisely, due to the great polymorphism of these sequences (see Discussion).
Alleles of both sets A and B are present in natural populations. In extensive surveys of Icelandic populations, the set B alleles 6 and 14 were both found, and Aly13-7 was present in about 20% of plants, but Aly13-2 sequences were rarer (L. Nielsen, M. H. Schierup, and B. K. Mable, unpublished data). It is not known whether all A. lyrata individuals have sequences of this type, but plants are found with neither Aly13-2 or Aly13-7.
The segregation results of the putative S-alleles in the families shown in table 3 are consistent with the plants' incompatibility types. The set A sequences, and the B sequences that are linked to the S-locus, behave indistinguishably in this respect and are therefore probably functional SRK alleles. We cannot exclude the possibility that the linked group B sequences might come from a paralogous locus with no function in SI but located in the S-locus genome region. However, the 13-6 sequence is expressed in flower buds but not in leaves, consistent with being an S-allele. In contrast, the unlinked 13-7 sequence has the opposite expression pattern (N. Prigoda and B. K. Mable, unpublished data). Interestingly, the two set B subtypes that have been tested (Aly13-6 and Aly13-14) are both recessive (L. Nielsen and M. H. Schierup, unpublished data), whereas the set A alleles so far tested are dominant or partially dominant (13-9, 13-12, 13-13, 13-15, and 13-22) or of intermediate dominance (alleles 13-16 and 13-25) (Mable, Schierup, and Charlesworth 2003; L. Nielsen and M. H. Schierup, unpublished data).
Functional Domains
The two alleles studied by Kusaba et al. (2001) were identified from cDNA. Among our sequences, Aly13-13's S-domain is almost identical with that of the SRKa allele, and Aly13-20 matches allele SRKb of Kusaba et al. (2001). Thus, at least some of our set A sequences probably encode functional SRK proteins. Moreover, several putative functional domains are recognizable in our sequences. There is a sequence similar to the phosphorylation site and ATP-binding region of other serine-threonine kinase domains, starting near the end of exon 3 and extending into exon 4. In exon 5, amino acids 35 to 47 resemble the serine/threonine kinase active site, including the motif (from residues 39 to 44) DLKASN. Finally, the last two amino acids of exon 5 and the first seven in exon 6 form a motif GTYGYMAPE. These motifs are also present in BrassicaS-linked loci (Suzuki et al. 1999). All set A sequences and the A. thaliana sequence T6K22-100 have the DLKASN motif, but the set B sequences all have the A replaced by T, as do the kinase regions of the paralogous genes Aly8, Aly101, and 10.2 (see Schierup et al. 2001). The GTSGYMAPE motif is found in set B, whereas the A sequences (and T6K22-100) have S instead of A in the second position.
The region for which we have sequence data includes 14 amino acids that are conserved in all known protein kinases, including the BrassicaSRK sequences (Kusaba et al. 2000). All these are invariant in our sequences, of both sets A and B. In the 13 amino acids of the putative kinase active site, there is only one polymorphism in the set A sequences, but those of set B differ in three of these residues. In exons 3 and 4, the sequences deviate more from other sequences. Of the 35 amino acids spanning the putative phosphorylation site and ATP-binding region, only 18 do not vary in our sequences; 14 of these sites are polymorphic in the 12 sequences of set A (there were also three fixed differences from the set B sequences, and four polymorphisms within set B, three of which are also polymorphic sites in set A).
Diversity of the Allele Sequences
Within both sets of sequences, there is considerable diversity (figs. 1 and 2 and tables 4 and 5). Set A sequence diversity at both synonymous and nonsynonymous sites in exon 1 exceeds even the very high level in BrassicaSRK sequences; for synonymous sites, the respective S-domain diversity values are about 18% (Sato et al. 2002), compared with about 45% (table 4). Extremely high polymorphism extends into the kinase domain region, and none of the introns can be aligned between the set A putative alleles. Within both A and B sequence sets, the introns contain indel variants; intron 1 lengths range from 341 to 1246 bp among the set A sequences, and also vary among the set B sequences (table 2). As in the BrassicaSRK kinase (Hinata et al. 1995; Nishio et al. 1997), indel variants are found in the S-domains (Kusaba et al. 2001; Schierup et al. 2001) and also in exons 2 and 3.
Nonsynonymous diversity is also very high among both set A and B sequences (fig. 1 and tables 4 and 5). Among the 12 type A sequences compared, 101 of the 258 amino acids in exons 3 to 7 of our kinase domain sequences are polymorphic (more than 39%), and 55 (almost 21%) have more than two different amino acids (fig. 3). Unlike synonymous variation, nonsynonymous diversity in set A sequences declines in the kinase domain (fig. 2 [note that the exon 7 result is based on only 69 nucleotides, so the increase in diversity is nonsignificant]).
There is less diversity among the smaller set of sequences of set B (note the different scale of the y-axis of the set A and B graphs in fig. 2 and the scale difference in fig. 1). For set B, exon 2 and part of exon 3 align poorly with the reference sequences, so the boundaries of these exons are uncertain, which may slightly affect diversity values for this region. It is nevertheless clear that diversity is very high in the S-domain, although rather less than among the set A sequences. After exon 2, however, the introns are alignable among the set B sequences, and the intron and synonymous site diversity values are around 10%, whereas nonsynonymous site diversity declines to very low values after intron 3 (table 5 and fig. 2).
Polymorphism Within Putative Allelic Classes
If the Aly13 kinase sequences are indeed S-alleles, the allelic diversity should be present within populations rather than between different populations. To compare within-allelic types, we therefore obtained the following data set. For each subtype (see Materials and Methods), two individuals were sampled from the same population of origin, and one from a different natural population, yielding sets of three sequences of nine different putative alleles, five from set A and four from set B (table 6). The results show that the high Aly13 diversity cannot be attributed to divergence between sequences from different populations. The diversity within each subtype is very low, even in the introns, contrasting strongly with the extreme differences between the sequences of the subtypes described above, even those from the same population. Even the least conservative estimate of the numbers of differences between the sequences of the same subtype has a maximum of eight differences out of 3.19 kb of sequence of allele 22, and less than half this for all other alleles (five of them showed no differences in at least 2.52 kb). Four further subtypes (Aly13-5, Aly13-13, Aly13-19, and Aly13-20) provided pairs of sequences from two plants from one population; of these, there was a single nonsynonymous difference in Aly13-13.
Analyses of Recombination Between Alleles
If the SRK alleles recombine, LD should decline with distance within each domain individually (as was found for the BrassicaSLG locus by Awadalla and Charlesworth [1999]). Both methods of analysis (see Materials and Methods) gave similar results, so we here show in detail only those from the relationship between linkage disequilibrium between polymorphic sites and distances between sites. When both the kinase and S-domain sequences are included, both LD measures declined significantly with distances between the sites for all four sets of sequences analyzed (table 7), suggesting recombination within the Aly13 locus. This is surprising, since if some set B sequences (table 7) are paralogous, one might expect linkage disequilibrum between the sequences of two loci.
However, a decline in linkage disequilibrium can occur even in the absence of recombination, if sites in one domain have high LD values, and it is low between sites in the other domain. Sites from the two domains would then be expected to have low LD, even without recombination. One possible reason for such between-domain differences is mutation rate differences (Innan and Nordborg 2002), and others are discussed below. We therefore analyzed the two domains separately. LD estimates are lower in the S-domain than within the kinase domain; between the two domains, LD is somewhat lower than in the kinase domain (table 8). Moreover, the significant decline in linkage disequilibrium with distance for the whole sequence largely disappears when either domain is analyzed separately (table 7). The relationship between LD measures and distance between polymorphic sites gives no strong signal of recombination for the kinase domain (even though there are many pairs of polymorphic sites distant enough to detect this). Only one set of sequences, those known to be linked to the S-locus, suggest recombination, but the significance level is low (table 7 [with the LDhat analysis, it is nonsignificant]). There is no evidence for recombination in this domain for the set B sequences, despite the evidence (see above) for gene conversion between some of them and set A.
Discussion
Recombination of Self-Incompatibility Genes
The evolution of the A. lyrataSRK gene seems to be surprisingly complex. In addition to the locus already identified and the other known S-domain loci with low levels of polymorphism (which are more diverged than the set A and B sequences studied here, and several of which are unlinked to the S-locus [Charlesworth et al. 2003]), one or more very similar loci appear to exist. This makes it difficult to analyze the SRK diversity in this species, particularly to determine which regions are most important for recognition functions. Although it is predicted that variants in the recognition regions will be maintained by balancing selection and that these regions will therefore have very high variability, it is unlikely to be simple to define the functional regions just by studying variability. Only if recombination is frequent will it be possible to pinpoint the target of selection (Schierup, Mikkelsen, and Hein 2001).
In Brassica, the different S-allele haplotypes have different lengths and genes arrangements and even differences in gene content (reviewed by Nasrallah 2000), so recombination would certainly be surprising, and it has long been believed that the S-loci are in a nonrecombining region of genome. The existence of separate genes for the pollen and pistil recognition functions, which have recently been documented in both Brassica (Schopfer, Nasrallah, and Nasrallah 1999; Suzuki et al. 1999) and A. lyrata (Kusaba et al. 2001), makes it plausible that recombination is suppressed to maintain coadapted sets of the two different kinds of loci (or else that the S-locus is in a region where recombination rarely occurs, such as a centromeric region; however, the orthologous region in A. thaliana, on chromosome 4, is in the middle of the long arm, distant from the centromere).
The question of recombination is also important in relation to the analysis of S-allele sequence results. If recombination occurs, one cannot use the gene tree to estimate the phylogeny of these sequences. Ignoring recombination, the times of origination of alleles are overestimated, whereas including recombination can potentially explain the observed long external branches of the phylogenies of S-alleles (Schierup, Mikkelsen, and Hein 2001), without the need to appeal to selection at linked sites (Uyenoyama 1997; Charlesworth and Awadalla 1998).
Our observation of very high diversity, even in the kinase domain, is in general consistency with the belief that SRK alleles do not recombine with one another. This domain includes many amino acid residues that must probably be conserved for the protein to function and which are indeed conserved between widely different receptor kinases. The decreased nonsynonymous diversity in the A. lyrataSRK set A sequences (from 20% or higher in exons 1 and 2 to below 10% for exons 3 onwards) may be due to such selective constraints, but constraints predict the lowest diversity in the most functionally important regions and cannot explain the steadily decline in diversity with distance from the S-domain, whereas recombination could explain this pattern.
Synonymous site diversity, however, remains extremely high, and the introns are unalignable. In Brassica oleracea also, there is considerable diversity in exon 5 (Nishio et al. 1997). If recombination occurs, sites as far distant from the S-domain as exons 5 to 7 of the SRK kinase domain might be expected to have much lower synonymous diversity, judging from other data on genes under balancing selection. In MHC genes, diversity is specifically elevated near the codons for antigen recognition sites (e.g., Bergström et al. 1998). Theoretical analyses also suggest that peaks of elevated diversity will be restricted to sites very close to the targets of balancing selection (Hudson and Kaplan 1988; Nordborg, Charlesworth, and Charlesworth 1996; Andolfatto and Nordborg 1998; Takahata and Satta 1998). On the other hand, we cannot currently predict the rate of fall-off in diversity in the S-locus region, whose local recombination rate is unknown in either Brassica or A. lyrata. It is possible that these genes are in a region of low, but not zero, recombination, so that diversity, and linkage disequilibrium fall off slowly away from sites under balancing selection.
The observed high diversity in the kinase domain is, of course, only indirect evidence for linkage to a region experiencing balancing selection. A different explanation could be compensatory evolution: changes in the S-domain creating a new specificity might lead to sequence evolution in the kinase domain. Polymorphism in the kinase domain would then be related to the balancing selection in the S-domain (each allele's kinase domain would coadapt with its respective S-domain). Compensatory change in the kinase domain seems unlikely, given that it is intracellular and presumably functions independently of the extracellular S-domain (see Nasrallah 2000). The sequence polymorphism data also argue against such balancing selection. We observe a fairly steady fall-off in nonsynonymous diversity in the kinase domain (see fig. 2), whereas coadaptation should produce peaks of diversity close to the sites within this domain that are under selection. Coadaptation should also cause linkage disequilibrium between sites that define functional allelic classes, which is not observed. LD is low between the kinase and S-domains, although, as discussed next, this may be due to unusual evolutionary properties of the S-domain.
It is therefore clearly important to test for recombination. Our explicit tests do not show convincing evidence for reciprocal recombination between different SRK alleles. Tests based on the entire sequence are not convincing evidence for reciprocal recombination, since tests on the kinase domain alone are, at most, weakly statistically significant, suggesting that LD differences between the two domains (see above) may explain the declining LD with distance between polymorphic sites across the entire sequence. Of the various potential reasons for LD differences between the two domains, a mutational hotspot (see Innan and Nordborg 2002) in the S-domain seems unlikely because synonymous diversity is high throughout the gene (see fig. 2). Other possibilities are different levels of functional constraint at nonsynonymous sites, and/or occasional gene conversion of small segments in the S-domain that have destroyed linkage disequilibrium. Given the extremely long divergence times between allelic sequences (necessary to account for the high variability between alleles), these processes could create homoplasies in the S-domain. Gene conversion in the S-domain, involving different SRK alleles, would act like reciprocal recombination to reduce differences between alleles, except close to sites under balancing selection, perhaps explaining why set B alleles are less clearly distinct from set A alleles in the S-domain trees (fig. 1).
Diversity Within and Between Allelic Classes
The observed very low diversity within allelic classes of sequences is also consistent with lack of recombination. As outlined above, if recombination is very infrequent, individual alleles within a given allelic class will have a recent common ancestor, so that alleles with the same specificity are expected to have similar sequences. As predicted, the high overall A. lyrataSRK variability is due to differences between allelic classes and concomitant extensive haplotype structure. This has also been found for fungal incompatibility alleles (May et al. 1999). Our results, with very similar sequences in different individuals, even from different populations, but extreme differences between the different sequences, further support the other evidence that these sequences represent S-alleles with different specificities.
These observations contrast with those for the human HLA locus DRB1. In DRB1, serologically defined allelic lineages include considerable diversity in exon 2, which includes the antigen recognition site codons, whereas the adjacent exons and other introns are very homogeneous within the allelic classes, particularly when compared with divergence between them (mean respective pairwise divergence, k, values were 0.0007 for exons versus 0.086 for introns [Bergström et al. 1998]). The high exon 2 diversity within these allelic lineages is due to high nonsynonymous polymorphism in the antigen recognition site codons. Within classes, the mean ka for these codons is 0.065, based on five lineages with multiple sequences analyzed. ka/ks for these sequences averages 0.75, although for no allelic class did ka/ks exceed 1. In contrast, for divergence between allelic classes, the mean Ka was 0.38, almost three times the synonymous divergence. Non–recognition-site codons in exon 2 had a ka/ks averaging 0.08 within allelic classes and 0.47 between classes (Bergström et al. 1998). This suggests that recognition site codons experience much faster replacement substitutions than other nearby codons. This could be due to diversifying selection generating new specificities within allelic classes or to rapid amino acid replacement caused by the low effective size within lineages at sites that do not recombine with the selected codons. Potentially, these two possibilities may be distinguishable by comparisons between human populations. If selection is leading to rapid diversification of sequences within serological lineages, isolated populations might be expected to show excess differences, specifically at nonsynonymous sites in these codons. This possibility represents an interesting difference between HLA genes and S-alleles, as incompatibility loci presumably retain the same specificities over long evolutionary times (Shiba et al. 2002). However, other possibilities for the DRB1 data cannot yet be ruled out, including recombination directed to highly specific regions of exon 2 (Bergström et al. 1998).
Gene Conversion (Entire Sections Revised)
An intriguing result in our study is the finding of unlinked sequences much more similar to the SRK sequences than to other paralogous loci and extremely similar to a subset (“B”) of SRK sequences. This suggests exchange of sequence information between different S-domain loci, making it essential to test every putative SRK allele for linkage to the S-locus. Without linkage information, one cannot tell whether a new sequence is an allele of the SRK locus. The two unlinked set B sequences (Aly13-2 and Aly13-7) could represent a locus (or perhaps even two loci) that originated through duplication of an allele from the SRK locus to a different genomic location. This, however, must presumably have been a single event, which cannot account for the rather high diversity among the set B sequences (around 10% for both intron sites and silent sites in exons other than the S-domain [see table 5] while intron 1 cannot be readily aligned). Nucleotide diversity estimates for other A. lyrataS-domain loci (paralogs, see Charlesworth et al. 2003) and other loci (Wright, Lauga. and Charlesworth 2003) are only about 1% to 2%.
A more likely alternative is gene conversion involving SRK and another locus. Gene conversion between alleles in the S-locus region has been suggested several times in Brassica (Miege et al. 2001), for instance to explain the great similarity between the SLG8 and SLG46 alleles of Brassica campestris, which differ in their specificities but are identical in the three hypervariable regions and are 97.5% similar in their overall amino acid sequences (Kusaba et al. 1997). Conversion involving tandemly duplicated loci is well known to cause different evolutionary histories for different linked regions (e.g., Wang, Magoulas, and Hickey 1999; Araki, Inomata, and Yamazaki 2001; Drouin 2002), and there is evidence for gene conversion between the linked SRK and SLG genes in Brassica, whose gene trees show discordant evolutionary histories (Sato et al. 2002). Gene conversion events between paralogous sequences have been detected in tetraploid fish (Angers, Gharbi, and Estoup 2002) and in plants between paralogous resistance genes (Sun et al. 2001), actin genes (Moniz de Sá and Drouin 1996; Drouin et al. 1999), and ribosomal DNA genes (Buckler, Ippolito, and Holtsford. 1997). Gene conversion is also strongly suggested between different loci in the MHC cluster of genes (Martinsohn et al. 1999).
Like the gene conversion just mentioned between SRK and SLG, transfer of sequences might occur between the S-locus and a paralogous S-domain gene. The possibility of gene conversion involving the SRK locus does not necessarily imply that recombination must occur in this region. It is increasingly clear that, in Drosophila, genome regions with little or no recombination nevertheless undergo gene conversion (Langley et al. 2000; Jensen, Charlesworth, and Kreitman 2002). Our results in A. lyrata might represent another case.
It seems unlikely that transfer introduced S-locus variants to the other gene. As argued above for a single duplication event, one such conversion cannot account for the differences between the two set B sequences that are unlinked to SRK, assuming that these represent a single locus; whether these sequences come from one or more loci is, however, not yet known. Transfer in the other direction seems more likely, introducing variants to the S-locus from a less diverse locus and thus reducing the differences between certain SRK alleles. It is unknown whether the transfer was a single event or repeated. It may be helpful to obtain sequences of the SCR alleles of the haplotypes with set B alleles that are linked to the S-locus (Aly13-3, Aly13-6, Aly13-8, and Aly13-14), to help define the size and nature of the region of genome in which these haplotypes have similar sequences. With a single transfer, the linked set B sequences must have diversified after the event, which could account for these four sequences' S-domains forming a cluster (fig. 1). The much higher diversity of their S-domains, compared with the kinase domains, would then imply more rapid accumulation of substitutions in the S-domain during divergence of these sequences since the transfer event, suggesting different mutational properties, very different selective constraints, or gene conversion events with the set A S-domains.
Present address: Department of Botany, University of Guelph, Guelph, Ontario, Canada.
Adam Eyre-Walker, Associate Editor
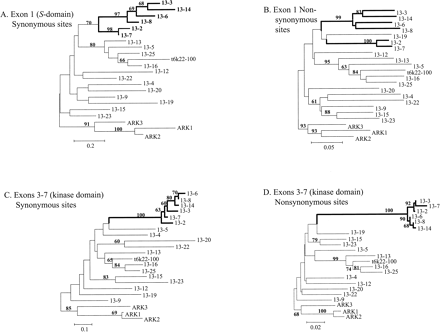
Gene trees constructed from the joint alignment of the A. lyrataAly13 sequences together with several sequences from A. thaliana, showing the two different domains (the S-domain in panels A and B, and, in panels C and D, the parts of the kinase domain that are included in our sequences). The horizontal lengths of branches represent Nei-Gojobori (1986) sequence distances
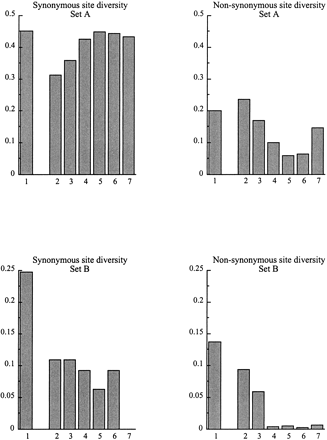
Synonymous and nonsynonymous site diversity values in the exons of A. lyrataAly13 sequences of sets A and B, showing the two different kinds of sequences. The Nei-Gojobori (1986) measure of sequence distances was used. Due to the primers used, exons 1 and 7 are incomplete. The numbers of nucleotide sites analyzed in each exon are given in tables 4 and 5
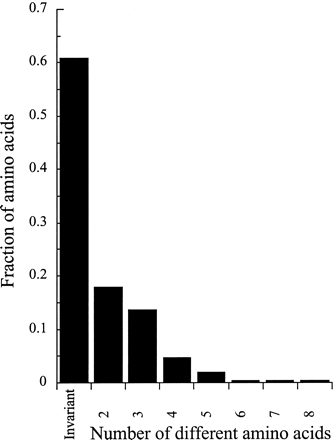
Amino acid diversity in exons 3 to 7 of 12 A. lyrataAly13 kinase set A sequences, showing the numbers of amino acid variants at individual codons. For exon 3, the numbers are based on the region for which both sets A and B can be aligned; the number of codons is smaller than for the region used to calculate the results in table 4, which considered set A alone
Sources of the Plants Studied.
| Country | Locality | Population Name |
|---|---|---|
| Iceland | Blue Lagoon | B |
| Reykjavik | R | |
| Lava field | L | |
| Reykjanes Peninsula | T | |
| Scotland | Braemar | SC |
| USA | Near Lake Michigan, Porter, Indiana | MI |
| Mayodan, North Carolina | NC |
| Country | Locality | Population Name |
|---|---|---|
| Iceland | Blue Lagoon | B |
| Reykjavik | R | |
| Lava field | L | |
| Reykjanes Peninsula | T | |
| Scotland | Braemar | SC |
| USA | Near Lake Michigan, Porter, Indiana | MI |
| Mayodan, North Carolina | NC |
List of Sequences (Subtypes) Classified as Set A or B and Intron 1 Lengths.
| Subtype | Linkage | Length of Intron 1 |
|---|---|---|
| Set A | ||
| 4 | Linked | 341 |
| 5 | Linked | 830 |
| 9 | Linked | 570 |
| 12 | Linked | 1019 |
| 13 | Linked | 451 |
| 15 | Linked | 647 |
| 16 | Linked | 604 |
| 19 | Linked | 443 |
| 20 | Linked | 487 |
| 22 | Linked | 1246 |
| 23 | Linked | 1246 |
| 25 | Linked | 1246 |
| Set B | ||
| 2 | Unlinked | 173 |
| 3 | Linked | 504 |
| 7 | Unlinked | 598 |
| 6 | Linked | 790 |
| 8 | not tested | 602 |
| 14 | Linked | 586 |
Segregation of the Aly13 Sequence Types.
| Parent Plant 1 | ||||||||||||
|---|---|---|---|---|---|---|---|---|---|---|---|---|
| Family | Plant Number | Aly13 Sequence Types | Parent Plant 2 Number and Alleles | Alleles from Parent 1 | ||||||||
| B-7/8a | 99R-11/3 | 6 + x + 7 | 99R-35/5 | 6 and 7 | 6 + not 7 | x + not 7 | x and 7 | Totals | ||||
| 9 | 3 | 3 | 0 | 3 | 9 | |||||||
| 22 | 4 | 1 | 4 | 1 | 10 | |||||||
| B-5/6b | 99R-9/5 | 1+ 14 + 7 | 99R-35/5 | 14 + 7 | 14 + not 7 | 1 + 7 | 1 + not 7 | Totals | ||||
| 9 | 5 | 2 | 3 | 1 | 11 | |||||||
| 22 | 5 | 1 | 2 | 1 | 10 | |||||||
| B-3/4c | 99R-11/3 | 6 + x + 7 | 99R-19/2 | 6 and 7 | 6 + not 7 | x + not 7 | x and 7 | Totals | ||||
| 1 | 4 | 6 | 6 | 3 | 19 | |||||||
| 6 | 5 | 11 | 16 | |||||||||
| MS00C-32 | MS99C-15/1 | 11 + 22 + 7 | MS99A-2/8 | 11 and 7 | 11 + not 7 | 22 + not 7 | 22 and 7 | Totals | ||||
| 4 | 1 | 1 | 5 | 1 | 8 | |||||||
| 16 | 2 | 2 | 3 | 0 | 7 | |||||||
| 98E-15 | 97F-15/3 | 3 + 23 + 2 | 97F-13/5 | 3 and 2 | 3 + not 2 | 23 + not 2 | 23 and 2 | Totals | ||||
| 1 | 0 | 3 | 2 | 1 | 6 | |||||||
| 13 | 4 | 1 | 4 | 0 | 9 | |||||||
Note.—In each family, one parental plant (designated parent plant 1) has three Aly13 sequence types, including Aly13-7 (the first four families) or Aly13-2 (the final family in the table). The third column lists, for each family, the two linked alleles and the apparently unlinked sequence in parent 1 (the parent that is informative about the linkage of the Aly13-2 and Aly13-7 variants in relation to the other Aly13 sequences), and the fourth column gives the Aly13 sequences in the other parent (parent 2, with two sequence types in each case). For each family, the segregation of the three parent 1 sequence types is shown in the columns labeled ‘Alleles from Parent 1,’ with one row for each of the two parent 2 sequence types. When an allele has not been sequenced, it is denoted by ‘x.’
a The B families include both reciprocals, and therefore each has two family numbers (e.g., 7/8).
b In one of the B-5/6 families, one progeny plant had only one allele detected (from parent 2), so there is one fewer in the total data from parent 1 than 2. Most likely this was allele 13-1, which frequently does not amplify well (in that case, the ‘1 + not 7’ cell would have three instead of two progeny plants).
c Both parents of the B-3/4 families carry the sequence Aly13-6, making it impossible to distinguish between progeny of the 6 + 7 and x + 7 classes (and between 6 + not 7 versus x + not 7) except for progeny plants with allele 1 from their 99R-19/2 parent. The table therefore shows the indistinguishable classes pooled.
| Exon | |||||||||||||
|---|---|---|---|---|---|---|---|---|---|---|---|---|---|
| 1 (S-Domain) | 2 (Transmembrane Domain) | 3 | 4 | 5 | 6 | 7 | |||||||
| Length (bp) | 357–369 | 129–141 | 189–198 | 210 | 237 | 153 | 69 | ||||||
| Number of variable sites | |||||||||||||
| Synonymous | 137 | 41 | 72 | 80 | 82 | 52 | 25 | ||||||
| Nonsynonymous | 225 | 99 | 106 | 66 | 43 | 25 | 32 | ||||||
| Nucleotide diversity (π) | |||||||||||||
| Total | 0.257 | 0.252 | 0.213 | 0.173 | 0.144 | 0.147 | 0.209 | ||||||
| Synonymous sites | 0.451 | 0.311 | 0.357 | 0.426 | 0.448 | 0.442 | 0.433 | ||||||
| ± SE | 0.025 | 0.047 | 0.037 | 0.036 | 0.040 | 0.041 | 0.056 | ||||||
| Nonsynonymous sites | 0.200 | 0.236 | 0.170 | 0.099 | 0.060 | 0.064 | 0.147 | ||||||
| ± SE | 0.018 | 0.019 | 0.018 | 0.018 | 0.011 | 0.017 | 0.031 | ||||||
Note.—Set A. Only 10 subtypes have sequences extending beyond exon 5, so the sample size is 10, not 11, for exons 5 to 7. Exons 1 and 7 are incomplete. Intron diversity is not shown, because the introns cannot be aligned reliably. The lengths of introns 2 to 6 are 77 to 107, 64 to 117, 73 to 94, 78 to 111, and 74 to 91.
| Exon | |||||||||||||
|---|---|---|---|---|---|---|---|---|---|---|---|---|---|
| 1 (S-Domain) | 2 (Transmembrane Domain) | 3 | 4 | 5 | 6 | 7 | |||||||
| Length (bp) | 357–369 | 129–141 | 189–198 | 210 | 237 | 153 | 69 | ||||||
| Number of variable sites | |||||||||||||
| Synonymous | 137 | 41 | 72 | 80 | 82 | 52 | 25 | ||||||
| Nonsynonymous | 225 | 99 | 106 | 66 | 43 | 25 | 32 | ||||||
| Nucleotide diversity (π) | |||||||||||||
| Total | 0.257 | 0.252 | 0.213 | 0.173 | 0.144 | 0.147 | 0.209 | ||||||
| Synonymous sites | 0.451 | 0.311 | 0.357 | 0.426 | 0.448 | 0.442 | 0.433 | ||||||
| ± SE | 0.025 | 0.047 | 0.037 | 0.036 | 0.040 | 0.041 | 0.056 | ||||||
| Nonsynonymous sites | 0.200 | 0.236 | 0.170 | 0.099 | 0.060 | 0.064 | 0.147 | ||||||
| ± SE | 0.018 | 0.019 | 0.018 | 0.018 | 0.011 | 0.017 | 0.031 | ||||||
Note.—Set A. Only 10 subtypes have sequences extending beyond exon 5, so the sample size is 10, not 11, for exons 5 to 7. Exons 1 and 7 are incomplete. Intron diversity is not shown, because the introns cannot be aligned reliably. The lengths of introns 2 to 6 are 77 to 107, 64 to 117, 73 to 94, 78 to 111, and 74 to 91.
| Region | |||||||||||||||||||||||
|---|---|---|---|---|---|---|---|---|---|---|---|---|---|---|---|---|---|---|---|---|---|---|---|
| Exon 1 | Exon 2 | Intron 2 | Exon 3 | Intron 3 | Exon 4 | Intron 4 | Exon 5 | Intron 5 | Exon 6 | Intron 6 | Exon 7 | ||||||||||||
| Length (bp) | 363 | 144 | 71–96 | 174–177 | 72–77 | 210 | 102 | 237 | 79–111 | 153 | 111–117 | 69 | |||||||||||
| Number of variable sites | |||||||||||||||||||||||
| Synonymous | 76 | 13 | — | 15 | — | 13 | — | 8 | — | 8 | — | 0 | |||||||||||
| Nonsynonymous | 100 | 27 | — | 18 | — | 1 | — | 3 | — | 1 | — | 1 | |||||||||||
| Nucleotide diversity (π) | |||||||||||||||||||||||
| Total | 0.167 | 0.090 | 0.090 | 0.071 | 0.101 | 0.024 | 0.057 | 0.019 | 0.074 | 0.024 | 0.114 | 0.006 | |||||||||||
| Synonymous sites | 0.274 | 0.109 | — | 0.109 | — | 0.092 | — | 0.063 | — | 0.092 | — | 0 | |||||||||||
| ± SE | 0.030 | 0.029 | 0.029 | 0.026 | 0.021 | 0.033 | — | ||||||||||||||||
| Nonsynonymous sites | 0.137 | 0.084 | — | 0.059 | — | 0.004 | — | 0.005 | — | 0.003 | — | 0.007 | |||||||||||
| ± SE | 0.015 | 0.017 | 0.013 | 0.004 | 0.004 | 0.003 | 0.007 | ||||||||||||||||
Note.—The sample size for exons 5 to 7 is 4. Exons 1 and 7 are incomplete. Intron 1 cannot be aligned reliably, but the other introns are alignable and diversity is shown.
| Region | |||||||||||||||||||||||
|---|---|---|---|---|---|---|---|---|---|---|---|---|---|---|---|---|---|---|---|---|---|---|---|
| Exon 1 | Exon 2 | Intron 2 | Exon 3 | Intron 3 | Exon 4 | Intron 4 | Exon 5 | Intron 5 | Exon 6 | Intron 6 | Exon 7 | ||||||||||||
| Length (bp) | 363 | 144 | 71–96 | 174–177 | 72–77 | 210 | 102 | 237 | 79–111 | 153 | 111–117 | 69 | |||||||||||
| Number of variable sites | |||||||||||||||||||||||
| Synonymous | 76 | 13 | — | 15 | — | 13 | — | 8 | — | 8 | — | 0 | |||||||||||
| Nonsynonymous | 100 | 27 | — | 18 | — | 1 | — | 3 | — | 1 | — | 1 | |||||||||||
| Nucleotide diversity (π) | |||||||||||||||||||||||
| Total | 0.167 | 0.090 | 0.090 | 0.071 | 0.101 | 0.024 | 0.057 | 0.019 | 0.074 | 0.024 | 0.114 | 0.006 | |||||||||||
| Synonymous sites | 0.274 | 0.109 | — | 0.109 | — | 0.092 | — | 0.063 | — | 0.092 | — | 0 | |||||||||||
| ± SE | 0.030 | 0.029 | 0.029 | 0.026 | 0.021 | 0.033 | — | ||||||||||||||||
| Nonsynonymous sites | 0.137 | 0.084 | — | 0.059 | — | 0.004 | — | 0.005 | — | 0.003 | — | 0.007 | |||||||||||
| ± SE | 0.015 | 0.017 | 0.013 | 0.004 | 0.004 | 0.003 | 0.007 | ||||||||||||||||
Note.—The sample size for exons 5 to 7 is 4. Exons 1 and 7 are incomplete. Intron 1 cannot be aligned reliably, but the other introns are alignable and diversity is shown.
Diversity Within Alleles Identified as Having the Same Aly13 Sequence Subtype.
| Numbers of Variable Sites, Diversity Estimate | ||||||||||||
|---|---|---|---|---|---|---|---|---|---|---|---|---|
| Aly13 Subtype | Populations Compared | Synonymous Sites | Nonsynonymous Sites | Intron Sites | Indels | π Value Within Subtype | ||||||
| Set A sequences | ||||||||||||
| 4 | Blue Lagoon, Iceland/Scotland | 0 | 0 | 0 | 0 | 0 | ||||||
| 9 | Iceland: Reykjavik/Reykjanes Peninsula | 0 | 0 | 0 | 0 | 0 | ||||||
| 12 | Iceland: Reykjanes Peninsula/Blue Lagoon | 0 | 0 | 0 | 0 | 0 | ||||||
| 22 | Scotland/Reykjanes Peninsula | 2 | 2 | 4 | 0 | 0.0018 | ||||||
| 25 | Iceland: Blue Lagoon/ Reykjanes Peninsula | 0 | 1 | 0 | 0 | 0.0003 | ||||||
| Set B sequences, linked to Aly13 | ||||||||||||
| 3 | NC x Michigana/North Carolina | 0 | 0 | 0 | 0 | 0 | ||||||
| 6 | Iceland: Lava field/ Reykjanes Peninsula | 0 | 0 | 0 | 0 | 0 | ||||||
| 14 | Iceland: Reykjanes Peninsula/Blue Lagoon | 0 | 0 | 0 | 0 | 0 | ||||||
| Set B sequences, unlinked to Aly13 | ||||||||||||
| 2 | Scotland/North Carolina | 1 | 0 | 3 | 0 | 0.0013 | ||||||
| 7 | Scotland x Reykjavik, Icelanda/Reykjanes Peninsula | 0 | 0 | 1 | 0 | 0.0002 | ||||||
Note.—The second column of the table identifies the natural populations that were the source of the alleles sequenced. A single Aly13 sequence was obtained from the first population listed, and two sequences of the same Aly13 subtype were obtained from the second population. All sequences include exons 1 to 7, as described in the text, except for subtype 14, for which the sequences end in exon 5.
a In a few cases, the allele was sequenced from a plant that was derived from crossing two populations, so the source of the allele is uncertain.
Results Of Linkage Disequilibrium Analyses.
| Domains Included | Results and Significance | |||||
|---|---|---|---|---|---|---|
| Sequences Included | S | Kinase | Number of Sequences | Number of Sites Included | R2 | D′ |
| All sequences | Yes | Yes | 18 | 331 | −0.22*** | −0.14*** |
| All linked sequences | Yes | Yes | 16 | 322 | −0.18*** | −0.11*** |
| All set A | Yes | Yes | 12 | 278 | −0.03** | −0.03*** |
| All set B | Yes | Yes | 6 | 56 | −0.22*** | −0.16*** |
| All sequences | No | Yes | 18 | 152 | 0.01 | 0.04 |
| All linked sequences | No | Yes | 16 | 130 | −0.19* | −0.04 |
| All set A | No | Yes | 12 | 120 | −0.03 | 0.02 |
| All set B | No | Yes | 6 | 14 | 0.09 | −0.12 |
| All sequences | Yes | No | 18 | 102 | 0.00 | −0.02 |
| All linked sequences | Yes | No | 16 | 118 | −0.01 | −0.01 |
| All set A | Yes | No | 12 | 117 | 0.00 | 0.01 |
| All set B | Yes | No | 6 | 48 | −0.1 | 0.01 |
Note.—Correlation coefficient of linkage disequilibrium with distance between polymorphic sites for the four data sets. Data set A: all sequences; data set B: all linked sequences; data set C: all class A sequences; data set D: all class B sequences. Significance levels are indicated as follows: *** P < 0.001, ** P < 0.01, * P < 0.05.
Average Linkage Disequilibrium Values for Sites Within the S-Domain, Within the Kinase Domain, and Between the Two Domains.
| R2 Measure | D′ Measure | |||||
|---|---|---|---|---|---|---|
| Data Set | Within S-Domain | Within Kinase Domain | Between Domains | Within S-Domain | Within Kinase Domain | Between Domains |
| All sequences | 0.15 | 0.31 | 0.16 | 0.5 | 0.7 | 0.55 |
| All linked sequences | 0.16 | 0.28 | 0.20 | 0.55 | 0.71 | 0.61 |
| All set A | 0.13 | 0.15 | 0.13 | 0.46 | 0.5 | 0.47 |
| All set B | 0.49 | 0.56 | 0.32 | 0.84 | 0.85 | 0.7 |
This work was supported by the Biotechnology and Biological Sciences Research Council of the UK. B.K.M. was also supported by the Natural Sciences and Engineering Council of Canada, D.C. by the Natural Environment Research Council of Great Britain and Edinburgh University, and M.H.S. by the Danish Natural Sciences Research Council (grant no. 00001262). We thank the staff at the University of Edinburgh for growing the plants and the following people for seeds used in this work: T. E. Thorhallsdottir, C. H. Langley, and R. Mauricio.
Literature Cited
Andolfatto, P., and M. Nordborg.
Angers, B., K. Gharbi, and A. Estoup.
Araki, H., N. Inomata, and T. Yamazaki.
Awadalla, P., and D. Charlesworth.
Bergström, T. F., A. Josefsson, H. Erlich, and U. Gyllensten.
Buckler, E. S., A. Ippolito, and T. P. Holtsford.
Charlesworth, B., M. Nordborg, and D. Charlesworth.
Charlesworth, D., B. K. Mable, M. H. Schierup, C. Bartolomé, and P. Awadallala.
Drouin, G.
Drouin, G., F. Prat, M. Ell, and G. D. Clarke.
Frey, B., and B. Suppmann.
Hinata, K., M. Watanabe, S. Yamakawa, Y. Satta, and A. Isogai.
Hudson, R. R., and N.L. Kaplan.
Innan, H., and M. Nordborg.
Jeanmougin, F., J. D. Thompson, M. Gouy, D. G. Higgins, and T. J. Gibson.
Jensen, M. A., B. Charlesworth, and M. Kreitman.
Kumar, S., K. Tamura, I. Jacobsen, and M. Nei.
Kusaba, M., K. Dwyer, J. Hendershot, J. Vrebalov, J. B. Nasrallah, and M. E. Nasrallah.
Kusaba, M., M. Matsushita, K. Okazaki, Y. Satta, and T. Nishio.
Kusaba, M., T. Nishio, Y. Satta, K. Hinata, and D. Ockendon.
Langley, C. H., B. P. Lazzaro, W. Phillips, E. Heikkinen, and J. M. Braverman.
Lawrence, M. J., M. D. Lane, S. O'Donnell, and V. E. Franklin-Tong.
Mable, B. K., M. H. Schierup, and D. Charlesworth.
Martinsohn, J. T., A. B. Sousa, L. A. Guethlein, and J. C. Howard.
May, G., F. Shaw, H. Badrane, and X. Vekemans.
McVean, G. A. T.
McVean, G. A. T., P. Awadalla, and P. Fearnhead.
Miege, C., V. Ruffio-Chable, M. H. Schierup, D. Cabrillac, T. Gaude, and J. M. Cock.
Moniz de Sá M., and G. Drouin.
Nasrallah, J.B.
Navarro, A., and N. H. Barton.
Nei, M., and T. Gojobori.
Nishio, T., M. Kusaba, K. Sakamoto, and D. Ockendon.
Nordborg, M., B. Charlesworth, and D. Charlesworth.
Nordborg, M., and H. Innan.
Pannell, J. R., and B. Charlesworth.
Sato, T., T. Nishio, R. Kimura, M. Kusaba, G. Suzuki, K. Hatakeyama, D. Ockendon, and Y. Satta.
Schierup, M. H., B. K. Mable, P. Awadalla, and D. Charlesworth.
Schierup, M. H., A. M. Mikkelsen, and J. Hein.
Schierup, M. H., X. Vekemans, and D. Charlesworth.
Schopfer, C. R., M. E. Nasrallah, and J. B. Nasrallah.
Shiba, H., M. Iwano, and T. Entani, et al. (11 co-authors).
Strobeck, C.
Sun, Q., N. C. Collins, M. Ayliffe, S. M. Smith, J. Drake, T. Pryor, and S. H. Hulbert.
Suzuki, G., N. Kai, T. Hirose, K. Fukui, T. Nishio, S. Takayama, A. Isogai, M. Watanabe, and K. Hinata.
Tajima, F.
Takahata, N., and Y. Satta.
Uyenoyama, M. K.
Vekemans, X., and M. Slatkin.
Wade, M. J., and D. E. McCauley.
Wang, S. J., C. Magoulas, and D. Hickey.
