-
PDF
- Split View
-
Views
-
Cite
Cite
Anne D. Yoder, Ziheng Yang, Estimation of Primate Speciation Dates Using Local Molecular Clocks, Molecular Biology and Evolution, Volume 17, Issue 7, July 2000, Pages 1081–1090, https://doi.org/10.1093/oxfordjournals.molbev.a026389
Close - Share Icon Share
Abstract
Protein-coding genes of the mitochondrial genomes from 31 mammalian species were analyzed to estimate the speciation dates within primates and also between rats and mice. Three calibration points were used based on paleontological data: one at 20–25 MYA for the hominoid/cercopithecoid divergence, one at 53–57 MYA for the cetacean/artiodactyl divergence, and the third at 110–130 MYA for the metatherian/eutherian divergence. Both the nucleotide and the amino acid sequences were analyzed, producing conflicting results. The global molecular clock was clearly violated for both the nucleotide and the amino acid data. Models of local clocks were implemented using maximum likelihood, allowing different evolutionary rates for some lineages while assuming rate constancy in others. Surprisingly, the highly divergent third codon positions appeared to contain phylogenetic information and produced more sensible estimates of primate divergence dates than did the amino acid sequences. Estimated dates varied considerably depending on the data type, the calibration point, and the substitution model but differed little among the four tree topologies used. We conclude that the calibration derived from the primate fossil record is too recent to be reliable; we also point out a number of problems in date estimation when the molecular clock does not hold. Despite these obstacles, we derived estimates of primate divergence dates that were well supported by the data and were generally consistent with the paleontological record. Estimation of the mouse-rat divergence date, however, was problematic.
Introduction
Evolutionary biologists are interested in determining the age of speciation events. Aside from the intrinsic fascination for knowing the antiquity of a given species or clade, accurate date estimation is important for advancing evolutionary theory. By calculating the temporal setting for a given divergence event, one can determine the geological and environmental context for that event and consequently gain a better understanding of speciation and dispersal mechanisms. Genetic data are commonly used for these purposes (Bermingham et al. 1992 ; Da Silva and Patton 1993 ; Patton, da Silva, and Malcolm 1994 ; Horai et al. 1995 ; Hedges et al. 1996 ; Rassmann 1997 ; Avise, Walker, and Johns 1998 ; Bermingham and Moritz 1998 ; Cooper and Fortey 1998 ; Voelker 1999 ). Unfortunately, the results of such studies are often controversial due to their disagreement with the fossil record and/or with each other.
A number of factors may account for such disagreements. For the most part, the arguments have focused on perceived flaws in the fossil record. Some geneticists have dismissed the discrepancies between their studies and the fossil record by claiming that the latter is simply too incomplete to be reliable (Easteal, Collet, and Betty 1995 ; Hedges et al. 1996 ; Kumar and Hedges 1998 ). Paleontologists have been quick to respond with evidence to the contrary (Alroy 1999 ; Foote et al. 1999 ). Others have pointed out that by their very nature, genetic and fossil data are destined to give different estimates of organismal ages, because fossil morphological data can only identify crown clades, while genetic data can only identify the earliest stages of divergence, long before clade-defining morphological synapomorphies were established (Archibald 1999 ). It is therefore argued that genetic estimates of clade age will always be older than those identified via the fossil record. Molecular evolutionary issues are also important. For example, selective constraints, genetic repair mechanisms, and effective population sizes will affect the relative utility and accuracy of a given genetic marker. Thus, it should not be surprising that nucleotide data may give age estimates different from those of amino acid data, just as a mitochondrial gene may give a different estimate than a nuclear gene.
Finally, the role of statistical analysis should not be underestimated. Increasingly sophisticated models are being applied to reconstruction of molecular phylogenies, and model assumptions appear even more important for date estimation. Simple unrealistic models do not correct for multiple hits properly and cause biased estimates of speciation dates (Yang 1996a ). Most important with regard to date estimation is the assumption of the molecular clock, that is, rate constancy among lineages; incorrectly assuming the clock may lead to spurious date estimates (Takezaki, Rzhetsky, and Nei 1995 ). Recent work has suggested the possibility of estimating dates without assuming a global molecular clock (Sanderson 1997 ; Rambaut and Bromham 1998 ; Thorne, Kishino, and Painter 1998 ; Huelsenbeck, Larget, and Swofford 2000 ). However, the utility and limitations of such methods are not yet well understood.
We implemented maximum-likelihood (ML) models of local molecular clocks and applied them to protein-coding genes in the mitochondrial genome from 31 mammalian species. The effects of calibration date, data type, and statistical model on estimation of speciation dates were explored. We examined these effects on the recovery of divergence dates within anthropoid primates and between two murine rodents, the mouse and the rat. Both groups have received much attention in the literature, the anthropoid primates due primarily to our inherent interest in human evolution, and the rodents due primarily to the large discrepancies between paleontological and genetic estimates of their antiquity. A recent study of primate divergence dates (Arnason, Gullberg, and Janke 1998 ) explored the effect of fossil dates outside the primate clade for tree calibration. The authors argued that the chosen calibrations (between ceteceans and artiodactyls and between equids and rhinocerids) were based on more complete fossil records than were any of the fossil calibrations typically employed within the primate clade. That study estimated primate divergence dates to be much earlier than had previously been determined by genetic studies. On the other hand, genetic studies that have addressed the issue of murine rodent antiquity (O'hUigin and Li 1992 ; Frye and Hedges 1995 ; Kumar and Hedges 1998 ) have repeatedly found the Mus/Rattus divergence to be far older than the 12–14 MYA date indicated by the fossil record (Jacobs and Downs 1994 ). One likely explanation for the discrepancy is that rodents tend to show higher rates of molecular evolution than do other mammals, including primates (Wu and Li 1985 ; Robinson et al. 1997 ). By applying statistical methods that allow for variable evolutionary rates among mammalian lineages, we hope to address some of the complications that have handicapped previous studies.
Materials and Methods
Alignment
Complete mtDNA sequences for 31 mammalian species were retrieved from GenBank (table 1 ). The 12 protein-coding genes on the H-strand of the mitochondrial genome were concatenated according to their relative positions (fig. 1 ). There are several regions in which one gene overlaps another, using differing reading frames. In such cases, overlapping sequence of the 3′ end of the 5′ gene was removed. Additional bases of the downstream gene were removed in order to preserve the codon structure of that gene (e.g., in the case of the 7-bp overlap between NADH4L and NADH4, 9 bp were removed from NADH4L). The NADH6 gene was not used, as it is coded by the other strand of the mitochondrial genome and has very different codon usage and substitution patterns. Start and stop codons were removed. Sequences are aligned manually at the amino acid level, aided by probabilities of changes between amino acids estimated previously (Yang, Nielsen, and Hasegawa 1998 ). The aligned sequence has 10,806 nt (3,602 amino acids). The alignment is available from the authors.
Phylogenetic Reconstruction and Calculation of Bootstrap Support
Complete-genome mtDNA data have been analyzed extensively for phylogeny reconstruction and are known to produce unorthodox phylogenies for vertebrates (e.g., Cao et al. 1998 ; Takezaki and Gojobori 1999 ). We did not attempt to resolve the phylogeny with certainty, but collected four candidate tree topologies for date estimation. We used the PROTML and NUCML programs in the MOLPHY package (Adachi and Hasegawa 1996b ) to perform heuristic tree searches. The HKY85 model (Hasegawa, Kishino, and Yano 1985 ) was used for nucleotide sequences, and the mtREV24 model was used for amino acid sequences (Adachi and Hasegawa 1996a ). Further comparisons among candidate trees were performed using the BASEML and CODEML programs in the PAML package to account for variable rates among sites (Yang 1999 ). Nucleotide data were analyzed in two ways, one using the third codon positions only and another using data at all three positions, with different substitution rates, transition/transversion rate ratios (κ), and base frequencies among codon positions assumed (Yang 1996b ).
Tree topologies were compared with the RELL approximation to the bootstrap (Felsenstein 1985 ; Kishino and Hasegawa 1989 ). For models accounting for heterogeneity among codon positions, data from different positions do not follow the same distribution. As pointed out by H. Shimodaira (personal communication), bootstrap replicates for such partitioned data are constructed by stratified sampling. That is, each replicate consists of the same number of sites as in the original data set for each codon position, obtained by sampling with replacement. The calculation was done with the BASEML program. It is noted that this approach produced results very similar to those produced by sampling ignoring the data partitions when each partition contained many sites.
Calibration Points
Lee (1999) stressed the importance of critically assessing the reliability of fossil calibration points. In this paper, we use three calibration points: one based on the primate fossil record and two taken from outside of the primates. A range of dates was explored for each to reflect the uncertainty concerning fossil identities. The first calibration assumed a range of 20–25 MYA for the hominoid/cercopithecoid divergence (C1 in the trees of fig. 2 ), the second assumed a range of 53–57 MYA for the cetacean/artiodactyl divergence (C2), and the third assumed a range of 110–130 MYA for the metatherian/eutherian divergence (C3). The C1 calibration was based on the estimated ages of the three earliest putative cercopithecoid and hominoid fossils. Victoriapithecus and Prohylobates, both of which are considered to be early cercopithecoids prior to the divergence of the colobine and cercopithecine lineages, have been dated to approximately 18–20 MYA (Benefit 1993 ). Kamoyapithecus, the earliest known hominoid, has been dated to 25 MYA (Leakey, Ungar, and Walker 1995 ). The C1 paleontological estimate of catarrhine antiquity is thus considerably younger than the >50 MYA estimated by Arnason, Gullberg, and Janke (1998) . The C2 calibration is based primarily on paleontological estimates for the antiquity of Cetacea (Bajpai and Gingerich 1998 ; Thewissen and Hussain 1998 ). Arnason, Gullberg, and Janke (1998) similarly used the cetacean/artiodactyl divergence as a calibration for their genetic analysis, although they employed a slightly earlier date of 60 MYA. The range of dates assumed for the C3 calibration was based on paleontological estimates of the antiquity of the metatherian and eutherian lineages. Deltatheridium, a basal metatherian, is known from the late Cretaceous of Mongolia (Rougier, Wible, and Novacek 1998 ), and Prokennalestes, a basal eutherian, is known from the early Cretaceous, also of Mongolia (Kielan-Jaworowska and Dashzeveg 1989 ).
Models of Local Molecular Clocks
Current phylogenetic packages (such as PAUP, PHYLIP, and PAML) implement two extreme models concerning substitution rates among lineages. One is the global clock, assuming the same rate for all lineages. The other assumes free rates, that is, one independent rate for each branch. Models of local molecular clocks lie between these two extremes and assume that some branches (e.g., those for a closely related group of species) have the same rate, while different parts of the tree may have different rates. Such models are implemented in the PAML package. In the following, we describe the implementation of the global clock first, and then the implementation of local molecular clocks.
The natural parameters for the model of a global molecular clock are the node ages (e.g., t1, t2, t3, and t4 in fig. 3 ), measured as the expected number of substitutions per site from the node to the present time. A rooted tree of n species has n − 1 interior nodes, so there are n − 1 parameters in the model. Maximum-likelihood estimation of node ages requires numerical optimization under inequality constraints, such as t4 ≤ t2 ≤ t1 and t3 ≤ t1. Algorithms currently used in PAML deal with simple bounds on parameters but not general inequality constraints, so we redefined the parameters to facilitate the iteration, according to a suggestion by Jeff Thorne. We used the age of the root as the first parameter. With other node ages, we used the ratio of the age of a node to the age of its immediate ancestor. In the example tree of figure 3 , the new parameters are thus x1 = t1, x2 = t2/t1, x3 = t3/t1, and x4 = t4/t2. As a result of this transform, only simple bounds are involved (that is, 0 ≤ x1 < ∞, 0 ≤ xi ≤ 1 for i = 2, 3, 4).
In a model of local molecular clock, we assume that each branch in the phylogeny can take one of k possible rates. We let r0 = 1 be the default rate and simply use k − 1 rate multiplication factors as additional parameters. The model then has n − k − 2 parameters. When k = 1, all branches have the same rate, and the model reduces to the global clock. Note that the number of branches in an unrooted tree topology is 2n − 3, so that n + k − 2 should not exceed 2n − 3. Furthermore, certain specifications of rates for branches may make it impossible to identify all parameters in the model, and such identifiability problems have to be avoided (see Results and Discussion).
Results and Discussion
Collection of Candidate Phylogenies
We employed two data sets for generating phylogenetic trees: one of amino acid sequences derived from the aligned nucleotide sequences and another of nucleotide sequences composed of third codon positions only. The MOLPHY package was used for a quick search, followed by a proper likelihood evaluation of the top 50 trees in each data set. Substitution rates were assumed to be free to vary among branches in those analyses; that is, no clock was assumed. Two trees were selected from each data set: the maximum-likelihood tree and another tree that appeared most consistent with morphological hypotheses of mammalian relationships (Miyamoto 1996 ; Shoshani and McKenna 1998 ; Liu and Miyamoto 1999 ). The four trees from the two data sets were employed for date estimation (fig. 2 ).
A number of results are universal to all trees found in the quick search: (1) primates are monophyletic, with interrelationships among them stable (as illustrated in fig. 2 ); (2) carnivores, artiodactyls, cetaceans, and perissodactyls form a clade (the Ferungulata); (3) cetaceans nest within the artiodactyls, with the pig as the basal taxon; (4) opossum and wallaroo form a clade (Metatheria) that is basal to the Eutheria. Our study did not address the issue of a Marsupionta clade, as platypus was designated a priori as the outgroup. Inconsistencies among the trees found in the quick search included the placement of the rabbit, the hedgehog, and the fruit bat, which was highly variable, although there was a general tendency for the hedgehog to be basal within the Eutheria and for the fruit bat to be sister to the ferungulates (as is shown in all four trees in fig. 2 ). The placement of the perissodactyls relative to the carnivores and the artiodactyls varied, as did the monophyly of the rodents. The majority of trees did not recover rodent monophyly.
We note that the amino acid data and the third-position nucleotide data gave conflicting support for the phylogeny. The RELL bootstrap proportions are listed for the four trees in figure 2 when only those four trees are compared. The nucleotide data at the third codon positions favored tree 1, while the amino acid sequences, as well as the combined data of all three codon positions, favored tree 3. Notably, the results obtained from the analysis of third codon positions were as reliable as those obtained from the amino acid sequences, despite the very large estimates of tree length for the third position (about 50 or 150 substitutions per site on the tree under the one-rate and gamma-rates models, respectively). This result contradicts the widespread view that rapidly evolving sites should be omitted or downweighted in phylogenetic analysis (e.g., Waddell et al. 1999 ; Springer et al. 1999 ) and is more consistent with observations that these sites can contain phylogenetic signal (Yoder, Vilgalys, and Ruvolo 1996 ; Yang 1998 ). While the nucleotide data at the third positions and amino acid data gave inconsistent results, the conflicts between the molecular data and the morphological evidence were even greater, as trees 2 and 4 received little statistical support from either the nucleotide data set or the amino acid data set.
Date Estimation
Three data sets (inferred amino acid sequences, complete nucleotide sequences, and third codon positions), four tree topologies (fig. 2 ), three calibration points (C1, C2, and C3), and a variety of statistical models were employed to estimate divergence dates within the primates and between the mouse and the rat. The estimates are given in tables 2–4 . The assumption of a global molecular clock is easily rejected for any data type or tree topology. For example, the likelihood ratio statistic comparing models with and without the clock assumption is 2Δℓ = 751.9 for the amino acid sequence data and tree 1; this is much greater than the χ2 critical value of 49.6 with df = 29. Branch lengths estimated from amino acid sequences without the clock assumption are shown in the trees of figure 2 , where violation of the clock is obvious. Branch lengths estimated using nucleotide data showed similar patterns and are thus not shown.
The effect of tree topology on date estimation was small in all tests. For example, under the global-clock model and using third-position nucleotide sequences, the C1 calibration at 25 MYA gave estimates of the human-chimpanzee separation in the range 4.1–4.2 MYA among the four trees. With the C2 calibration at 57 MYA, the estimates ranged from 6.3 to 6.7, and with the C3 calibration at 130 MYA, the estimates ranged from 6.2 to 7.0 MYA. Estimates for other divergences were also similar among trees. The patterns were also similar in analysis of amino acid sequences. The uncertainty in the phylogenetic relationship appears to have had little effect on estimation of the primate dates, especially in comparison with other factors considered below. We thus present results for the tree of figure 2A only.
Substitution rates were highly variable among sites in the amino acid sequences, with the gamma shape parameter α estimated at 0.41 for all trees and models (Yang 1996a ). Even the third-position nucleotide sequences showed considerable rate variation, with α estimated at 0.80. In general, accounting for variable evolutionary rates among sites makes shallow nodes (e.g., human/chimpanzee divergence) more recent and deep nodes (e.g., cercopithecoid/hominoid) older. This is because ignoring the rate variation leads to underestimated distances, with the bias being more serious for large distances than for small distances (Yang 1996a ). Among-site rate variation has substantial effects, especially on estimation of recent divergence dates (tables 2–4 ).
Several local-clock models were implemented to account for variable rates among lineages, with the aid of branch length estimates obtained without the clock assumption (see fig. 2 for estimates obtained from the amino acid sequences). The non-eutherian outgroups had much lower rates, and independent rates were assigned to those lineages. In effect, the marsupial species root the tree but do not appear to affect date estimation in primates. While the local-clock models did not seem to matter much when the primate calibration point C1 was used, probably due to the relative rate homogeneity within primates, the global and local clock models produced very different estimates when calibration points outside the primates (C2 and C3) were used. Take, for example, the gamma model analyses of the amino acid sequences in table 2 . The global clock gave 15.4–14.3 MYA for the human-chimpanzee divergence under calibration point C2, while local-clock model 1 gave dates of almost half that, at 8.4–7.8 MYA, much closer to dates expected from conventional wisdom. Similar patterns are seen in the analysis of the nucleotide data of all three codon positions. The different local-clock models most often produced similar results, presumably because local-clock model 1 accounts for most of the rate variation in the data, and other models, all more complex than model 1, were not very different from local-clock model 1 (see note to table 2 ). Date estimates obtained using a few other local-clock models we implemented were also similar to those obtained under local-clock model 1 and are thus not presented.
The most important factor affecting date estimation is the calibration point. For all three data sets analyzed (tables 2–4 ), dates estimated from the C1 calibration were considerably more recent than those estimated using the C2 and C3 calibrations, usually unrealistically so. The unrealistic nature of the C1 calibration is most forcibly demonstrated by comparing reciprocal calibrations. In all cases where the C1 calibration was used to estimate dates for the C2 and C3 nodes, the estimates were unequivocally too recent and thus falsified by the fossil record. This was particularly true for the C2 divergence, as the cetacean fossil record is so thoroughly understood (Bajpai and Gingerich 1998 ; Thewissen and Hussain 1998 ). For example, among all of the data-model combinations, the C2 dates estimated using the C1 calibration range from only 15 MYA (table 2 : global clock without gamma for the amino acid data) to a maximum of 38 MYA (table 3 : global clock with gamma for the third-position data). Even this maximum is at least 15 Myr too recent when judged against the cetacean fossil record (Bajpai and Gingerich 1998 ). These results therefore bolster the argument of Arnason, Gullberg, and Janke (1998) that primate fossil calibrations tend to be too recent. Arnason, Gullberg, and Janke (1998) , however, determined the divergence between humans and chimpanzees to be 10–13 MYA, that between gorilla and the human/chimpanzee clade to be approximately 17 MYA, and that between hominoids and cercopithecoids to be >50 MYA. Our study found primate divergence dates of this antiquity only by analyzing the amino acid data (table 2 ) or the complete nucleotide data (table 4 ) with the assumption of a global molecular clock, an assumption that is clearly violated.
The above discussion leaves open the question of whether this study has accurately estimated primate divergence dates. At this point, we can at least rule out a subset of the results as inaccurate. Clearly, the global-clock assumption for the amino acid and complete nucleotide sequences is invalid, as are all dates estimated via the C1 calibration. This leaves us with dates estimated via the local-clock models for the amino acid and complete nucleotide sequence data, as well as dates from the third-position sites. We examine these results in turn. For the amino acid data (table 2 ), the local-clock estimates for primate divergences are more compatible with conventional wisdom than are the global-clock estimates, but there are some troubling inconsistencies when the C2 and C3 reciprocal calibrations are compared. For example, in one analysis, the C2 prediction of C1 is as old as 60 MYA, whereas the C3 prediction is as recent as 36 MYA. These results raise doubts as to the reliability of the amino acid data, the appropriateness of the C2 and C3 calibrations, or both. Examination of the third-position data (table 3 ) and complete nucleotide data (table 4 ) suggest that the discrepancy is due less to inconsistencies between the fossil calibrations than to intrinsic properties of the amino acid data. Estimates of primate divergence dates using calibrations C2 and C3 are remarkably consistent under the local-clock model for the complete nucleotide sequences and under both global- and local-clock models for the third-position data. In the six analyses, divergence dates range from approximately 4–6 MYA for humans and chimpanzees, 7–9 MYA between gorillas and the human/chimpanzee clade, and 30–40 MYA between hominoids and cercopithecoids. We propose that these dates are those best supported by the data, given appropriate statistical analysis and proper fossil calibration. Moreover, these dates are generally compatible with the known primate fossil record (Benefit 1993 ; Leakey, Ungar, and Walker 1995 ; Ward et al. 1999 ) or recent molecular studies (Martin 1993 ; Takahata and Satta 1997 ).
Estimates of the mouse-rat divergence date do not present such a convergence of genetic and paleontological data. On the contrary, the six analyses that we deemed to be most reliable for the primate data yielded dates that were far too ancient to be realistic for the rodents. On the other hand, those analyses that we dismissed as irrelevant for estimating primate divergence dates tended to give more recent and, thus, more plausible estimates for the mouse-rate divergence. This suggests that there must be molecular-evolutionary properties of the rodent sequences that differ markedly from those of the primate sequences. Given that the discrepancies are most remarkable in the comparison of the amino acid data and the third-position data, we postulate that the two clades may have experienced different selection constraints and have different substitution rates that are not accounted for by our statistical models. The inclusion of only two rodent species in the data also appears to create problems in identifying rate changes within and immediately ancestral to the two rodent lineages (see below).
Difficulties of Date Estimation Without a Molecular Clock
The first application of local molecular-clock models to date estimation appears to be that of Kishino and Hasegawa (1990) , who estimated dates within hominoids using models of variable transition and transversion rates along lineages. The authors used a multivariate normal distribution to approximate the observed numbers of transitional and transversional differences between each pair of sequences. Rambaut and Bromham (1998) discussed a maximum-likelihood model with two rates on a tree of four species (quartets). The likelihood models implemented here are similar to those of previous studies. It should be pointed out that several problems are shared by those methods. The first is that the likelihood ratio test of hypotheses concerning rates among lineages is valid only if the null hypothesis is specified beforehand. This may be the case when there are extrinsic reasons to assign rates to branches. For example, two groups of species may be expected to have different evolutionary rates. However, if the hypothesis about rates is derived from the sequence data and tested using the same data, the significance values suggested by the χ2 distribution will not be reliable, with too high a probability of incorrectly finding a difference. In this regard, the Bayes approach (Thorne, Kishino, and Painter 1998 ; Huelsenbeck, Larget, and Swofford 2000 ) may have advantages, as it does not require prior specification of rates for branches. This problem should be borne in mind if a likelihood ratio test is used to compare local-clock models implemented in this paper. For date estimation, this does not pose a serious concern, as incorrectly rejecting a hypothesis of equal rates and thus using additional rate parameters in the model may not be expected to lead to biased date estimates.
A serious problem attendant upon any attempt to estimate dates without a global clock is the well-known confounding effect between date and rate in molecular data. The likelihood of the tree/model depends solely on the branch lengths in the unrooted tree. As a result, global- and local-clock models that generate identical branch lengths in the unrooted tree are indistinguishable by the data. For example, the tree in figure 4A conforms to a global clock, while the tree in figure 4B has two rates for branches on the two sides of the root. Both trees give the same branch lengths in the unrooted tree (fig. 4C ) and will have exactly the same likelihood. Either one can be the correct tree with the other being the estimate, or neither may be correct. If tree B is true, in which case the global clock is violated, a test of the molecular clock will not detect the rate difference; by sliding the root along the branch of the unrooted tree, the tree becomes clocklike (tree A). Date estimation in such cases will be grossly misleading. For example, the root is 100% older than the node ancestral to species 1 and 2 in tree A, but the root is only 33% older in tree B. Arbitrary date estimates can be obtained by assuming different relative rates on the two sides of the root. A similar problem exists when an independent rate is assigned to one of the two branches around the root. The problem is particularly acute when only four species are analyzed and exists in Bayes methods allowing for variable evolutionary rates among lineages (Thorne, Kishino, and Painter 1998 ; Huelsenbeck, Larget, and Swofford 2000 ). It is possible that estimation of the mouse-rat divergence date in this study suffers from this problem. If the two rodent lineages have accelerated rates in the recent past, the data will be compatible with much more recent divergence dates for the two species than those in tables 2–4 . In this regard, increased sampling of species may allow reliable estimation of within-group rates.
Naruya Saitou, Reviewing Editor
Keywords: local molecular clock maximum likelihood mitochondrial DNA molecular clock primates mammals speciation dates
Address for correspondence and reprints: Anne D. Yoder, Department of Cell and Molecular Biology, 303 East Chicago Avenue, Chicago, Illinois 60611. E-mail: [email protected].
Table 1 Sources of Complete mtDNA Sequences
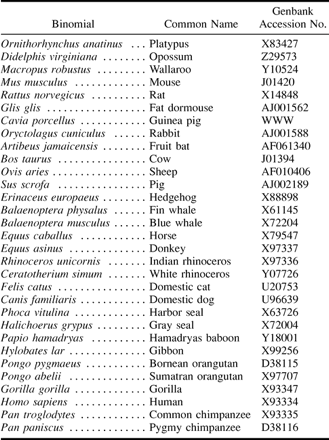
Table 1 Sources of Complete mtDNA Sequences

Table 2 Estimation of Dates from Amino Acid Sequences (in Myr)
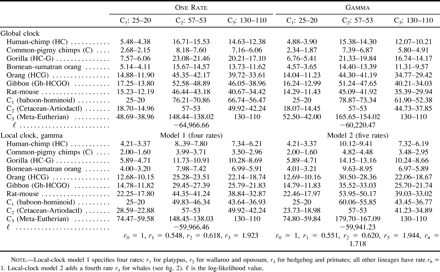
Table 2 Estimation of Dates from Amino Acid Sequences (in Myr)

Table 3 Estimation of Dates from Third Codon Positions
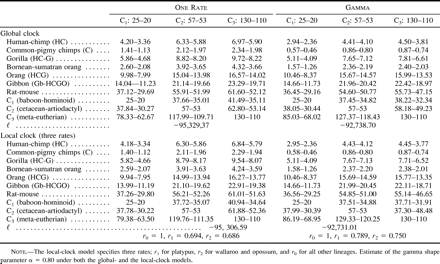
Table 3 Estimation of Dates from Third Codon Positions

Table 4 Date Estimation from All Three Codon Positions
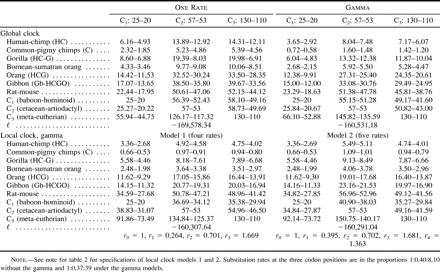
Table 4 Date Estimation from All Three Codon Positions

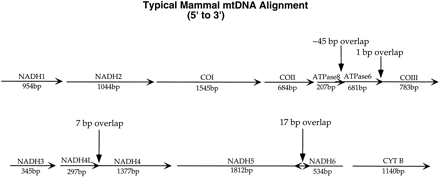
Fig. 1.—Alignment map showing locations of the genes in the mammalian mitochondrial genome.
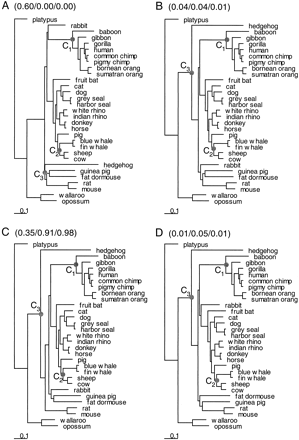
Fig. 2.—Four phylogenies used for calculating speciation dates. Trees A and B were obtained from heuristic tree searches using third-position nucleotide data with tree A being the ML tree and tree B being most consistent with morphological data. Trees C and D were obtained from heuristic tree searches using amino acid data, with tree C being the ML tree and tree D being most consistent with morphological data. Numbers in parentheses, in the format “(3rd/a.a./all),” are the RELL bootstrap proportions calculated using third-position nucleotide sequences, amino acid sequences, and complete nucleotide sequences, respectively. The three calibration points (C1, C2, and C3) are indicated on the trees. The branch lengths are estimated from the amino acid sequences under the mtREV24 model (Adachi and Hasegawa 1996a ) with gamma rates among sites (Yang 1993, 1994 )
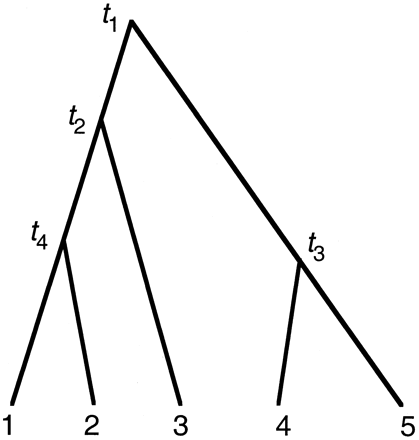
Fig. 3.—An example tree to explain PAML implementation of models of local molecular clocks

Fig. 4.—Three trees indistinguishable by molecular data, illustrating the identifiability problem when the molecular clock does not hold. Numbers beside nodes in A and B are node ages, proportional to the number of substitutions per site from that node to the present time. In tree A, a global clock holds, and all branches have the same rate (1). In tree B, branches on the left side of the tree have the same rate (1) as in tree A, while those on the right side have a rate twice as high. Both trees give the same branch lengths in the unrooted tree (C)
We are grateful to Chris Beard, Marian Dagosto, and Hans Thewissen for sharing their expert knowledge of the mammalian fossil record. Z.Y. thanks Nick Goldman and Bruce Rannala for discussions on models of local molecular clocks and Hidetoshi Shimodaira for discussions on bootstrap resampling of partitioned data. Ulfur Arnason and Axel Janke kindly allowed us to use their mtDNA alignment for purposes of comparison. We thank Axel Janke and two anonymous referees for comments. This study was supported by BBSRC grants 31/MMI09806 and 31/G10434 to Z.Y., and by NSF grant BCS-9905614 to A.D.Y.
literature cited
Adachi, J., and M. Hasegawa. 1996a. Model of amino acid substitution in proteins encoded by mitochondrial DNA. J. Mol. Evol. 42:459–468.
———. 1996b. MOLPHY version 2.3: programs for molecular phylogenetics based on maximum likelihood. Comput. Sci. Monogr. 28:1–150.
Alroy, J.
Arnason, U., A. Gullberg, and A. Janke.
Avise, J. C., D. Walker, and G. C. Johns.
Bajpai, S., and P. D. Gingerich.
Benefit, B. R.
Bermingham, E., and C. Moritz.
Bermingham, E., S. Rohwer, S. Freeman, and C. Wood.
Cao, Y., A. Janke, P. J. Waddell, M. Westerman, O. Takenaka, S. Murata, N. Okada, S. Paabo, and M. Hasegawa.
Cooper, A., and R. Fortey.
Da Silva, M. N. F., and J. L. Patton.
Easteal, S., C. Collet, and D. Betty.
Felsenstein, J.
Foote, M., J. P. Hunter, C. M. Janis, and J. J. Sepkoski.
Frye, M. S., and S. B. Hedges.
Hasegawa, M., H. Kishino, and T. Yano.
Hedges, S. B., P. H. Parker, C. G. Sibley, and S. Kumar.
Horai, S., K. Hayasaka, R. Kondo, K. Tsugane, and N. Takahata.
Huelsenbeck, J. P., B. Larget, and D. Swofford.
Jacobs, L. L., and W. R. Downs.
Kielan-Jaworowska, Z., and D. Dashzeveg.
Kishino, H., and M. Hasegawa.
———.
Kumar, S., and S. B. Hedges.
Leakey, M. G., P. S. Ungar, and A. Walker.
Lee, M. S. Y.
Liu, F.-G. R., and M. M. Miyamoto.
Miyamoto, M. M.
O'hUigin, C., and W.-H. Li.
Patton, J. L., M. N. F. da Silva, and J. R. Malcolm.
Rambaut, A., and L. Bromham.
Rassmann, K.
Robinson, M., F. Catzeflis, J. Briolay, and D. Mouchiroud.
Rougier, G. W., J. R. Wible, and M. J. Novacek.
Sanderson, M. J.
Shoshani, J., and M. C. McKenna.
Springer, M. S., H. M. Amrine, A. Burk, and M. J. Stanhope.
Takahata, N., and Y. Satta.
Takezaki, N., and T. Gojobori.
Takezaki, N., A. Rzhetsky, and M. Nei.
Thewissen, J. G. M., and S. T. Hussain.
Thorne, J. L., H. Kishino, and I. S. Painter.
Voelker, G.
Waddell, P. J., Y. Cao, J. Hauf, and M. Hasegawa.
Ward, S., B. Brown, A. Hill, J. Kelley, and W. Downs.
Wu, C.-I., and W.-H. Li.
Yang, Z.
———.
———. 1996b. Maximum-likelihood models for combined analyses of multiple sequence data. J. Mol. Evol. 42:587–596.
———.
Yang, Z., R. Nielsen, and M. Hasegawa.


