


Abstract
We consider identification and inference about mean functionals of observed covariates and an outcome variable subject to non-ignorable missingness. By leveraging a shadow variable, we establish a necessary and sufficient condition for identification of the mean functional even if the full data distribution is not identified. We further characterize a necessary condition for -estimability of the mean functional. This condition naturally strengthens the identifying condition, and it requires the existence of a function as a solution to a representer equation that connects the shadow variable to the mean functional. Solutions to the representer equation may not be unique, which presents substantial challenges for non-parametric estimation, and standard theories for non-parametric sieve estimators are not applicable here. We construct a consistent estimator of the solution set and then adapt the theory of extremum estimators to find from the estimated set a consistent estimator of an appropriately chosen solution. The estimator is asymptotically normal, locally efficient and attains the semi-parametric efficiency bound under certain regularity conditions. We illustrate the proposed approach via simulations and a real data application on home pricing.
1 Introduction
Non-response is frequently encountered in social science and biomedical studies, due to reluctance to answer sensitive survey questions. Certain characteristics about the missing data mechanism have been previously used to define a taxonomy to describe the missingness process (Little & Rubin, 2002; Rubin, 1976). Data are said to be missing at random (MAR) if the propensity of missingness conditional on all study variables is unrelated to the missing values. Otherwise, it is called missing not at random (MNAR) or non-ignorable. MAR has been commonly used for statistical analysis in the presence of missing data; however, in many fields of study, suspicion that the missing data mechanism may be non-ignorable is often warranted (Ibrahim et al., 1999; Robins et al., 2000; Rotnitzky & Robins, 1997; Rotnitzky et al., 1998; Scharfstein et al., 1999). For example, non-response rates in surveys about income tend to be higher for low socio-economic groups (Kim & Yu, 2011). In another example, efforts to estimate HIV prevalence in developing countries via household HIV survey and testing such as the well-known Demographic and Health Survey, are likewise subject to non-ignorable missing data on participants’ HIV status due to highly selective non-participation in the HIV testing component of the survey study (Tchetgen Tchetgen & Wirth, 2017). There currently exist a variety of methods for the analysis of MAR data, such as likelihood-based inference, multiple imputation, inverse probability weighting, and doubly robust methods. However, these methods can result in severe bias and invalid inference in the presence of non-ignorable missing data.
In this paper, we focus on identification and estimation of mean functionals of observed covariates and an outcome variable subject to non-ignorable missingness. Estimating mean functionals is a goal common to many scientific areas, e.g., sampling survey and causal inference, and thus is of significant practical importance. However, there are several difficulties for analysis of non-ignorable missing data. The first challenge is identification, which means that the parameter of interest is uniquely determined from observed data distribution. Identification is straightforward under MAR as the conditional outcome distribution in complete cases equals that in incomplete cases given fully observed covariates, whereas it becomes difficult under MNAR because the selection bias due to missing values is no longer negligible. Even if stringent fully parametric models are imposed on both the propensity score and the outcome regression, identification may not be achieved; for counterexamples, see Wang et al. (2014) and Miao et al. (2016). To resolve the identification difficulty, previous researchers (Kim & Yu, 2011; Robins et al., 2000) have assumed that the selection bias is known or can be estimated from external studies, but this approach should be used rather as a sensitivity analysis, until the validity of the selection bias assumption is assessed. Without knowing the selection bias, identification can be achieved by leveraging fully observed auxiliary variables that are available in many empirical studies. For instance, instrumental variables, which are related to the non-response propensity but not related to the outcome given covariates, have been used in missing data analysis since Heckman (1979). The corresponding semi-parametric theory and inference are recently established by Liu et al. (2020), Sun et al. (2018), Tchetgen Tchetgen and Wirth (2017), Das et al. (2003). Recently, an alternative approach called the shadow variable approach has grown in popularity in sampling survey and missing data analysis. In contrast to the instrumental variable, this approach entails a shadow variable that is associated with the outcome but independent of the missingness process given covariates and the outcome itself. Shadow variable is available in many applications (Kott, 2014). For example, Zahner et al. (1992) and Ibrahim et al. (2001) considered a study of the children’s mental health evaluated through their teachers’ assessments in Connecticut. However, the data for the teachers’ assessments are subject to non-ignorable missingness. As a proxy of the teacher’s assessment, a separate parent report is available for all children in this study. The parent report is likely to be correlated with the teacher’s assessment, but is unlikely to be related to the teacher’s response rate given the teacher’s assessment and fully observed covariates. Hence, the parental assessment is regarded as a shadow variable in this study. The shadow variable design is quite general. In health and social sciences, an accurately measured outcome is routinely available only for a subset of patients, but one or more surrogates may be fully observed. For instance, Robins et al. (1994) considered a cardiovascular disease setting where, due to high cost of laboratory analyses, and to the small amount of stored serum per subject (about of study subjects had stored serum thawed and assayed for antioxidants serum vitamin A and vitamin E), error-prone surrogate measurements of the biomarkers derived from self-reported dietary questionnaire were obtained for all subjects. Other examples include the semi-supervised setting in comparative effectiveness research where the true outcome is measured only for a small fraction of the data, e.g., diagnosis requiring a costly panel of physicians while surrogates are obtained from databases including ICD-9 codes for certain comorbidities. Instead of assuming MAR conditional on the surrogates, the shadow variable assumption may be more appropriate in presence of informative selection bias. By leveraging a shadow variable, D’Haultfœuille (2010) and Miao et al. (2015) established identification results for non-parametric models under completeness conditions. In related work, Wang et al. (2014), Shao and Wang (2016), Tang et al. (2003), Zhao and Shao (2015), and Morikawa and Kim (2021) proposed identification conditions for a suite of parametric and semi-parametric models that require either the propensity score or the outcome regression, or both to be parametric. All existing shadow variable approaches need to further impose sufficiently strong conditions to identify the full data distribution, although in practice one may only be interested in a parameter or a mean functional which may be identifiable even if the full data distribution is not.
The second challenge for MNAR data is model misspecification in estimation, after identification is established. Likelihood-based inference (Greenlees et al., 1982; Tang et al., 2003, 2014), imputation-based methods (Kim & Yu, 2011), inverse probability weighting (Wang et al., 2014) have been developed for analysis of MNAR data. These estimation methods require correct model specification of either the propensity score or the outcome regression, or both. However, bias may arise due to specification error of parametric models as they have limited flexibility, and moreover, model misspecification is more likely to appear in the presence of missing values. Vansteelandt et al. (2007), Miao and Tchetgen Tchetgen (2016), Miao et al. (2015), and Liu et al. (2020) proposed doubly robust methods for estimation with MNAR data, which affords double protection against model misspecification; however, these previous proposals require an odds ratio model characterizing the degree of non-ignorable missingness to be either completely known or correctly specified.
In this paper, we develop a novel strategy to non-parametrically identify and estimate a generic mean functional. In contrast to previous approaches in the literature, this work has the following distinctive features and makes several contributions to non-ignorable missing data literature. First, given a shadow variable, we directly work on the identification of the mean functional without identifying the full data distribution, whereas previous proposals typically have to first ensure identification of the full data distribution. In particular, we establish a necessary and sufficient condition for identification of the mean functional, which is weaker than the commonly used completeness condition for non-parametric identification. For estimation, we propose a representer assumption which is necessary for -estimability of the mean functional. The representer assumption naturally strengthens the identifying condition, and it involves the existence of a function as a solution to a representer equation that relates the mean functional with the shadow variable. Second, under the representer assumption, we propose non-parametric estimation that no longer involves parametrically modelling the propensity score or the outcome regression. Non-parametric estimation has been largely studied in the literature and has received broad acceptance with machine learning tools in many applications (Chen & Pouzo, 2012; Kennedy et al., 2017; Newey & Powell, 2003). Because the solution to the representer equation may not be unique, we first construct a consistent estimator of the solution set. We use the method of sieves to approximate unknown smooth functions as possible solutions and estimate corresponding coefficients by applying a minimum distance procedure, which has been routinely used in semi-parametric and non-parametric econometrics literature (Ai & Chen, 2003; Chen & Pouzo, 2012; Newey & Powell, 2003; Santos, 2011). We then adapt the theory of extremum estimators to find from the estimated set a consistent estimator of an appropriately chosen solution. Based on such an estimator, we propose a representer-based estimator of the mean functional. Under certain regularity conditions, we establish consistency and asymptotic normality for the proposed estimator. Due to the non-uniqueness of solutions to the representer equation, the asymptotic results do not simply follow from the standard non-parametric theory and additional techniques are required. Besides, the proposed estimator is locally efficient for the mean functional under our shadow variable model, if the completeness condition is further imposed.
The rest of this paper proceeds as follows. In Section 2, we provide a necessary and sufficient identifying condition for a generic mean functional within the shadow variable framework, and also introduce a representer assumption that is necessary for -estimability of the mean functional. In Section 3, we develop a model-free estimator of the mean functional, establish the asymptotic theory, discuss its semi-parametric efficiency, and provide computational details. In Section 4, we study the finite-sample performance of the proposed approach via both simulation studies and a real data example about home pricing. We conclude with a discussion in Section 5 and relegate proofs to the supplementary material.
2 Identification
In this section, we discuss identification of a generic mean functional in the shadow variable framework regardless of the identifiability of the full data distribution. In particular, we provide a necessary and sufficient condition for identifying the mean functional, which is weaker than the commonly used completeness conditions. We also introduce a representer assumption by naturally strengthening the identifying condition, because this assumption is necessary for -estimability of the mean functional.
Let X denote a vector of fully observed covariates, Y the outcome variable that is subject to missingness, and R the missingness indicator with if Y is observed and otherwise. The missingness process may depend on the missing values. We let denote the probability density or mass function of a random variable (vector). The observed data contain n independent and identically distributed realizations of with the values of Y missing for . We are interested in the identification and statistical inference about the mean functional for a generic function . In particular, when , the parameter corresponds to the population outcome mean that is of particular interest in sampling survey and causal inference. This setup also covers the ordinary least squares regression problem if we choose for any component of X; and further generalizes to arbitrary functionals of the full data that can be defined implicitly as solution to a moment equation. Suppose we observe an additional shadow variable Z that meets the following requirements.
Shadow variable
(i) ; (ii) .
Assumption 1 reveals that the shadow variable does not affect the missingness process given the covariates and outcome, and it is associated with the outcome given the covariates. There are various causal diagrams satisfying Assumption 1, and we list three such examples in Figure 1. In particular, Figure 1b considers the scenario where the missingness does not depend directly on the outcome but correlates with it via their unmeasured common causes. Besides, Figure 1b allows X and Y to precede Z. Figure 1c is more complicated by allowing for both the direct dependence of R on Y and the existence of unmeasured common causes of X and R. In practice, domain-specific knowledge is required to justify whether such graphical models and Assumption 1 are reasonable, and they need to be investigated on a case-by-case basis. Assumption 1 has been used for adjustment of selection bias in sampling surveys (Kott, 2014) and in missing data literature (D’Haultfœuille, 2010; Miao & Tchetgen Tchetgen, 2016; Wang et al., 2014). Examples and extensive discussions about the assumption can be found in Zahner et al. (1992), Ibrahim et al. (2001), Miao et al. (2015), and Miao and Tchetgen Tchetgen (2016). Assumption 1 is important for identification of μ in non-ignorable missing data analysis. If Z affects the missingness indicator after conditioning on , then μ may not be identifiable even in fully parametric models (Miao et al., 2016; Wang et al., 2014). Under Assumption 1, Miao et al. (2015) showed that
where , and is the odds ratio function relating R to Y conditional on X. Under an additional completeness condition that for any square-integrable function , almost surely if and only if almost surely, Miao et al. (2015) showed identifiability of and further established identifiability of the full data distribution.
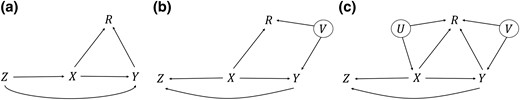
Causal graphical examples (a)-(c) illustrating Assumption 1 with the shadow variable Z, missingness indicator R, covariates X and outcome Y; variables in circles are unmeasured.
We note that the equation in (1) can be simplified as follows:
where
To illustrate how the shadow variable Z is leveraged for identification, we consider the special case where both Y and Z are binary. By setting , we obtain two equations for the unknown functions and from (2). Then these two unknown functions can be uniquely solved from the system of the two equations as long as . This implies that , and therefore, the full data distribution are identifiable. In general, without further assumptions such as completeness conditions, is not identifiable from (2). Nevertheless, by noting that
the expectation functional μ can be identified under conditions possibly weaker than those required for identification of itself. The intuition is as follows. According to the above equation, the identification of μ depends on identification of the linear functional or . If we can decompose into some identifiable part and non-identifiable part , i.e., with , then we have , and hence the linear functional is identifiable. This in fact can be achieved with being the orthogonal projection of onto an appropriate chosen space so that is guaranteed to be identifiable; accordingly, is the orthogonal projection of onto the orthogonal complement of the chosen space.
The formal discussions on how to choose the projection space are characterized in terms of operators on Hilbert spaces. Let denote the set of real valued functions of that are square integrable with respect to the conditional distribution of given . Let be the linear operator given by . Its adjoint operator is the linear map . The range and null space of T is denoted by and , respectively. The orthogonal complement of a set is denoted by and its closure in the norm topology is . Let denote the orthogonal projection onto the set . If the projection space discussed above is , then is identifiable and the reasons are given as follows. Noting that the equation in (2) can be rewritten as using the operator T, then from the decomposition , it follows that , where is the restriction of T to . Since , the quantity is identifiable.
Under Assumption 1, μ is identifiable if and only if .
Since the definition of the operator T involves only observed data, the identifying condition could be justified in principle without extra model assumptions on the missing data distribution. In contrast to previous approaches that have identified the full data distribution under varying completeness conditions, our identification strategy allows for a larger class of models where the parameter of interest is uniquely identified even though the full data law may not be. For example, Miao et al. (2015) established identification of the full data distribution under the completeness condition within the shadow variable framework. Since we may only be interested in a mean functional of the data distribution in practice, identification of such a parameter requires possibly weaker assumptions. In fact, Theorem 1 has provided a necessary and sufficient condition for identification of the mean functional μ given a valid shadow variable. When the completeness condition holds, then , and the functional μ is identifiable because . Even if the completeness condition does not hold, we can still identify μ as long as . An example is given at the end of this section. In other words, the completeness condition is sufficient but not necessary for identifying the mean functional μ. Although the proposed condition guarantees identifiability of μ, it does not suffice for its -estimability, particularly for functionals that lie in the boundary of . Following Lemma 4.1 in Severini and Tripathi (2012), one can show that the following assumption is necessary for -estimability of μ under some regularity conditions.
Representer
Since , the representer assumption naturally strengthens the identifying condition . Assumption 2 requires the existence of a solution to the representer equation in (3), which essentially implies Assumption 1(ii). Thus, if Assumption 2 holds, then Assumption 1(ii) is satisfied. Equation (3) relates the function with the shadow variable via the representer function . This equation has some connections to confounding bridge functions in negative control literature for identification of average causal effects (Cui et al., 2020; Miao et al., 2018), as both of them have defined their separate inverse problems formally known as the Fredholm integral equation of the first kind. It is also important to note that the representer equation does not follow directly from the confounding bridge function. As discussed above, the representer assumption is motivated by the necessary and sufficient identifying condition given in Theorem 1. The requirement for existence of solutions to (3) in Assumption 2 is mild, and this assumption is nearly necessary for the completeness condition. Specifically, if the completeness condition holds, then the solution to (3) exists under some regularity conditions on the singular value decomposition of a conditional mean operator given in Conditions S1–S2 of online supplementary materials. Similar conditions for existence of a solution to the Fredholm integral equation of the first kind are discussed by Carrasco et al. (2007), Miao et al. (2018), and Cui et al. (2020).
We give some toy examples where Assumption 2 holds. If there exists some transformation of Z such that and , then Assumption 2 is met with . As a special case, when is linear in . Note that Assumption 2 only requires the existence of solutions to equation (3), but not uniqueness. For instance, if both Z and Y are binary, then is unique and
where for . However, if Z has more levels than Y, then may not be unique. For simplicity, we may drop the arguments in and directly use in what follows, and notation for other functions are treated in a similar way.
From Corollary 1, even if is not uniquely determined, all solutions to Assumption 2 must result in an identical value of μ. Moreover, this identification result does not require identification of the full data distribution . In fact, identification of is not ensured under Assumptions 1 and 2 only; see Example 1. To our knowledge, the identifying Assumptions 1–2 are so far the weakest for the shadow variable approach. Besides that, Assumption 2 is also necessary for -estimability of μ within the shadow variable framework. We further illustrate Assumption 2 with the following example.
Consider the following two data generating processes (DGPs):
DGP 1: , , and .
DGP 2: , , and .
Suppose we are interested in estimating the outcome mean . It is easy to verify that the above two DGPs satisfy Assumption 2 by choosing . These two DGPs imply the same outcome mean and the same observed data distribution, because and in these two DGPs. However, the full data distributions of these two DGPs are different.
3 Estimation, inference, and computation
In this section, we provide an estimation method without modelling the propensity score or outcome regression. Previous approaches often require fully or partially parametric models for at least one of them. For example, Qin et al. (2002) and Wang et al. (2014) assumed a fully parametric model for the propensity score; Kim and Yu (2011) and Shao and Wang (2016) relaxed their assumption and considered a semi-parametric exponential tilt model for the propensity; Miao and Tchetgen Tchetgen (2016) proposed doubly robust estimation methods by either requiring a parametric propensity score or an outcome regression to be correctly specified. Our approach aims to avoiding (i) point identification of the full data law under more stringent conditions and (ii) parametric assumptions either for identification or for estimation.
As implied by Corollary 1, any solution to (3) provides a valid for identifying the parameter μ. Suppose that all such solutions belong to a set of smooth functions, with specific requirements for smooth functions given in Definition 1. Then the set of solutions to (3) is
For estimation and inference about μ, we need to construct a consistent estimator of some fixed element . If were known, then one would simply select one element from the set and use this element to estimate μ. Without knowing , the lack of identification of presents important technical challenges. In particular, common estimators of the non-parametric nuisance function may be unstable and may not necessarily converge to any fixed limit. The resulting estimator of the mean functional μ using these nuisance estimates would then have intractable asymptotic behaviour. However, the solution set is identified and can be estimated. We thus aim to obtain an estimator in the following two steps: first, construct a consistent estimator of the set ; second, carefully select such that it is a consistent estimator of a fixed element .
3.1 Estimation of the solution set
Define the criterion function
Then the solution set in (4) is equal to the set of zeros of , i.e.,
and hence, estimation of is equivalent to estimation of zeros of . This can be accomplished with the approximate minimizers of a sample analogue of (Chernozhukov et al., 2007).
We adopt the sieve approach to construct a sample analogue function for and a corresponding approximation for . Let denote a sequence of known approximating functions of x and z, and
for some known and unknown parameters . The construction of involves non-parametric estimation of conditional expectations. Let be a sequence of known approximating functions of x and y. Denote the vector of the first terms of the basis functions by
and let
For a generic random variable with realizations , the non-parametric sieve estimator of is obtained by the linear regression of B on the vector in complete cases, i.e.,
Then the sample analogue of Q is
with
where the explicit expression of is obtained from (6). Finally, the proposed estimator of is
where and are given in (5) and (7), respectively, and is a sequence of small positive numbers converging to zero at an appropriate rate. The requirement on the rate of will be discussed later for theoretical analysis.
3.2 Set consistency of
We establish the set consistency of for in terms of Hausdorff distances. For a given norm , the Hausdorff distance between two sets is
where and is defined analogously. Thus, is consistent under the Hausdorff distance if both the maximal approximation error of by and of by converge to zero in probability.
We consider two different norms for the Hausdorff distance: the pseudo-norm defined by
and the supremum norm defined by
From the representer equation (3), we have that for any and , . Hence,
This result implies that we can obtain the convergence rate of by deriving that of . However, the identified set is an equivalence class under the pseudo-norm, and the convergence under does not suffice to consistently estimating a given element . Whereas the supremum norm is able to differentiate between elements in , and under certain regularity condition as we will show later.
We make the following assumptions to achieve consistency of under the metric and to obtain the rate of convergence for under the weaker metric .
The vector of covariates has support , and the outcome and the shadow variable have compact supports.
Assumption 3 requires to have compact supports, and without loss of generality, we assume that X has been transformed such that the support is . These conditions are fairly standard in semi-parametric literature. Although Y and Z are also required to have compact support, the proposed approach may still be applied if the supports are infinite with sufficiently thin tails. For instance, in our simulation studies where the variables Y and Z are drawn from a normal distribution in Section 4, the proposed approach continues to perform quite well.
We next impose restrictions on the smoothness of functions in the set , characterized by the following Sobolev norm.
A function with has uniformly bounded partial derivatives up to order ; besides, the th partial derivative of this function is Lipschitz of order .
The following conditions hold:
for some ; in addition, , , and both and are closed;
There is an operator such that for every , and for some .
Assumption 4(i) requires that each function is sufficiently smooth and bounded. The closedness condition in this assumption and Assumption 3 together imply that is compact under . It is well known that solving integral equations as in (3) is ill-posed. The ill-posedness due to non-continuity of the solution and difficulty of computation can have a severe impact on the consistency and convergence rates of estimators. The compactness condition ensures that the consistency of the proposed estimator under is not affected by the ill-posedness. Such a compactness condition is commonly made in the non-parametric and semi-parametric literature; see, e.g., Newey and Powell (2003), Ai and Chen (2003), and Chen and Pouzo (2012). Alternatively, it is possible to address the ill-posed problem by employing a regularization approach as in Horowitz (2009) and Darolles et al. (2011).
Assumption 4(ii) quantifies the approximation error of functions in by the sieve space . This condition is satisfied by many commonly used function spaces (e.g., Hölder space), whose elements are sufficiently smooth, and by popular sieves (e.g., power series, splines). For example, consider the function set with . If the sieve functions are polynomials or tensor product univariate splines, then uniformly on , the approximation error of by functions of the form under is of the order . Thus, Assumption 4(ii) is met with ; see Chen (2007) for further discussion.
The following conditions hold:
the smallest and largest eigenvalues of are bounded above and away from zero for all ;
- for every , there is a such that
, where .
Assumption 5 bounds the second moment matrix of the approximating functions away from singularity, presents a uniform approximation error of the series estimator to the conditional mean function, and restricts the magnitude of the series terms. These conditions are standard for series estimation of conditional mean functions; see, e.g., Newey (1997), Ai and Chen (2003), and Huang (2003). Primitive conditions are discussed below so that the rate requirements in this assumption hold. Consider any satisfying Assumption 4, i.e., . If the partial derivatives of with respect to are continuously differentiable up to order , then under Assumption 3, we have . In addition, if the sieve functions are polynomials or tensor product univariate splines, then by similar arguments after Assumption 4, we conclude that the approximation error under is of the order uniformly on . Verifying Assumption 5(iii) depends on the relationship between and . For example, if are tensor product univariate splines, then .
Write in (9) by with appropriate sequences and , and define .
Theorem 2 shows the consistency of under the supremum-norm metric and establishes the rate of convergence of under the weaker pseudo-norm metric . In particular, if we let , , and as imposed in Assumption 7 in the next subsection, then or . We take and . Thus, , , and . In fact, under such rate requirements, we have and , which are sufficient to establish the asymptotic normality of the proposed estimator given in Subsection 3.4.
3.3 A representer-based estimator
In this subsection, we aim to provide a consistent estimator of the mean functional μ identified in Corollary 1 and discuss its asymptotic properties. Since we have obtained a consistent estimator of the solution set according to Theorem 2, it remains to select an estimator from such that it converges to a unique element belonging to . Although any element of the set is valid for constructing a consistent estimator of μ, such an estimator may not be asymptotically normal if the element is not carefully chosen. We adapt the theory of extremum estimators to choose the element (Kosorok, 2008). Let be a population criterion functional that attains a unique minimum on and be its sample analogue. We then choose the minimizer of over the estimated solution set , denoted by
which is expected to converge to the unique minimum of on .
The function set is convex; the functional is strictly convex and attains a unique minimum at on ; its sample analogue is continuous and .
One simple example of the criterion functional M satisfying Assumption 6 is
This is a convex functional with respect to . Its sample analogue is
Under Assumptions 3–4, we have shown in supplementary materials that the function class is a Glivenko-Cantelli class, and thus .
Theorem 3 implies that by choosing an appropriate functional satisfying Assumption 6, it is possible to construct a consistent estimator for some unique element in terms of supremum norm and further obtain its rate of convergence under the weaker pseudo-norm .
Based on the estimator given in (11), we obtain the following representer-based estimator of μ:
The estimator depends on the criterion functional M through . However, since Theorem 3 has shown that for any M satisfying Assumption 6, it then follows from the law of large numbers and Corollary 1 that is always consistent for μ irrespective of the choice of M.
Below we discuss the asymptotic expansion of the estimator . Let be the closure of the linear span of under , which is a Hilbert space with inner product:
for any .
The following conditions hold:
- there exists a function such that
, , , , and .
Note that the linear functional is continuous under . Hence, by the Riesz representation theorem, there exists a unique (up to an equivalence class in ) such that for all . However, Assumption 7(i) further requires that this equivalence class must contain at least one element that falls in . This can be guaranteed by choosing to be a closed subspace of , because in this case. Assumption 4 has required to be closed, bounded, and sufficiently smooth. An example of satisfying all these requirements is a closed subspace of the Hölder space, e.g., a space of polynomials with degree no larger than some fixed integer. For a more general function set , a primitive condition for Assumption 7(i) is that the inverse probability weight also has a smooth representer: if
then satisfies Assumption 7(i). Assumption 7(ii) imposes some rate requirements on the approximation error of functions in by the sieve space and the dimension of the approximation sieve functions . For bounded approximation sieves , we have according to the definition. Then Assumption 7(ii) requires that , where and . These requirements can be satisfied as long as the function classes being approximated in Assumptions 4 and 5 are sufficiently smooth.
Theorem 4 reveals an asymptotic expansion of . The estimator is not necessarily asymptotically normal as the bias term may not be asymptotically negligible. Nevertheless, if the bias term can be estimated with sufficiently fast convergence rates, then by subtracting the estimated bias term from the representer-based estimator , we can obtain a debiased estimator that is asymptotically normal.
3.4 A debiased semi-parametric locally efficient estimator
In this subsection, we propose a debiased representer-based estimator which is regular and asymptotically normal. Since the estimator is based on the chosen element through some criterion functional M in Assumption 6, the asymptotic variance may depend on the choice of M. If further a key completeness condition holds, the solution set contains a single element at the true data generating mechanism and any choice of M leads to an estimator with the same asymptotic variance. Under such circumstance, we further establish that the estimator is semi-parametric locally efficient. To derive the debiased estimator, we need to estimate the bias term . Note that only is unknown in the expression of given in (16). We propose to construct an estimator of and define the following criterion function:
and its sample analogue,
Since by Assumption 7, it follows that . Thus, is the unique minimizer of up to the equivalence class in . In addition, since and are close under the metric by Assumption 4(ii), we then define the estimator of by:
Given the estimator , an approximation to the term is given by
This lemma establishes the rate of convergence of to uniformly on . If converges to zero sufficiently fast, then . The rate conditions imposed in Assumption 7(ii) guarantee that such a choice of is feasible. As a result, Theorem 7 and Lemma 1 together imply that a debiased estimator that is -consistent and asymptotically normal can be constructed by subtracting the estimated bias from :
Theorem 5 shows that although the debiased estimator depends on the criterion functional M, such an estimator is always -consistent and asymptotically normal as long as the choice of M satisfies Assumption 6. However, because appearing in (20) is the minimizer of M on , the asymptotic variance of may depend on the choice of M. As such, sensitivity analysis may be useful for choosing M. In particular, given a variety of candidate functionals M satisfying Assumption 6, one may obtain a series of corresponding debiased estimators, from which, an estimator with minimal variance can be selected. However, since there may exist infinite choices, it is in general unable to select an estimator that achieves the semi-parametric efficiency bound under the shadow variable model. Based on (20), one can easily construct an estimator of the asymptotic variance as follows:
Under Assumptions 3–7, the estimator converges in probability to as n goes to infinity.
Proposition 1 implies that given , an asymptotic confidence interval is , where . The formula in (20) presents the influence function for . Under the following conditions, the influence function is locally efficient in the sense that it attains the semi-parametric efficiency bound for the mean functional in the semi-parametric model defined by (2).
The following conditions hold:
Completeness: (a) for any square-integrable function , almost surely if and only if almost surely; (b) for any square-integrable function , almost surely if and only if almost surely.
Denote . Suppose that .
Completeness in Assumption 8(i) is equivalent to the injectivity of the conditional expectation operator (D’Haultfoeuille, 2011). Under the completeness condition in Assumption 8(i), is identifiable, and that respectively solve equations (3) and (15) are also uniquely determined. Completeness can be checked in specific models; for instance, one can check whether the covariance matrix is of full rank in the joint normal model. However, without restrictions on the distribution, it is generally impossible to provide empirical evidence in favor of the completeness condition (Canay et al., 2013). Assumption 8(ii) bounds the conditional variance of away from zero and infinity.
The influence function in (20) attains the semi-parametric efficiency bound of μ in at the submodel where solves equation (15) and Assumptions 1–8 hold.
Given the completeness condition in Assumption 8(i), the solution set contains a single element at the true data generating mechanism. Then the nuisance function appearing in (20), which is the minimizer of a convex functional M on , should be unique irrespective of the choice of M. Theorem 6 implies that any choice of M leads to an asymptotically equivalent estimator, which also attains the semi-parametric efficiency bound at a key submodel where the representer is uniquely identified.
3.5 Computation
In this subsection, we discuss computations of in (11) and in (17) that are both required for . For the computation of , we aim to solve the following constrained optimization problem:
The constrained function in (7) is quadratic in and the objective function is required to be convex. It remains to impose some constraints on so that we could have a tractable optimization problem.
A computationally simple choice for is linear sieves as defined in (5); that is, for any , we have , where and . For this choice of , if we define for some as required by Assumption 4, then the constraint can be highly non-linear in . We thus follow Newey and Powell (2003) by defining as the closure of the set under , where and
In the above equation, denotes the support of Z, λ is a -dimensional vector of non-negative integers, , and the operator is defined in Definition 1. Then the constraint now turns to , where
Based on the above discussions, the constrained optimization problem in (21) becomes:
and the estimate of is . The computation of is similar to that of . Specifically, we first solve
and then let . In the above optimization problems, and K are tuning parameters. In principle, one can set these parameters to arbitrary values as long as the rate requirements of the asymptotic results are satisfied. The theory, however, offers little guidance for how to select their values. Several data-driven methods for selecting tuning parameters in series estimation have been discussed by Li and Racine (2007). Here we suggest using κ-fold cross-validation to select the tuning parameters. Specifically, we split the data into κ balanced groups. Of the κ subsamples, a single subsample is retained as the test data and the remaining subsamples are used as the training data. We obtain an estimate by solving the constrained optimization problem in (22) based on the training data, and then evaluate it using the criterion function (7) on the test data. We repeat the above process κ times, with each of the κ subsamples used exactly once as the test data. The cross-validation error is defined as an average of the κ evaluation results; the tuning parameters and K are chosen by minimizing the cross validation error. In practice, we tend to choose large values for K and small positive values for . In the simulation studies and real application, candidate values for and K are chosen as follows: , where denotes the minimizer of without any constraints, , and .
4 Numerical studies
4.1 Simulation
In this subsection, we conduct simulation studies to evaluate the performance of the proposed estimators in finite samples. We consider two different cases. In case (I), the data are generated under models where the full data distribution is identified. In case (II), the full data distribution is not identified but Assumption 2 holds.
For case (I), we generate four covariates according to for . We consider four data generating settings, including combinations of two choices of outcome models and two choices of propensity score models.
The missingness indicator R does not depend on Z given , and hence the shadow variable assumption holds. We generate Y and Z from a normal distribution here to evaluate the proposed approach. Although Y and Z are both required to have compact support in Assumption 3, the proposed approach may still be applied in this situation. The missing data proportion in each of these settings is about . For each setting, we replicate 1,000 simulations at sample sizes 500 and . We apply the proposed debiased estimator to estimate the population outcome mean . To implement the proposed estimator, we choose polynomials of order 3 as sieve functions in both simulation studies and the empirical example, and choose the quadratic criterion functionals M and given in (12) and (13), respectively. We denote the resultant estimator by qd-REP-DB. Quartic functionals for M and are also considered in the current simulation setting, and the corresponding estimator is denoted by qr-REP-DB. For comparison, we also use the following methods to estimate μ: (i) ln-mnarIPW, an inverse probability weighted estimator with a logistic linear propensity score model assuming MNAR; (ii) py-mnarIPW, an inverse probability weighted estimator with a logistic polynomial-sieves propensity score assuming MNAR; (iii) marREG, a regression-based estimator assuming MAR.
Simulation results are reported in Figure 2. The proposed estimators qd-REP-DB and qr-REP-DB have negligible biases and their performances are almost the same in all four settings. In contrast, the estimator ln-mnarIPW with a logistic linear propensity score model can have comparable bias with ours only when the propensity score model is correctly specified; see settings (a) and (c). If the propensity score model is incorrectly specified as in settings (b) and (d), the estimator ln-mnarIPW exhibits an obvious downward bias and does not vanish when the sample size increases. Somewhat surprisingly, the estimator py-mnarIPW with a more complex propensity score model performs even worse than ln-mnarIPW with a simple logistic linear model in almost all settings. The reasons may be as follows. Note that the inverse probability weighted estimator under MNAR is obtained by solving estimating equations (Wang et al., 2014). When we use a complex propensity score model for the missingness mechanism, we need to solve a large system of equations with many unknown parameters, which may yield unstable solutions with less accuracy. Finally, since the missingness mechanism is MNAR, the estimator marREG assuming MAR is expected to have non-negligible bias in all settings. We also conduct simulation studies when the shadow variable assumption does not hold, but MAR does, and details about simulation settings and results can be found in the supplementary materials.
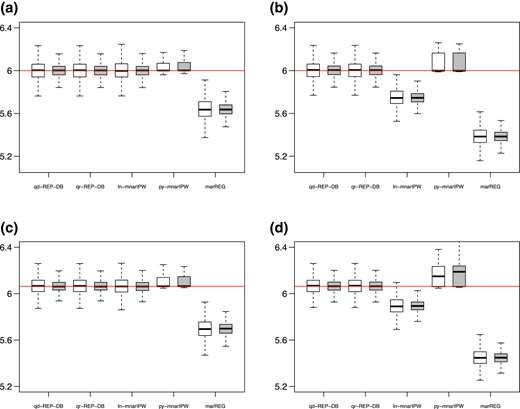
Comparisons in case (I) between the proposed two estimators (qd-REP-DB with quadratic functional M and qr-REP-DB with quartic functional M) and existing estimators (ln-mnarIPW with logistic linear propensity score, py-mnarIPW with logistic polynomial-sieves propensity score, and marREG) under sample sizes and . The abbreviation LL stands for linear-logistic propensity score model with linear outcome model, and the other three scenarios are analogously defined. The horizontal line marks the true value of the outcome mean. (a) LL. (b) NL. (c) LN, and (d) NN.
We calculate the 95% confidence interval based on the proposed estimator and the inverse probability weighted estimator assuming MNAR. Since the estimators qd-REP-DB and qr-REP-DB behave similarly and the estimator ln-mnarIPW performs better than py-mnarIPW, we thus focus only on qd-REP-DB and ln-mnarIPW. For simplicity, we denote them by REP-DB and mnarIPW, respectively. Coverage probabilities (CPs) of these two approaches are shown in Table 1. The estimator REP-DB based confidence intervals have CPs close to the nominal level of in all scenarios even under small sample size . In contrast, the estimator mnarIPW based confidence intervals have CPs well below the nominal value if the propensity score model is incorrectly specified.
Coverage probability of the 95% confidence interval for the estimators REP-DB and mnarIPW in case (I) under and
| n | Methods | LL | NL | LN | NN |
|---|---|---|---|---|---|
| 500 | REP-DB | 0.939 | 0.938 | 0.945 | 0.943 |
| mnarIPW | 0.930 | 0.635 | 0.928 | 0.491 | |
| 1,000 | REP-DB | 0.947 | 0.939 | 0.948 | 0.948 |
| mnarIPW | 0.943 | 0.381 | 0.951 | 0.177 |
| n | Methods | LL | NL | LN | NN |
|---|---|---|---|---|---|
| 500 | REP-DB | 0.939 | 0.938 | 0.945 | 0.943 |
| mnarIPW | 0.930 | 0.635 | 0.928 | 0.491 | |
| 1,000 | REP-DB | 0.947 | 0.939 | 0.948 | 0.948 |
| mnarIPW | 0.943 | 0.381 | 0.951 | 0.177 |
For case (II), we generate data according to Model 1 in Example 1. As with case (I), we consider two different sample sizes and . We calculate the bias (Bias), Monte Carlo standard deviation (SD) and 95% CPs based on 1,000 replications in each setting. For comparison, we also apply the estimator mnarIPW with a correct propensity score model to estimate μ. As mentioned earlier, the estimator mnarIPW is obtained through solving estimating equations, and its performance may depend on initial values during the optimization process, especially in this case where the full data distribution is not identified. We consider two different settings of initial values for optimization parameters: true values and random values from . The results are summarized in Table 2.
Comparisons in case (II) between the estimators REP-DB and mnarIPW under and
| REP-DB | mnarIPW-true | mnarIPW-uniform | |||||||
|---|---|---|---|---|---|---|---|---|---|
| n | Bias | SD | CP | Bias | SD | CP | Bias | SD | CP |
| 500 | 0.004 | 0.031 | 0.905 | 0.050 | 0.923 | 0.206 | 0.709 | ||
| 1,000 | 0.001 | 0.023 | 0.932 | 0.035 | 0.933 | 0.216 | 0.667 | ||
| REP-DB | mnarIPW-true | mnarIPW-uniform | |||||||
|---|---|---|---|---|---|---|---|---|---|
| n | Bias | SD | CP | Bias | SD | CP | Bias | SD | CP |
| 500 | 0.004 | 0.031 | 0.905 | 0.050 | 0.923 | 0.206 | 0.709 | ||
| 1,000 | 0.001 | 0.023 | 0.932 | 0.035 | 0.933 | 0.216 | 0.667 | ||
We observe from Table 2 that the proposed estimator REP-DB has negligible bias, small standard deviation and satisfactory CP even under sample size . As sample size increases to , the 95% CP is close to the nominal level. For the estimator mnarIPW, only when the initial values for optimization parameters are set to be true values, it has comparable performance with REP-DB. However, if the initial values are randomly drawn from , the estimator mnarIPW has non-negligible bias, large standard deviation and low CP. As sample size increases, the situation becomes worse. We also calculate the estimator mnarIPW when initial values are drawn from other distributions, e.g., standard normal distribution. The performance is even worse and we do not report the results here. The simulations in this case demonstrate the superiority of the proposed estimator over existing estimators which require identifiability of the full data distribution.
4.2 Empirical example
We apply the proposed approach to the China Family Panel Studies, which was previously analysed in Miao et al. (2015). The data set includes 3,126 households in China. The outcome Y is the log of current home price (in RMB yuan), and it has missing values due to the non-response of house owner and the non-availability from the real estate market. The missingness process of home price is likely to be not at random, because subjects having expensive houses may be less likely to disclose their home prices. The missing data rate of current home price is . The completely observed covariates X includes 5 continuous variables: travel time to the nearest business center, house building area, family size, house story height, log of family income, and 3 discrete variables: province, urban (1 for urban househould, 0 rural), refurbish status. The shadow variable Z is chosen as the construction price of a house, which is also completely observed. The construction price is related to the current price of a house, and the shadow variable assumption that the non-response is independent of the construction price conditional on the current price and fully observed covariates is reasonable as the construction price can be viewed as an error-prone proxy for the current home value. For the representer assumption, we have discussed in Section 2 that it can be justified in principle without extra model assumptions on the missing data distribution, as the assumption involves only observed data. In particular, there are some simple examples where this assumption is guaranteed to hold. For instance, if is linear in Y, then this assumption holds immediately according to the discussions below the representer assumption. Motivated by this fact, we fit a linear regression of the shadow variable Z on the covariates X and outcome Y using observed data. We test for significance by performing a t-test for the coefficient of Y, and the corresponding p-value is approximately zero, which indicates that there is a statistically significant relationship between Y and Z. Residual plots in Figure S2 of online supplementary materials show that the residuals are approximately randomly scattered, which one may interpret as evidence supporting the linearity assumption in this example. To further detect the linear structure in this multidimensional regression example, we also make a component-plus-residual plot given in Figure S3 of online supplementary materials. The scatter and the slope of the line in these plots appear approximately linear, as no obvious non-linear patterns emerge. All these empirical results provide no compelling evidence of violation of a linear model for , and hence the representer assumption seems reasonable in the real data example. Further discussions on the required assumptions in this example are given in supplementary materials.
We apply the proposed estimator REP-DB to estimate the outcome mean and the 95% confidence interval. We also use the competing estimator mnarIPW and two estimators assuming MAR (marREG and marIPW) for comparison. The results are shown in Table 3. We observe that the results from the proposed estimator are similar to those from the estimator mnarIPW, both yielding slightly lower estimates of home price on the log scale than those obtained from the standard MAR estimators. However, when the data are transformed back to the original scale, the deviations are notable and amount to approximately RMB yuan. These analysis results are generally consistent with those in Miao et al. (2015).
Point estimates and 95% confidence intervals of the outcome mean for the home pricing example
| Methods | Estimate | 95% confidence interval |
|---|---|---|
| REP-DB | 2.591 | (2.520, 2.661) |
| mnarIPW | 2.611 | (2.544, 2.678) |
| marREG | 2.714 | (2.661, 2.766) |
| marIPW | 2.715 | (2.659, 2.772) |
| Methods | Estimate | 95% confidence interval |
|---|---|---|
| REP-DB | 2.591 | (2.520, 2.661) |
| mnarIPW | 2.611 | (2.544, 2.678) |
| marREG | 2.714 | (2.661, 2.766) |
| marIPW | 2.715 | (2.659, 2.772) |
5 Discussion
With the aid of a shadow variable, we have established a necessary and sufficient condition for non-parametric identification of mean functionals of non-ignorable missing data even if the joint distribution is not identified. Then we naturally strengthen this condition by imposing a representer assumption that is shown to be necessary for -estimability of the mean functional. The assumption involves the existence of solutions to a representer equation, which is a Fredholm integral equation of the first kind and can be satisfied under mild requirements. Based on the representer equation, we propose a sieve-based estimator of the mean functional, which bypasses the difficulties of correctly specifying and estimating the unknown missingness mechanism and the outcome regression. Although the joint distribution is not identifiable, the proposed estimator is shown to be consistent for the mean functional. In addition, we establish conditions under which the proposed estimator is asymptotically normal. Since the solution to the representer equation is not uniquely determined, one cannot simply apply standard theories for non-parametric sieve estimators to derive the above asymptotic results. In fact, we need to firstly construct a consistent estimator of the solution set, and then find from the estimated set a consistent estimator of an appropriately chosen solution. We finally show that the proposed estimator attains the semi-parametric efficiency bound for the shadow variable model at a key submodel where the representer is uniquely identified.
The availability of a valid shadow variable is crucial for the proposed approach to adjust for non-ignorable missing data. An interesting feature of this assumption is that it has some observable implications and it can in principle be falsified with observed data, contrary to the usual ignorability assumption (D’Haultfœuille, 2010; Molenberghs et al., 2008). In particular, under the shadow variable assumption, the equation in : has a solution that is a positive probability, i.e., , and hence, this assumption can be rejected if such a positive solution does not exist. Although refutable, the validity of the shadow variable assumption generally requires domain-specific knowledge of experts and needs to be investigated on a case-by-case basis. The existence of a shadow variable is practically reasonable in the empirical example presented in this paper and similar situations where one or more proxies or surrogates of a variable prone to missing data may be available. In fact, it is not uncommon in survey studies and/or cohort studies in the health and social sciences, that certain outcomes may be sensitive and/or expensive to measure accurately, so that a gold standard measurement is obtained only for a select subset of the sample, while one or more proxies or surrogate measures may be available for the remaining sample. Instead of a standard measurement error model often used in such settings which requires stringent identifying conditions, the more flexible shadow variable approach proposed in this paper provides a more robust alternative to incorporate surrogate measurement in a non-parametric framework, under minimal identification conditions. Besides, as advocated by Robins et al. (2000), in principle, one can also conduct sensitivity analysis to assess how results would change if the shadow variable assumption were violated by some pre-specified amount. For example, suppose that the parameter of interest μ is the population outcome mean. If the shadow variable assumption does not hold, then should depend on R, e.g., . Under this model, the representer assumption holds with . Following the proof of Corollary 1, one can verify that . To conduct sensitivity analysis, we first use the proposed approach to estimate and based on observed data. Then for any given value of the sensitivity parameter ( when the shadow variable assumption holds), one can estimate μ using sample analogues of the above identification formula.
This paper may be improved or extended in several directions. Firstly, the proposed identification and estimation framework may be extended to handle non-ignorable missing outcome regression or missing covariate problems. Secondly, one can use modern machine learning techniques to solve the representer equation so that an improved estimator may be achieved that adapts to sparsity structures in the data. Thirdly, it is of great interest to extend our results to handling other problems of coarsened data, for instance, unmeasured confounding problems in causal inference. Proximal causal inference has been recently developed to adjust for unmeasured confounders by using two suitable negative control variables (Cui et al., 2020; Miao et al., 2018), which is different from the current non-ignorable missing setting that requires only a valid shadow variable. Since the identification of causal effects in negative control literature relies on certain confounding bridge functions that are similar to the representer equation, the proposed approach is a promising tool for relaxing the requirement of unique solutions in proximal causal inference. We plan to pursue these and other related issues in future research.
Acknowledgments
We would like to thank the editor, associate editor, and two anonymous reviewers for their very insightful and helpful comments, which led to a significant improvement of our paper.
Funding
W.L.'s and W.M.'s research is supported by the National Natural Science Foundation of China (12101607,12071015), the National Key R&D Program of China (2022YFA1008100), Beijing Natural Science Foundation (1232008), and the National Statistical Science Research Project (2022LZ13).
Data availability
The R code for the implementation of this paper and the real data set are available at https://gitlab.com/weylpku/nonignorablemissingcode.
Supplementary material
Supplementary material is available online at Journal of the Royal Statistical Society: Series B.
References
Author notes
Conflicts of interest: None declared.
