


Abstract
Augmenting survey data with digital traces is a promising direction for combining the advantages of active and passive data collection. However, extracting interpretable measurements from digital traces for social science research is challenging. In this study, we demonstrate how to obtain measurements of news media consumption from survey respondents’ web browsing data using Bidirectional Encoder Representations from Transformers, a powerful natural language processing algorithm that estimates contextual word embeddings from text data. Our approach is particularly relevant for political scientists and communication researchers studying exposure to online news content but can easily be adapted to projects in other disciplines working with similar data sets.
1 INTRODUCTION
Passively measured digital trace data such as social media activities, search engine queries, phone records and records of users’ online activities are increasingly used in the social sciences to collect information in a naturalistic setting. Early research on digital trace data and ‘big data’ was enthusiastic about the potentials of these data to replace more traditional data sources like survey data (see, e.g. Callegaro & Yang, 2018, for a discussion). However, recent work emphasizes the role of digital trace data to enrich and augment survey data (see, e.g. Japec et al., 2015).
In the social sciences, digital trace data in the form of records of web browsing and combined survey/web browsing data have received special attention in political communication research. Examples include studies of selective exposure to online news and political polarization on the web (Dvir-Gvirsman et al., 2016) and exposure to populist alternative news media and misinformation (‘fake news’) (Guess, Nyhan, Reifler, et al., 2020; Stier, Kirkizh, et al., 2020). In the past, such research would not have been possible with survey data alone as various biases in survey data arise due to recall and over-reporting errors of news media consumption (e.g. Scharkow, 2016). Only the detailed observation of users’ online activities in combination with survey data has made such projects possible.
However, working with web browsing data in combination with survey records poses new challenges for social scientists, especially with respect to representation and measurement (Bosch & Revilla, 2021; Stier, Breuer, et al., 2020). Researchers need to develop new data collection and sampling designs. More than ever before, accounting for potential errors resulting from, for example, selective participation, is crucial to obtain samples that represent the targeted population. Likewise, new errors may arise, for example, from incomplete observation of web browsing activities due to people using multiple devices or over-coverage of activities due to devices being used by multiple users. Apart from such questions of representation, extracting meaningful measurements from web browsing data is often not straightforward (Bosch & Revilla, 2021; Jungherr & Theocharis, 2017). Web browsing data, for example, can quickly amount to several thousand data points for just one individual. Often, there is no obvious and straightforward way how to condense them into measurements that can be used in the type of explanatory regression modelling or descriptive approaches commonly used in the social sciences.
In this paper, we address the latter challenge of measurement, that is, analysing, measuring and understanding users’ online activities from their web browsing data. Specifically, we show how BERT (Bidirectional Encoder Representations from Transformers, Devlin et al., 2018), a powerful Natural Language Processing (NLP) technique for calculating contextual word embeddings, can be used to obtain meaningful measures of news media consumption from users’ web browsing behaviour, a behaviour often studied with such data. We collected headlines of news articles read online by participants of a web tracking study conducted in France, Germany and the United Kingdom by crawling information from the news websites. Data were collected in the run-up of the 2019 European Parliament election that was held between 23 May and 26 May 2019 in the (back then) 28 member states of the European Union. In addition, participants responded to two surveys that were used to measure their political interest and voting behaviour in the election.
Our approach includes fine-tuning the original BERT model to obtain topic-sensitive embeddings of news article headlines and condensing the obtained embeddings using dimensionality reduction techniques. This allows us to summarize news articles’ content based on the articles’ headlines with a few features. We then use these features to describe respondents’ news diets. Moreover, to demonstrate the practical relevance of the measurements of news media consumption, we relate users’ news media consumption to their responses to survey questions that recorded their political interest and voting behaviour. To allow an international and multi-lingual perspective, we translate all news media content to English before applying our NLP model. Thereby, our measures of online media news consumption can be extended to multiple countries and multiple language contexts.
Even though our NLP approach relies on headlines of news articles only, it is already well suited for analysing and summarizing news media articles as our review of the resulting news media features shows. Moreover, BERT accounts for word context and can be fine-tuned for a variety of purposes. Although we focus on understanding content from a topical view, one can easily extend our approach by fine-tuning the model to also integrate the polarity of news articles or to differentiate between opinion pieces and descriptive news. Publications working with similar data sets, especially in the field of political communication research, have shown a clear need for automated analysis of such combined survey and digital trace data that scales to large data sets.
In the following sections, we review literature mostly from political communication research that is relevant for our study. We then describe our data and our NLP approach in detail. We conclude with a brief presentation of results from a study of the associations between online news media use and political interest and voting behaviour. These demonstrate how measurements of online news media consumption can be included into regression-type modelling and explanation.
2 BACKGROUND
In this section, we review a series of studies that have used records of individuals’ online activities similar to ours to illustrate how others address questions of measurement with web browsing data. We then briefly summarize additional methodological issues, such as sampling and representation issues that arise when collecting and working with combined survey and web browsing data.
2.1 Understanding news media consumption with web browsing data
So far, social science research projects working with combined survey data and records of users’ online activities employ approaches such as counting visits to categories of websites. For example, several studies analyse how users reach online news to investigate whether political attitudes explain online media usage patterns (e.g. Möller et al., 2020; Scharkow et al., 2020; Stier, Kirkizh, et al., 2020) or aim to predict political orientation based on web browsing logs (Bach et al., 2021). Such studies usually count daily visits to news media websites but barely consider what content users are exposed to when browsing the websites (for exceptions see Budak et al., 2016; Flaxman et al., 2016). For example, studies of exposure to populist alternative news do not consider that the domains identified as populist alternative news often contain a mixture of factual news, news with partial factual content and completely made up or ‘factually dubious’ content (Bader et al., 2020; Guess, Nyhan, Reifler, et al., 2020). Other studies investigating selective exposure to polarized news do not consider that many news, even on polarized news websites, are apolitical such as sports news or news about local events. Incorporating the content into the analyses of (alternative) news media exposure can help to overcome these limitations.
A second focus of studies using combined web tracking and survey data is concerned with audience analysis of news platforms on the web. In these studies, survey data are used to gather information about users’ preferences and socio-demographics, while web tracking data are used to measure users’ internet and news media use. Typical research objectives are to investigate differences in socio-demographics and political preferences between visitors and non-visitors of certain categories of websites, such as alternative news websites (Guess, Nyhan, Reifler, et al., 2020), vaccination information websites (Guess, Nyhan, O’Keeffe, et al., 2020) and general health information websites (Bach & Wenz, 2020). Other studies examine ideological segregation in visits to polarized news media (Gentzkow & Shapiro, 2011) and selective exposure, populist attitudes and the consumption of various types of online news (Stier, Kirkizh, et al., 2020).
However, all of the studies mentioned above do not consider variation of content on the (categories of) domains considered. Gentzkow and Shapiro (2011), for example, do not observe whether users with ideologically different views read the same stories within the same outlets. Yet, it is not unlikely that ideological segregation in exposure to news media on the internet is in fact more nuanced and expressed on a topical level. For example, users who seem to be consuming news from ideologically heterogeneous outlets may in fact limit their attention to non-political news on websites that do not cater to their political preferences. Likewise, untrustworthy domains (Guess, Nyhan, Reifler, et al., 2020) contain a mix of actual news to completely made up content. Furthermore, assessing the quality of information featured on websites is essential when dealing with health information (Bach & Wenz, 2020; Boberg et al., 2020). Such differences are not considered when relying on domains without considering the actual content featured on them.
Another stream of research studies the role of referrers that lead internet users to news media domains and articles. Scharkow et al. (2020), for example, use German web tracking data to investigate whether social media and web portals that aggregate news restrict the diversity of content that users are exposed to. Similarly, Cardenal et al. (2019) use data from Spanish internet users to study the impact of different referrers on selective news exposure and Möller et al. (2020) analyse Dutch browsing data linked to survey responses to examine predictors of news consumption mode preferences. However, these studies also do not consider the variety of topics and positions within outlets. If concerns about filter bubbles, echo chambers and algorithmically personalized news diets on social media and search engines hold (see, e.g. Bakshy et al., 2015; Pariser, 2011; Sunstein, 2009), one may expect that news obtained through social media and from search engines differ from those obtained after directly navigating to news websites. News obtained through social media may also over-represent news conveying populist messages and positions (Groshek & Koc-Michalska, 2017).
Several papers address the limitation of heterogeneity of news articles within domains by employing binary classifiers that discriminate, for example, between news articles with political content and those featuring non-political content. Flaxman et al. (2016), for instance, study news consumption patterns and ideological segregation among internet users in the United States by training a classifier that discriminates between descriptive news and opinion pieces and Guess (2021) train a penalized regression classifier to discriminate between articles with political content and those without. However, they do not address variation within the articles identified as political articles.
Other strategies employed with respect to understanding users’ online news media consumption rely on manual coding procedures, sometimes combined with automated analyses. Budak et al. (2016), for example, study ideological bias in news organizations in the United States by training two algorithms that, first, identify front-section news and then, within front-section news, political news. To understand the actual content of the news classified as front-section and political, they employ human judges recruited from a crowdsourcing platform. These crowdworkers then classified news articles into 15 topics derived from a latent Dirichlet allocation (LDA) topic model and classified each article’s ideological position. Similar manual coding is used by Dvir-Gvirsman et al. (2016) for web browsing and survey data from 400 participants in Israel to study selective exposure and by Peterson et al. (2019) for measuring partisan selective exposure in online news consumption during the 2016 U.S. presidential election. While manual coding allows detailed analysis of the content of websites and news articles, it is tedious, expensive and does not scale. Moreover, LDA topic models may not produce accurate classifications, especially for rare topics, as Budak et al. (2016) note.
Several papers from applied computer science investigate the question whether user attributes such as age, gender, education and income can be accurately predicted from users’ web browsing behaviours (see, e.g. Hinds & Joinson, 2018, for a review of relevant studies). Other than many of the studies mentioned above, they explicitly focus on the content featured on websites visited. Hu et al. (2007), for example, use terms scraped from websites visited by users in their data as predictors of age and gender of the users. Zhang et al. (2017) translate website content into features using word2vec embeddings (Mikolov et al., 2013) of terms obtained from websites visited by users. These features are then used for predicting users’ age and gender. Although similar to the NLP approach applied in our paper, word2vec is context-agnostic. That is, the NLP approach that we describe below will produce different embeddings for ‘cell’ in ‘blood cell’ than in ‘cell phone’, while word2vec as used by Zhang et al. will produce the same numerical representations for ‘cell’ due to its context unawareness.
To sum up, the studies reviewed here show a high interest among social scientists for understanding users’ news media consumption and including it in models aimed at explaining social phenomena. Past approaches have, however, only scratched the surface of what can be learned from individuals’ online activities. Before we go on to presenting our data and methods, we briefly review selected empirical findings regarding challenges related to sampling and representation issues that arise when working with combined survey and web browsing data.
2.2 Methodological aspects of web browsing studies
Besides questions of how to derive measurements, combining web browsing data with survey data poses new (and old) challenges related to data collection, sampling and representation. Due to our study’s focus on measurement challenges, we review those additional issues only briefly and we refer readers to a recently introduced error framework for web browsing data for a more detailed review and discussion (Bosch & Revilla, 2021).
A first challenge is related to participant recruitment. To the best of our knowledge, the collection of web browsing data has so far been mostly possible through for-profit online access panels, such as the one used in our study (see Section 3 for details). These online access panels are usually panels of volunteers recruited through, for example, ad-banners placed on websites and social media platforms. Due to the non-probabilistic selection of individuals into the online access panels, inference based on such samples completely depends on modelling assumptions regarding the data generating process (see, e.g. Cornesse et al., 2020, for a recent review). Only recently have academic research institutions, such as the German GESIS Leibniz Institute for the Social Sciences, started to discuss the collection of web tracking data among participants of probability-based survey panels (Kohne et al., 2021).
Closely related is a second challenge. Even though online access panels consist of volunteers interested in participating in research activities, willingness to participate in the collection of web browsing activities is low, with actual participation rates being even lower (Revilla et al., 2021). For example, de Reuver and Bouwman (2015) report that 14% of people invited to participate in web tracking data collection in a Dutch online access panel actually supplied data for the duration of the study period. In a US online access panel, Van Duivenvoorde and Dillon (2015) find that only 2% of all participants invited to install a web tracking tool actually did so. Revilla et al. (2021) report higher participation rates for a series of eight countries across the globe (between 20% and 42%) but note that participants invited to the collection of web tracking data were pre-selected based on panel loyalty and estimated likelihood to participate in web tracking data collection. Moreover, participation rates decreased notably the longer participants were tracked. The reasons why many people who have shown an initial interest in participating in research, as demonstrated by their participation in volunteer online access panels, do not participate in additional data collection efforts are mainly related to privacy concerns and a lack of trust (Revilla et al., 2021). Moreover, all of the studies cited above report differences on several socio-demographic variables between people who are willing to participate in web tracking or actually agreed to do so and those who did not. Thus, when working with data provided by volunteers in online access panels, one needs to account for selection bias related to individuals’ willingness and actual participation in web tracking data collection.
The third challenge is related to actual collection of the data. Once participants have been recruited and have agreed to the collection of the web browsing activities, they need to install a tracking software on the devices they use (Bosch & Revilla, 2021). Issues that need to be addressed relate to ensuring that data collection software is available for all types of devices and operating systems. Moreover, operating systems vary in the amount of information that third parties can access, for example, through research apps. The Android smartphone ecosystem, for example, is much more permissive in the collection of browsing data than Apple’s iOS system (Keusch et al., 2020). In addition, ownership of smartphone type co-varies with socio-economic status such that differences in the amount of data that can be collected due to smartphone brand will correlate with participant characteristics. Furthermore, one needs to assure that data are collected from all devices of a participant, for example, from their smartphone and from their personal computer to obtain complete records of users’ online activities (Revilla et al., 2021). In some cases, however, participants cannot install data collection software if, for example, they use devices provided by their employer who may restrict the installation of third-party software (Barthel et al., 2020). Moreover, participants may acquire new devices without registering for data collection and many web tracking collection techniques offer temporary pausing of data collection. In addition, participants sometimes share devices, for example, with other members of their household which may lead to a form of over-coverage error. Evidence for such errors is presented by Revilla et al. (2017), who report that while 57% of participants in a Spanish online access panel with web browsing data collection installed the tracking software on one device only, only 4% actually use only one device to go online. Likewise, 68% of a tracking panel in the US report having untracked devices (Barthel et al., 2020). Moreover, Revilla et al. (2017) estimated that about 60% of devices are shared with others.
To sum up, the challenges presented here highlight that working with combined survey and web browsing data poses new challenges. Not only do researchers need to think about ways how to condense the information obtained from web browsing data into variables, they also need to address challenges related to selective participation in data collection and selective observation of online activities.
With the approach described in the next section, we demonstrate how to address one of the challenges, namely, deriving interpretable measures of users’ news media consumption that are useful for analysing and summarizing news media for the kind of explanation-focused approaches common in the social sciences.
3 DATA
Data for our project are provided by members of a commercial opt-in online access panel maintained by respondi. Participants registered in this panel are occasionally invited to answer to short surveys in exchange for small incentives. In addition, the panel vendor keeps track of the online and app use behaviour of a subset of panel participants who agreed to having their web browsing and app use behaviour on their private devices monitored. Participants’ browsing behaviour is logged through a web browser plugin provided by the panel vendor that participants installed in the browsers used on their personal computers. Each time a participant navigates to a website, the plugin records the complete URL of the website visited (e.g. https://en.wikipedia.org/wiki/URL), the domain (wikipedia.org), the current date and time as well as the time spent on the website. In addition, participants’ browsing and app use behaviour on mobile devices (e.g. smartphone and tablets) is recorded through a research app, also provided by the panel vendor. After installing the app on mobile devices, participants’ browsing behaviour in the device’s native browser (e.g. Safari in iOS and Chrome in Android) is recorded. Likewise, each time a participant opens an app, the name of the app as well as a time stamp are recorded. Information about interactions of participants with websites and apps, the content shown to participants or their actions inside an app are not observed. Moreover, all data were provided to us in pseudonymized and de-identified form. At any time, participants can opt to pause tracking temporarily or opt out of data collection completely. Researchers can obtain participants’ tracking data from the panel vendor, ask the same participants questions through online surveys and, most importantly, link participants’ tracking data with their survey responses.
We obtained such web browsing data and app use records in the run-up of the 2019 European Parliament elections from panel participants in Germany (n = 1636), France (n = 1748) and the United Kingdom (n = 968). The main objective in selecting participants was to obtain samples with enough variation in respondents’ survey reports (see below) and their browsing behaviour in short time. Although these samples match population benchmarks in each country on several socio-demographic characteristics, we note that they are not suited for population inference without further corrections through weighting or similar techniques. In addition, it is likely that our data are also affected by issues like participants using devices not covered in our data collection, participants sharing devices with other individuals or participants pausing data collection temporarily (see Section 2.2 for details). Thus, it is possible that our data do not capture all of participants’ web browsing activities and that sometimes information may be produced by third parties that should not be included in our data. Given our primary interest in deriving features from the websites participants visited and in connecting those to survey responses of the same participants, we do not address those issues further in this study. However, we note that to explore the full potentials of combined web browsing and survey data, future research needs to tackle challenges beyond the one addressed in this paper.
Records of participants’ online behaviour and app use were provided for us from 26 April 2019 to 30 May 2019. In addition, we asked tracked participants several questions about their voting behaviour and political interest in two online surveys. The first survey was fielded before the election (GER: 20–25 May; FR: 17–26 May; UK: 17–23 May), the second one was fielded after the election (GER: 31 May–11 June; FR: 31 May–10 June; UK: 31 May–10 June). The core questions we asked in the pre-election survey dealt with respondents’ political interest and whether they were undecided whom to vote for in the upcoming European Parliament elections. In the post-election survey, core questions asked whether respondents’ voted in the election and which party they voted for. The online supplementary material contains the full questionnaires for each country and survey.
Several criteria had to be fulfilled to be included in the final analysis sample of this study. First, participants had to respond to both surveys and had to provide tracking data during the whole field period from at least one device. Out of 1636 participants originally selected in Germany, 11 broke off the pre-election survey, 14 of 1748 did so in France, and 22 of 968 in the United Kingdom. Four respondents in Germany broke off the post-election survey and one was screened out. In France, six did not complete the post-election survey and three did not complete it in the United Kingdom. Moreover, several participants did not provide tracking data during the whole field period and were therefore excluded from the final analysis sample. Overall, with these two restrictions, our final analysis sample consists of in Germany, in France, and in the United Kingdom for whom we observe both survey and web tracking data.
With these linked survey and web tracking data, we can tackle our main research objectives: obtaining interpretable measurements of users’ news media consumption from the tracking data and relating them to their responses to questions about political interest and voting behaviour measured in our two online surveys. For the latter objective, our aim is to explore whether political interest as indicated by the web browsing behaviour correlates with reported interest and voting behaviour. This step includes identifying content-based features that represent interest in political news and including them in regression models as outlined below. This approach allows us to assess the explanatory power of the extracted BERT features, compared to socio-demographic information derived from the survey data. Our modelling approaches are inspired by theoretical assumptions about the relationship between news media consumption and various political outcomes such as political interest and voting behaviour (Boulianne, 2020; Norris, 2001; Strömbäck & Shehata, 2010). Although our main goal is not to formally test these theories, we nonetheless use them to motivate our empirical demonstration. That is, we highlight the practical relevance of the news consumption features obtained from the web browsing data for political communication research and for future work on empirical tests of hypotheses derived from such theories. Methodologically, our analyses could also be interpreted as testing for criterion validity as we relate our obtained BERT-based measurements to more established, survey-based measurements of political interest and (reported) voting behaviour. Additional analyses are included in the online supplement, where we compare the predictive power of content-based features to features that are solely based on URLs and app names (i.e. category-based features and popular web pages/apps).
4 METHODS
4.1 Extracting news media content
We employ a three-step processing pipeline to extract content-based measurements of news media consumption from the records of web browsing activities. First, we scrape headlines of news articles that respondents read online during the tracking data collection field period but before the collection of the survey data (26 April–17 May). In addition, we scrape key words or tags that news platforms assigned to the articles on their websites (e.g. News, Employment, Bank of England, UK economy). We use these tags to fine-tune our BERT model. Second, we employ our fine-tuned BERT model to obtain numeric representations of the scraped news headlines. Third, we condense the numeric representations or text encodings into a manageable and interpretable set of features by using dimensionality reduction techniques. The processing pipeline and the corresponding design choices are outlined below, and summarized in Table 1. Code for implementing the outlined steps as well as for the following analyses is available at https://github.com/rubac/euro_news.
Design and modelling choices when extracting content-based features
| Step | Choices | Our approach |
|---|---|---|
| 1. Scrape websites |
|
|
| 2. Obtain embeddings |
|
|
| 3. Create features |
|
|
| Step | Choices | Our approach |
|---|---|---|
| 1. Scrape websites |
|
|
| 2. Obtain embeddings |
|
|
| 3. Create features |
|
|
In step 1, we gather headlines of news articles from 1347 websites visited by respondents of all three countries. The list is based on the ‘News and Media’ category provided by the Website Category API of Webshrinker (https://www.webshrinker.com), with some manual additions and deletions. For example, media sites which do not provide general news but rather specific information regarding, for example, weather, TV programs and gaming were taken out. Overall, selected websites mostly feature national and regional news outlets (e.g. https://www.theguardian.com or https://www.nottinghampost.com), TV and radio channels (e.g. https://www.bbc.co.uk and https://www.francetvinfo.fr) but also pure online news (e.g. https://www.huffingtonpost.co.uk) and news portals (https://www.yahoo.com) as well as a host of smaller sized news oriented blogs or websites. The list is agnostic between reliable and dubious information sources; our data includes websites which could be considered as ‘untrustworthy’ (Guess, Nyhan, Reifler, et al., 2020; e.g. https://www.sputniknews.com or https://www.les-crises.fr). Having defined our target websites, we filter out section pages with dynamic content and only keep article pages with static content. For example, we take out https://www.glasgowtimes.co.uk/news. The page content on this site is continuously updated and we cannot ensure that what is on the page at the time of scraping is what the respondent saw. Moreover, section pages contain multiple headlines and article summaries and we do not know which news were actually read by the respondent when she visited that page. We keep, for example, https://www.glasgowtimes.co.uk/news/17647010.tracey-wylde-glasgow-takeaway-owner-zhi-min-chen-jailed-life-1997-murder-woman as it points to static content (a news article). The code used for filtering out dynamic pages and for scraping the remaining pages is part of the GitHub repository accompanying this paper (https://github.com/rubac/euro_news).
For each relevant web page visited by at least one respondent during the period of interest, we scrape the headline as well as the tags associated with the news content, if available. As a result, a typical entry for our web tracking data regarding news consumption consists of a URL, for example, https://www.bbc.co.uk/news/business-48062920, a pseudonym for the respondent who visited that page, and the information that the corresponding headline was ‘Does the Bank of England have a woman problem?’, tagged by the BBC with ‘News’, ‘Employment’, ‘Bank of England’ and ‘UK economy’. To streamline the NLP tasks in the next steps, any non-English content is translated into English using the Google Cloud Translation API (see the online supplementary materials for details). Overall, we are left with news headlines (30,616 for France, 39,592 for Germany and 25,902 for the United Kingdom) as input for the next step.
The objective of step 2 is to transform the scraped news content into a format that is amenable to quantitative analysis. While various NLP methods have been proposed for extracting content from text data, the structure of our documents (short news headlines) poses problems for traditional topic modelling approaches such as LDA: poor performance is to be expected when documents are short even if many texts are available, for example, tweets and our headlines (Hong & Davison, 2010; Qiang et al., 2019; Tang et al., 2014). Moreover, LDA topic models, although popular in the social sciences, do not take into account word context which may result in topic mis-identification. Our main approach therefore focuses on obtaining word embeddings using pre-trained language models. Specifically, we use BERT, a state-of-the-art language model that has been shown to outperform various language representation models on different NLP benchmarking tasks (Devlin et al., 2018). BERT was trained on generic linguistic tasks (masked word and next sentence prediction) on a massive amount of data, including the English language Wikipedia. Given a sequence of words, it outputs contextually updated word embeddings, which, after some fine-tuning, can be used for further downstream tasks such as question answering, sentiment analysis, topic detection and logical evaluation. Space constraints and the complexity of the BERT deep bidirectional transformers architecture do not allow us to present the original BERT model in more detail. Instead, we focus on our fine-tuning procedure of the original BERT language model and the post-processing of the obtained embeddings. Readers unfamiliar with deep learning and neural networks are referred to the excellent introduction to the topic featured in James et al. (2021) and to the original BERT paper by Devlin et al. (2018) for details on the BERT model architecture.
In our application, we fine-tune the original BERT-Base, uncased 12-layer model from Devlin et al. (2018), available at https://github.com/google-research/bert, for topic detection. The goal in our case is to obtain compact sentence-level embeddings of headlines such that headlines dealing with similar topics are represented by similar vectors in a low-dimensional space. Briefly speaking, we fine-tune the pre-trained model by first feeding the scraped tag-headline pairs to the pre-trained BERT-Base model. We then reduce the resulting sentence-level embeddings of length 768 to vectors of length 50, which we then use to predict topics. For convenience, we use the tags that we scraped together with an article’s headline as the topics to be predicted. The fine-tuned BERT model is then applied to obtain compact sentence-level embeddings of each news article’s headline.
The detailed structure of our fine-tuning model is shown in Figure 1. For each layer, the type as well as the dimensions of the layer’s input and output are indicated. Dimensions are given as a pair of the form [(?, n)], where ? denotes an arbitrary batch size, that is, the number of training data samples that will be propagated through the model on every iteration. n is the length of the input or output vector. As an example ‘reductionlayer1’ is a dense layer which takes as input numeric vectors of length 768 and outputs shorter vectors of length 50.
![BERT-based language model for tag detection. [(?, n)] denotes the combination of an arbitrary number of inputs or outputs (batch size), denoted by ?, and the resulting length of the input or output vector, denoted by n. Input_1 denotes the headline of a news article and Input_2 the associated tag](https://oup.silverchair-cdn.com/oup/backfile/Content_public/Journal/jrsssa/185/Supplement_2/10.1111_rssa.12846/2/m_rssa_185_s2_s246_fig-1.jpeg?Expires=1750325350&Signature=1N4yCpkuqqafU9AHqWmg4f-R09OzdiE~8S7xNfGGOGA1rqUC-G7S4axnrqqOvyJ9rG~1Aiwaiej5uJ9LZ9h3fYRE4WUHmxS8jGiQJyqiHNZeeOv7L1N-HsaBf7hAQoEesfpnjRDyAH4B95GbopV65QraIYJOitLPRWodkJ8mxSpsrtlEzcgVfOegVR1Wnf6laB24TxTH8uvhgk4JoSzjExOKEn5D6F~vCQzpr049T~iOu5TYmeGZ1lk7nB~qyzj1g321TX-EYgOe7xSF1G~Ej6AcQqgRZawdXaiGong2bbbOkMMQnYnznAVUdlYQqxUxrP8UCDePSbljOnMksN9nSA__&Key-Pair-Id=APKAIE5G5CRDK6RD3PGA)
BERT-based language model for tag detection. [(?, n)] denotes the combination of an arbitrary number of inputs or outputs (batch size), denoted by ?, and the resulting length of the input or output vector, denoted by n. Input_1 denotes the headline of a news article and Input_2 the associated tag
In our tag detection task, the model receives two strings, one being the headline (Input_1) and the other one the associated tag (Input_1). The ultimate goal is to determine whether the tag fits the headline by producing a measure of similarity between the tag and the headline taking value in [0, 1]. Each string is given to the first input layer, which simply passes the string without further ado to the BERT language model. The BERT model layer consists of a full-blown BERT model with 109,482,240 parameters, namely bert_uncased_L-12_H-768_A-12 from Devlin et al. (2018). The BERT model yields vector embeddings of length 768, both for tag and headline. They are passed on to a densely connected layer of size 50 for dimension reduction. The next layer is a dropout layer, that is, similar to the idea of regularization in regression approaches, it randomly drops some nodes from the network to guard against overfitting. The last layer computes the cosine similarity between the two 50-dimensional vectors representing the headline and the associated tag. The model aims at a similarity value as close as possible to 0 if the tag does not match the headline and as close as possible to 1 if it does match. As a consequence, the 50-dimensional vectors that we get at the penultimate layer for headlines are designed to be cosine-similar to tag vectors if those tags belong to the headlines, and, by transitivity, to be cosine-similar to one another when they have similar tagging. This is the reason why our model produces vector representations for headlines such that closeness in the vector space reflects similarity in topics.
The data set for tag detection is built using negative sampling. We retain tags with at least 35 occurrences in our data set. For each tag, we randomly select 35 headlines labelled with that tag and 35*3 headlines which were not labelled with the tag. After some further cleaning, such as removing tags which are not words, over-lengthy headlines and duplicates, we end up with a data set consisting of 139,422 <title, tag> pairs with a 1/4–3/4 balance between positive and negative cases. Weights in the BERT layer are kept frozen except for the last two layers of the BERT model itself, which gives a total of 14,252,644 trainable parameters, 14,175,744 within the BERT model and 38,450 for each of the dense layers. 95,306,496 non-trainable parameters remain in the BERT model. Following the recommendations in Devlin et al. (2018), we stick to a low learning rate (2e-5), a low number of number of times the fitting algorithm passes through the training set (epochs = 5) and we use binary cross-entropy as the loss function. We achieve a 86.3% accuracy on test data. To complete step two (obtaining embeddings of the headlines), we compute the 50-dimensional headline vectors for all unique headlines in the time-restricted (26 April–17 May) tracking data using the fine-tuned model. Those vectors are henceforth referred to as the BERT encodings of the headlines. BERT tasks were conducted using Google Research’s Tensor Flow implementation of BERT and its Keras integration provided by Antyukov (2019).
In step 3, we utilize the BERT encodings to obtain a reduced set of content-based features on the respondent level. We implement two aggregation approaches for constructing features as shown in Figure 2. In the first approach, the clustering approach, we group all unique news headlines into clusters using K-means clustering and the normalized BERT encodings as clustering variables. To select the optimal number of clusters, we considered c = 2, …, 50 and selected the optimal number based on within cluster sums of squares. These clusters represent groups of articles with semantically similar headlines as reflected by the BERT encodings. To obtain the final feature set, we count the number of articles respondents read in each cluster and compute the browsing time respondents spent in each cluster relative to their total browsing time over all clusters, resulting in cluster-based features. Taken together, these features describe each respondent’s news diet.
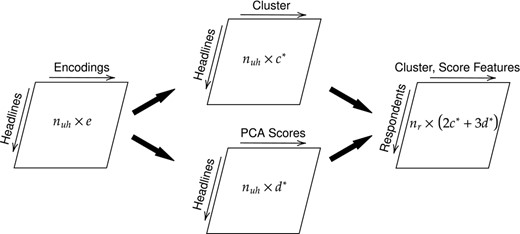
Extracting content-based features based on BERT encodings. The process starts with a data set with 47,278 headlines () and 50-dimensional BERT vectors (e), which are then aggregated into 26 cluster () and 6 PCA components (). Lastly, the cluster and components are used to obtain a total of 70 () BERT-based features on the respondent level ()
In approach 2, the PCA approach, we use the BERT encodings more directly. We first reduce the 50−dimensional BERT encodings of all unique headlines into components using principal component analysis (PCA). We considered d = 1, …, 50 and selected the sufficient number of components based on the eigenvalues and variance explained. We then use the component scores to obtain features on the respondent level by computing the mean, median and variance of these scores over all articles read by a given respondent, resulting in PCA-based features. These features map respondents’ news media diets onto six semantic dimensions, and represent their consumed news’ average scores as well as their variation within each dimension.
4.2 Modelling survey outcomes with news media measures
To explore whether consumed news content is associated with political interest and voting behaviour, we fit logistic regression models for each country and selected outcome variables derived from the survey data, which we report below. For details on the questions, see the online supplement material.
- •
Political interest (0 = low if respondent selected ‘Hardly interested’ or ‘Not at all interested’, 1 = high if respondents selected ‘Very interested’ or ‘Quite interested’)
- –
Based on pre-election survey
- –
- •
Undecided whom to vote for in the European Parliament elections (0 = decided, 1 = undecided)
- –
Based on pre-election survey
- –
- •
Voted in the European Parliament elections (0 = not voted, 1 = voted)
- –
Based on post-election survey
- –
- •
Changed mind whom to vote for in the European Parliament elections (0 = not changed, 1 = changed)
- –
Based on pre- and post-election survey
- –
We focus on selected BERT features that measure interest in political content as our predictors of main interest and include socio-demographic information as controls (sex, age, income, education, employment status, marital status, household size). For respondents without any BERT encodings, BERT features are set to zero, which is also the modal value of the cluster features of the non-missing cases. The number of respondents in each country with non-missing BERT information is included in Table 2.
Descriptive statistics. The UK Brexit, FR politics and GER elections cluster variables measure the number of articles respondents read in the respective cluster
| Min | Mean | Max | Obs. | |
|---|---|---|---|---|
| (a) Germany | ||||
| Political interest | 0 | 0.79 | 1 | 1038 |
| Undecided | 0 | 0.20 | 1 | 1038 |
| Voted | 0 | 0.86 | 1 | 1038 |
| Changed mind | 0 | 0.31 | 1 | 877 |
| UK Brexit cluster | 0 | 0.20 | 22 | 533 |
| FR politics cluster | 0 | 0.73 | 37 | 533 |
| GER elections cluster | 0 | 2.53 | 147 | 533 |
| UK Brexit versus FR crises (Median) | −4.51 | 0.16 | 2.88 | 533 |
| UK Brexit versus FR crises (Var) | 0 | 1.42 | 14.93 | 533 |
| Entertain versus GER elections (Median) | −2.96 | −0.17 | 12.44 | 533 |
| Entertain versus GER elections (Var) | 0 | 2.94 | 47.97 | 533 |
| (b) France | ||||
| Political interest | 0 | 0.52 | 1 | 1134 |
| Undecided | 0 | 0.38 | 1 | 1134 |
| Voted | 0 | 0.75 | 1 | 1134 |
| Changed mind | 0 | 0.47 | 1 | 820 |
| UK Brexit cluster | 0 | 0.17 | 43 | 632 |
| FR politics cluster | 0 | 2.53 | 65 | 632 |
| GER elections cluster | 0 | 0.23 | 13 | 632 |
| UK Brexit versus FR crises (Median) | −2.60 | 0.75 | 4.97 | 632 |
| UK Brexit versus FR crises (Var) | 0 | 2.88 | 21.07 | 632 |
| Entertain versus GER elections (Median) | −3.12 | −0.72 | 4.89 | 632 |
| Entertain versus GER elections (Var) | 0 | 1.53 | 43.02 | 632 |
| (c) UK | ||||
| Political interest | 0 | 0.62 | 1 | 619 |
| Undecided | 0 | 0.21 | 1 | 619 |
| Voted | 0 | 0.74 | 1 | 619 |
| Changed mind | 0 | 0.23 | 1 | 451 |
| UK Brexit cluster | 0 | 4.10 | 157 | 361 |
| FR politics cluster | 0 | 0.11 | 6 | 361 |
| GER elections cluster | 0 | 0.41 | 11 | 361 |
| UK Brexit versus FR crises (Median) | −5.97 | −1.34 | 2.65 | 361 |
| UK Brexit versus FR crises (Var) | 0 | 2.38 | 17.10 | 361 |
| Entertain versus GER elections (Median) | −3.16 | −0.37 | 7.93 | 361 |
| Entertain versus GER elections (Var) | 0 | 3.25 | 37.59 | 361 |
5 RESULTS
5.1 Content-based features
As the first step of our analysis, we identify those clusters and dimensions out of the full set of BERT features that represent political content. Both the cluster and PCA-based features can easily be interpreted by matching article headlines to the cluster centres and component scores. On this basis, we assign labels to clusters and components by scanning the top headlines closest to each cluster centre and the headlines with the most extreme component scores respectively.
We identify three clusters and two components that represent political content, with the corresponding top headlines shown in Tables 3 and 4. As indicated by the article headlines in Table 3, we have one cluster that predominately includes articles about the United Kingdom leaving the European Union and politics in the United Kingdom (Table 3a, UK Brexit cluster), one cluster with news about politics and political events in France (Table 3b, FR politics cluster) and one cluster with articles that deal with the European Elections and politics in Germany (Table 3c, GER elections cluster). Note that although our BERT model never had access to the source of the headlines (e.g. the domain extension such as .fr and .co.uk of the news article website), the obtained encodings can be used to group articles into meaningful clusters that intuitively match the underlying data generating process. Complementing the three clusters, Table 4a describes a PCA component that structures article headlines along a Brexit (negative scores) versus political-crises-in-France (positive scores) dimension. The second PCA component, shown in Table 4b, represents headlines along a entertainment (negative scores) versus European-Elections-from-a-German-perspective (positive scores) dimension. Summary statistics for the BERT features that are based on the outlined clusters and PCA components are presented in Table 2.
Article headlines closest to cluster centre (K-means)
| Title | Distance |
|---|---|
| (a) UK Brexit cluster | |
| Local elections 2019: May and Corbyn refuse to … | 0.194 |
| Brexit party in talks with May’s Tory donors as… | 0.195 |
| Don’t cave in to Labour on Brexit, Tories tell … | 0.196 |
| Nigel Farage confronted over claims Arron Banks… | 0.198 |
| Brexit news: Moment Andrew Neil refers to Chang… | 0.199 |
| (b) FR politics cluster | |
| Macron announcements: three months of construct… | 0.331 |
| May 1: the CGT denounces incredible repressio… | 0.332 |
| The France of the FN founders was not in London… | 0.333 |
| Civil service: 108,900 demonstrators in France … | 0.335 |
| Gilbert Petit-Jean, figure of the Franco-Swiss … | 0.335 |
| (c) GER elections cluster | |
| European elections survey: The GroKo threatens … | 0.269 |
| Far-right AfD party threatens poll rout in east… | 0.273 |
| SVP national assembly under the sign of Europe | 0.274 |
| Frustrated, confused: What Leave voters plan to… | 0.274 |
| Incidentally, this is the Donald Trump method… | 0.275 |
Article headlines with extreme component scores (PCA)
| Title | Score |
|---|---|
| (a) UK Brexit versus FR crises dimension | |
| Tory voter ID laws could ‘undermine right to vo… | −7.480 |
| Local elections: ‘Ukip’ and swastika graffiti d… | −7.469 |
| Tories braced for local election wipeout as mil… | −7.147 |
| Labour ‘trying to bail out’ Tories on Brexit | −7.127 |
| Local elections: resounding slap in the face fo… | −7.052 |
| … | … |
| Civil service: 108,900 demonstrators in France… | 6.862 |
| Republic of the Cloth | 6.989 |
| The French taxman loses the second round agains… | 7.011 |
| Besançon: flooding in the basements of the depa… | 7.056 |
| VIDEO. Demonstrations of May 1: In Montpellier, … | 7.128 |
| (b) Entertain versus GER elections dimension | |
| Game of Thrones season 8: The best and worst ca… | −4.162 |
| Jamie Foxx and Katie Holmes: Red Carpet debut a… | −4.162 |
| EastEnders spoilers: Who is Ben Mitchell’s myst… | −4.122 |
| Game of Thrones: Fans hate season 8 | −4.107 |
| When does pregnant Stacey Slater actress Lacey… | −4.017 |
| … | … |
| European elections 2019: 41 parties stand for e… | 13.264 |
| Wahl-O-Mat for the 2019 European elections: Cli… | 13.401 |
| Political barometer: Greens ahead of SPD in Eur… | 13.418 |
| European elections 2019: election programs of t… | 13.920 |
| European elections 2019: candidates, dates and… | 14.102 |
Having identified the content-based features of interest, we set out to compare whether the inferred interest in political content correlates with the reported political interest and voting behaviour as measured in the surveys. Table 5 shows the mean number of articles of the three political clusters that were read by survey respondents (with non-missing BERT information), structured by the four outcome variables and by country. On a high level, it becomes apparent that political interest as measured by the number of browsed articles with political content corresponds with the survey measures. Respondents who report high political interest in the surveys read on average more articles with headlines that represent political content as identified by the BERT features. This is especially true for news content that covers politics in their respective country (e.g. GER elections cluster in Germany). Similarly, having decided whom to vote for ahead of the European Elections, voting in the European Elections and consistent voting decisions (i.e. not changed mind between the pre- and post-election survey) are associated with higher numbers of political articles read, with few exceptions. In addition, comparing the means of each cluster overall between countries unsurprisingly shows more interest in Brexit related content in the United Kingdom (Table 5a), French politics in France (Table 5b) and EU Elections and German politics in Germany (Table 5c), further validating our clusters.
Means of selected BERT features by outcome variables. In the upper part of each subtable, the UK Brexit, FR Politics and GER elections cluster variables measure the number of articles respondents read in the respective cluster. In the lower part of each subtable, two variables for two PCA components are listed, which measure the median (Median) and the variance (Var) of the corresponding component scores
| Pol. interest | Undecided | Voted | Changed | |||||
|---|---|---|---|---|---|---|---|---|
| BERT-feature | Low | High | No | Yes | No | Yes | No | Yes |
| (a) Germany | ||||||||
| UK Brexit cluster | 0.08 | 0.23 | 0.24 | 0.05 | 0.08 | 0.22 | 0.28 | 0.08 |
| FR politics cluster | 0.60 | 0.76 | 0.79 | 0.43 | 1.20 | 0.66 | 0.73 | 0.48 |
| GER elections cluster | 0.82 | 2.93 | 2.82 | 1.10 | 0.76 | 2.82 | 3.33 | 1.58 |
| UK Brexit (−) versus FR crises (+) (Median) | 0.06 | 0.18 | 0.15 | 0.19 | 0.11 | 0.17 | 0.16 | 0.17 |
| UK Brexit (−) versus FR crises (+) (Var) | 1.79 | 1.34 | 1.42 | 1.44 | 1.68 | 1.39 | 1.43 | 1.28 |
| Entertain (−) versus GER elections (+) (Median) | −0.53 | −0.09 | −0.17 | −0.19 | −0.20 | −0.17 | −0.14 | −0.22 |
| Entertain (−) versus GER elections (+) (Var) | 1.60 | 3.25 | 3.15 | 1.91 | 1.76 | 3.13 | 3.51 | 2.22 |
| (b) France | ||||||||
| UK Brexit cluster | 0.12 | 0.20 | 0.22 | 0.05 | 0.07 | 0.20 | 0.31 | 0.06 |
| FR Politics cluster | 1.92 | 3.04 | 2.91 | 1.76 | 1.86 | 2.74 | 3.24 | 2.26 |
| GER Elections cluster | 0.19 | 0.26 | 0.27 | 0.14 | 0.19 | 0.24 | 0.30 | 0.18 |
| UK Brexit (−) versus FR crises (+) (Median) | 0.71 | 0.78 | 0.80 | 0.64 | 0.66 | 0.78 | 0.89 | 0.64 |
| UK Brexit (−) versus FR crises (+) (Var) | 2.79 | 2.95 | 2.82 | 2.99 | 2.48 | 3.00 | 2.95 | 3.14 |
| Entertain (−) versus GER elections (+) (Median) | −0.75 | −0.69 | −0.65 | −0.86 | −0.80 | −0.69 | −0.60 | −0.79 |
| Entertain (−) versus GER elections (+) (Var) | 1.54 | 1.52 | 1.70 | 1.19 | 1.57 | 1.52 | 1.57 | 1.51 |
| (c) UK | ||||||||
| UK Brexit cluster | 2.15 | 5.19 | 4.75 | 1.55 | 1.59 | 4.85 | 5.67 | 2.15 |
| FR Politics cluster | 0.12 | 0.11 | 0.12 | 0.07 | 0.07 | 0.12 | 0.12 | 0.13 |
| GER Elections cluster | 0.11 | 0.58 | 0.47 | 0.16 | 0.16 | 0.49 | 0.56 | 0.25 |
| UK Brexit (−) versus FR crises (+) (Median) | −1.39 | −1.31 | −1.34 | −1.35 | −1.20 | −1.38 | −1.36 | −1.52 |
| UK Brexit (−) versus FR crises (+) (Var) | 2.23 | 2.47 | 2.41 | 2.27 | 2.57 | 2.32 | 2.34 | 2.33 |
| Entertain (−) versus GER elections (+) (Median) | −0.61 | −0.24 | −0.29 | −0.71 | −0.46 | −0.35 | −0.29 | −0.55 |
| Entertain (−) versus GER elections (+) (Var) | 2.10 | 3.89 | 3.57 | 1.97 | 2.16 | 3.57 | 3.65 | 3.39 |
Unlike the clusters, the medians of the two PCA dimensions seem to correlate less strongly with the survey responses. The first row of the lower part of each sub-table reports the mean of the average leaning of articles read by respondents along the UK Brexit versus FR Crises dimension, with higher numbers indicating more exposure to content about political crises in France. The expected pattern predominately shows for respondents from France, with articles that were read by, for example, politically interested respondents leaning more towards the politics in France end of the scale (see Table 5b). We observe similar results for the Entertainment versus GER elections dimension in Germany, where more exposure to news about the European Elections and German politics coincides with higher political interest (Table 5a). The second and fourth row in the lower part of each sub-table shows the mean variation of browsed articles along the two PCA dimensions, with higher numbers indicating a more diverse news media diet. Notably, higher variation in consumed content along the Entertainment versus GER elections dimension matches with higher political interest, especially for respondents in Germany and the United Kingdom (Table 5a,c). In other words, German and UK respondents who report high interest in politics (and were not undecided whom to vote for ahead of the elections, reported to have voted and did not change their mind) tend to have more heterogeneous news diets than those with low interest in politics.
5.2 Regression models
Figure 3 presents estimates from logistic regressions predicting political outcomes from the survey data (political interest, undecided, voted, changed mind) with BERT features and socio-demographic controls, by country. Specifically, we include the relative browsing time respondents spent while reading political news about their respective country as the main features of interest, that is, the Brexit cluster for the UK models, the French Politics cluster for France and the Elections and German Politics cluster for Germany. We additionally include the median and variance of respondents’ scores on the PCA dimensions that match the respective countries. That is, features based on the UK Brexit versus FR crises dimension are included in the models for the United Kingdom and France, whereas corresponding features based on the Entertainment versus GER elections dimension are included in the models for Germany.
![Estimated coefficients (scaled) and 95% confidence intervals of content-based features in logistic regressions predicting political outcomes (including socio-demographic controls). The UK Brexit, FR Politics and GER Elections Cluster variables measure the relative browsing time respondents’ spent while reading political news in the respective cluster [Colour figure can be viewed at https://dbpia.nl.go.kr/]](https://oup.silverchair-cdn.com/oup/backfile/Content_public/Journal/jrsssa/185/Supplement_2/10.1111_rssa.12846/2/m_rssa_185_s2_s246_fig-3.jpeg?Expires=1750325350&Signature=arZTE--8TeXD5L~Ca4sFuYXbIJVp77iNuTM0OG9iJRcoP2kqI5jAdpF-YqqSLSz-1Ae9xj7~iyz1b3SNJd9BSw9Cu8FcWnjUYIojaeHCy-DIbz3D2dquvXXR8RPGqeE~jxRVEOQe9DJN2Jnd5wtk744lntqWyf2QaXko0Lr5CUcibyxfGu~NFzCsSXj~wM-hBrKVwmnx3oqd67eUTEI1zOrZHspi9scX-SqPWYZVGpBHzrTWlUMdmAOBNBpII-IIKYjJEJvZc~5oPmB3fPjIbldrjrYO2oqsj9Lik5nVd7xLYg-18COYwsPOWenKkKktQHxzoV9MtQwWLv~PhRFpYg__&Key-Pair-Id=APKAIE5G5CRDK6RD3PGA)
Estimated coefficients (scaled) and 95% confidence intervals of content-based features in logistic regressions predicting political outcomes (including socio-demographic controls). The UK Brexit, FR Politics and GER Elections Cluster variables measure the relative browsing time respondents’ spent while reading political news in the respective cluster [Colour figure can be viewed at https://dbpia.nl.go.kr/]
Figure 3a shows that for the United Kingdom, browsing news articles about Brexit is positively associated with political interest as reported in the surveys while controlling for socio-demographic background information (p = 0.003). However, no effect can be observed for the PCA-based features for the United Kingdom. Neither the browsing time for news about French politics nor the median score or variance along the UK Brexit versus FR crises dimension seem to have a substantial effect in the model for France. We, however, observe a positive effect of both PCA-based features in the model for Germany. In this case we observe a small positive effect of the median polarity of the consumed news, with browsing more news about the European Elections and German politics being positively associated with political interest (p = 0.028). The positive effect of the variance feature suggests higher political interest for respondents whose news diet varies more strongly along the Entertainment versus GER elections dimension (p = 0.017).
Turning to Figure 3b, the BERT features do not seem to explain the probability of being undecided whom to vote for ahead of the EU Elections in the United Kingdom, with two exceptions. For the United Kingdom, a negative effect of browsing Brexit content can be observed, indicating that longer browsing times in this cluster reduce the probability of being unsure about which party to vote for in the European Elections (p = 0.002). While the PCA-based features have no substantial effect in the models for the United Kingdom and France, we see that a higher variation in consumed news—that is, content that varies between entertainment and the European Elections—is negatively associated with being undecided whom to vote for in the model for Germany (p = 0.044). Similar to the results in Figure 3a, variation along this dimension does seem to indicate political interest and determination rather than disinterest for respondents in Germany.
Figure 3c shows that longer relative browsing time for the Brexit cluster in the United Kingdom increases the probability of voting in the European Elections (p = 0.029). This effect is accompanied by a negative association between the variance along the UK Brexit versus FR crises dimension and voting in the model for the United Kingdom (p = 0.052). For France, we observe a positive effect of a more diverse news diet along this dimension on voting (p = 0.030). The variation in consumed news on the entertainment versus GER elections scale is the only BERT-based feature with a notable (positive) effect on voting in Germany (p = 0.015).
Figure 3d shows the effects of BERT features on the last outcome variable, that is, whether respondents changed their mind about whom to vote for in the European Elections in between the pre- and post-election survey. We observe a negative effect of browsing content in the Brexit cluster in the UK model (p = 0.018) and of a news diet that leans towards French political crises on the UK Brexit versus FR crises scale (p = 0.057). The relative browsing time in the French politics cluster is positively related to the outcome in the model for France (p = 0.025). For Germany, a negative effect of the variance along the Entertainment versus GER elections dimension can be observed (p = 0.034). This effect generally mirrors the previous findings, with a more diverse news diet being associated with determined and consistent voting decisions in the German sample.
To complement the analysis, we further investigated the importance of the BERT features in explaining our political outcomes, relative to the socio-demographic predictors that are derived from the survey data. We do so by calculating importance scores of the top-10 features of each model, that is, for each outcome and country (the total number of predictors is 28 for Germany, 35 for France and 28 for the United Kingdom). Feature importance is measured by the absolute t-value of the regression coefficients, which are scaled to have a maximum value of 100. In 11 of the 12 models, at least one BERT feature is listed among the top-10 predictors. We also observe that the UK Brexit cluster is among the top-3 features in all models for the United Kingdom, highlighting that our approach can extract features that are competitive with crucial information such as education and income when explaining political outcomes, especially in countries that experience polarizing events. All feature importance results are shown in the online supplementary material.
6 DISCUSSION
Social scientists have been truly innovative in collecting and analysing new forms of digital trace data in recent years. Novel ways of capturing and combining survey records with participants’ online activities have sparked exceptionally creative work, especially in political communication research, that would have not been possible with respondents’ self-reported behaviours, preferences and attitudes alone. Extracting meaningful and interpretable measurements from fine-granular digital traces to exploit the full potentials of combined data is still a challenging task, however. Our review of studies working with combined survey and web browsing records indicated that, so far, many social science research projects, although innovative in their methodologies, only scratch the surface of what can be learned from web browsing records. Applied computer science studies using similar data sets dig deeper into the information hidden in the digital trace data. However, due to focusing on research objectives that favour prediction over explanation, the methods applied there cannot be directly used for social science projects that require explaining, understanding and interpreting social phenomena with interpretable measures. Therefore, we set out to exploit the potentials of digital trace data, specifically, web browsing data, using techniques rooted in computer science while focusing on deriving interpretable measurements in a low-dimensional space.
Using web browsing data collected from participants in three European countries, we demonstrated how modern NLP methods allow us to analyse, summarize, and extract meaningful measurements of individuals’ news consumption on the web. Our findings show that BERT, paired with dimensionality reduction techniques, is a particularly useful approach for such tasks as BERT accounts for context and can be fine-tuned for a variety of purposes. The results obtained demonstrate that our approach is useful for identifying specific content such as political content out of the huge variation of news articles read by participants. In this context, we identified clusters of news articles based on their headlines only. Clusters include, for example, articles about the UK leaving the European Union and French politics. In addition to clustering, we applied a PCA dimensionality reduction approach to derive a few features that describe respondents’ news diets and the heterogeneity of their diets. Both approaches are not only helpful for analysing and understanding news content per se, but also for summarizing it in variables that can be used for further analysis. We ran a series of regression models that used these measurements of respondents’ news diets to explain political interest and voting behaviour as measured by the surveys. Backing up previous findings on the associations between news media use and political outcomes (see, e.g. Boulianne, 2020, for a review), the results largely indicated that inferred interest in politics based on browsed content is associated with reported interest and voting behaviour, although with varying degrees for different outcome variables and countries.
The main advantage of our approach is that the powerful pre-trained language representation model, fine-tuned with content tags assigned to news articles by the news platforms themselves, allows us to sidestep tedious manual coding of news articles. Moreover, due to the context awareness of the word embeddings, the model used here is much better suited for tasks such as identifying polarity of news articles than the simple bag-of-words approaches underlying the classification algorithms used in previous political communication studies. In addition, BERT embeddings are versatile and may be used to detect all kinds of syntactic or semantic features. In this paper, we fine-tuned BERT for topic detection such that the resulting features (clusters and PCA dimensions) represent the kind of topics respondents read about. However, one may also include other semantic features such as polarity. These could be represented by a similar strategy but implemented with a different fine-tuning process. For example, one could fine-tune for mood detection to separate negative from positive headlines using standard sentiment analysis data sets or fine-tune with respect to political leanings and polarity using information about outlet audience. In short, BERT is a versatile language representation model that can be employed for many different NLP tasks in social science and especially political communication research.
However, there are also several limitations to our study. First of all, using a long processing pipeline with a myriad of design and modelling decisions creates many researcher degrees of freedom, that is, many instances where we could have decided differently (see also Table 1). For example, our ultimate objective was to analyse and summarize news media consumption and capture its content by a few interpretable measures that can be used in explanatory modelling frameworks. Necessarily, reducing the dimensions of the data is accompanied by loss of information. That is, there is a clear trade-off between the ability to describe news consumption with a few variables and the level of information loss one is willing to accept. Here, the number of features was determined by a data-driven approach. As a result, we obtained only a few clusters and dimensions that identify news with a strong political component. If one was interested in understanding political news on a more granular level, one may opt for a larger number of clusters or analyse those identified as political news separately. Testing additional model specifications is an avenue for future research.
Second, we restricted the analysis to article headlines. Although we were still able to describe respondents’ news diets very well, future research should consider full news article texts, especially if the goal is to obtain information about political leanings, polarization and opinions which may not be detectable from article headlines alone.
Third, using automated translation of foreign-language content to one reference language, English, introduces additional room for error and uncertainty into our analyses. We are convinced that the benefits of scaling our analyses to international settings outweigh potential uncertainties and errors resulting from potentially imprecise automated translations. Yet, such consideration may also depend on the research objective. If the goal was to mine argumentation patterns, for example, one may need to weigh the costs and benefits of automated translation differently. Moreover, future research could also opt for an approach where multi-lingual BERT implementations are used instead of translating content to one reference language first. Likewise, future research may find better ways than manual identification of source language to tackle the issue of foreign language news outlets.
Fourth, as we noted in the introduction and in the background section, the question of how to mine web browsing data to enrich survey data addresses only one of the challenges when working with combined survey and web browsing data. Far more questions beyond the mere extraction of information from the web browsing records arise. Most importantly, obtaining such data in settings beyond for-profit online access panels and ensuring that all relevant information is observed are two challenges that have not been fully tackled yet. However, as more and more researchers discover the potentials of enriching traditional data sources with new forms of data from digital sources, so do calls for establishing such data practices in high-quality academic data products become louder (Kohne et al., 2021). We encourage future research to exploit the full potentials of digital trace data focusing on all of these aspects.
DATA AVAILABILITY STATEMENT
Due to the sensitive nature of the data, we cannot make them publicly available but researchers interested in using our data may contact the first author of this paper for an individual data use agreement. All code is available through the following repository: https://github.com/rubac/euro_news. There, an example data set of news media consumption is available.
Supporting Information
Additional supporting information may be found in the online version of the article at the publisher’s website.
ACKNOWLEDGEMENTS
The authors would like to thank the editors of the special issue, the anonymous reviewers and the members of the joint FK2RG research laboratory at the University of Mannheim/University of Munich for providing helpful comments on earlier drafts of this paper.
REFERENCES
Author notes
Funding informationRuben Bach gratefully acknowledges financial support of this research project by the Eliteprogramme for Postdocs of the Baden-Württemberg Foundation. Ruben Bach’s work was funded by the German Research Foundation (DFG)-Project-ID,139943784-SFB-884.
