


Abstract
Research apps allow to administer survey questions and passively collect smartphone data, thus providing rich information on individual and social behaviours. Agreeing to this novel form of data collection requires multiple consent steps, and little is known about the effect of non-participation. We invited 4,293 Android smartphone owners from the German Panel Study Labour Market and Social Security (PASS) to download the IAB-SMART app. The app collected data over six months through (a) short in-app surveys and (b) five passive mobile data collection functions. The rich information on PASS members from previous survey waves allows us to compare participants and non-participants in the IAB-SMART study at the individual stages of the participation process and across the different types of data collected. We find that 14.5 percent of the invited smartphone users installed the app, between 12.2 and 13.4 percent provided the different types of passively collected data, and 10.8 percent provided all types of data at least once. Likelihood to participate was smaller among women, decreased with age and increased with educational attainment, German citizenship, and PASS tenure. We find non-participation bias in substantive variables, including overestimation of social media usage and social network size and underestimation of non-working status.
1 INTRODUCTION
Smartphone usage continues to increase around the world (Taylor & Silver, 2019). Two features of smartphones make them especially interesting as data collection devices (Harari et al., 2016; Link et al., 2014; Onnela, 2021; Raento et al., 2009): (a) many users carry their phones around with them throughout the day allowing for in situ survey data collection; (b) the technological capabilities of smartphones offer an entirely new way of collecting a variety of data from individuals in the background. For the latter, the terms ‘passive mobile data collection’ (Keusch & Conrad, 2021), ‘mobile sensing’ (Harari et al., 2015), and ‘digital phenotyping’ (Torous et al., 2016) have been used in different strands of the literature. Combining self-reports and passive data collection using built-in sensors (e.g. GPS, accelerometer) and log files automatically recorded by the device’s operating system (e.g. no. of calls and text messages, Internet browsing, app usage) has been used to study, among others, mobility patterns (Elevelt et al., 2019; Lynch et al., 2019; Scherpenzeel, 2017), the influence of physical surroundings and activity on psychological well-being and health (Goodspeed et al., 2018; Lathia et al., 2017; MacKerron & Mourato, 2013; York Cornwell & Cagney, 2017), student well-being over the course of an academic term (Ben-Zeev et al., 2015; Harari et al., 2017; Wang et al., 2014), integration efforts of refugees (Keusch, Leonard, et al., 2019), and job search of men recently released from prison (Sugie, 2018; Sugie & Lens, 2017).
To collect both self-reports and sensor data from smartphones requires users to download a designated research app that administers survey questions to participants and provides access to different sensors and log files on the phone. Depending on the scope of the study, participants will need to go through multiple steps of consenting to the different data collection features of the research app (e.g. self-reports, sensor data, log files) making the classic view of survey non-response as a binary outcome no longer sufficient (Couper, 2019). This also has an effect on the calculation of participation rates, which can be much more complex compared to what is reported in traditional surveys (see AAPOR (2016) Standard Definitions for calculation and reporting of outcome rates in surveys). While some individuals might be unwilling to participate in such a study altogether, others might consent to all types of data collection involved. Again other individuals could be selective in their participation decision agreeing to some but not all features of data collection. If the participants in such studies differ from the invited sample in the variable(s) of interest, then bias arises (Groves et al., 2009). For example, if, in a study that collects measures on employment and poverty via smartphones, groups who are more likely to suffer from unemployment and poverty are less willing to participate, then the data collected from this study and the policy decisions made based on the data would be biased. Differential non-participation within a study that collects multiple types of data from the same participants might thus make it necessary to consider non-participation bias individually for each type of data collection.
Against this background, we investigate non-participation in the IAB-SMART study that combined self-reports with passive data collection on smartphones (Kreuter et al., 2020). We invited German-speaking Android smartphone owners in the Panel Study Labour Market and Social Security (PASS), an annual German mixed-mode study on the labour market and poverty (Trappmann et al., 2019), to download a research app. The app collected data over six months through short surveys administered in the app and passive mobile measurement using different groups of sensors and log files on the smartphone. We take advantage of the rich auxiliary information on PASS members from previous waves of the panel to extend the small but growing literature on smartphone data collection in three directions. First, we study non-participation at the different stages of the participation process and for the different types of data collected as part of the IAB-SMART study. Doing so allows us to better understand the phenomenon of non-participation in complex smartphone studies. Second, we identify the correlates of study participation. With this analysis we contribute to the understanding of why people decide to participate in smartphone studies that conduct both surveys and passive data collection on the same device. Third, we estimate non-participation bias for substantive PASS measures on self-reported social embeddedness, personality, employment and social media usage that could be measured with smartphone sensors. Doing so allows us to directly measure the effect of differential non-participation when using a research app for data collection on the variables of interest in such a study.
In the next section of this paper, we review the existing literature on non-participation in smartphone data collection. We then present the design of the IAB-SMART study and how we analyse the data to answer our research questions. We report the findings of our study and discuss their implications for data collection practice and future research.
2 BACKGROUND
While smartphones are increasingly used by respondents to complete web surveys (Couper et al., 2017), the administration of surveys and passive data collection on smartphones in the same study is still in its infancy, especially in general population surveys. In this section, we review the existing literature on smartphone data collection along three methodological dimensions, in line with our three research questions: (a) participation rates, (b) correlates of non-participation, and (c) non-participation bias.
2.1 Participation rates in studies administering surveys and passively collecting data on smartphones
Most studies that collect smartphone data via a research app have recruited volunteers from non-probability samples (Beierle et al., 2020; Ben-Zeev et al., 2015; Eckman, Chew, et al., 2020; Goodspeed et al., 2018; Harari et al., 2017; Lathia et al., 2017; MacKerron & Mourato, 2013; Wang et al., 2014; York Cornwell & Cagney, 2017) making the analysis of participation behaviour impossible. Only a few studies have implemented passive smartphone data collection with research apps in probability samples. For example, the Smartphone Time Use Study administered survey questions and passively collected data (GPS, log files) on two days from members of the LISS panel, a large-scale probability panel representing the Dutch national population (Scherpenzeel, 2017). Out of more than 7,000 invited LISS panel members, 75 percent completed the invitation questionnaire.Thirty-seven percent of them indicated their willingness to participate, and 68 percent of the willing panelists actually participated for an overall participation rate of 19 percent.
Struminskaya et al. (2021) asked smartphone users in the general Dutch population who previously had participated in at least one of Statistics Netherlands’ surveys to share their current GPS location once. Sixty-seven percent of the survey respondents said they were willing to do so, and 69 percent of those who reported willingness actually did share the data in a subsequent step, for an overall participation rate of 46 percent.
The Newark Smartphone Reentry Project invited randomly selected men recently released from prison to participate in a study about job search and employment experiences of parolees (Sugie, 2018). A research app pre-installed on the provided smartphones collected geolocation estimates and encrypted phone numbers as well as characteristics of calls and texts. In addition, the app administered daily questions on emotional well-being, job search, work, and social interactions. Out of the 152 eligible individuals, 141 (93% of 152) agreed to participate, and 135 (89% of 152) completed the initial interview, received the smartphone, and sent data. By the end of the 12-week field period, 63 percent of eligible individuals were still in the study.
The diverse participation rates in the described studies could be driven by various factors. For example, compared to the other studies, the relatively high participation rate reported in Sugie (2018) might be explained by the specific target population—parolees recently released from prison—who might be more acquiescent as well as the fact that participants received an Android smartphone, which they could keep after the study, and plans with unlimited call, text, and data for the duration of the data collection. Struminskaya et al. (2021) asked the survey participants to share their geoposition only once, which might be perceived as less intrusive than continuous collection of GPS data. For a study like the one described in this paper that does not provide a smartphone and data plan as incentives and that continuously collects different types of data over a longer period, we expect to find a lower participation rate.
In addition, what type of data is collected in a study appears to be a factor. For example, Elevelt et al. (2019) found in the Dutch Smartphone Time Use Study higher participation rates for the self-reported part of the study compared to the passive data collection. This finding is further supported by several studies finding significantly lower stated willingness to participate in passive tracking (e.g. GPS, app usage logs) compared to actively completing tasks on the smartphone (e.g. taking photos, completing online questionnaires, scanning barcodes) (Revilla et al., 2016, 2019; Wenz et al., 2019). We thus expect that the participation rate for the different components of a smartphone study will differ by type of data that is collected. In particular, we hypothesize that participation in self-reports through a smartphone research app will be higher than participation in passive measurement.
2.2 Reasons for non-participation
There are different reasons why people might not participate in smartphone data collection (Jäckle et al., 2019). First, access to a smartphone is required, thus creating a problem of coverage: while some of the sociodemographic differences between owners and non-owners of smartphones seem to have decreased over time (Baier et al., 2018; Fuchs & Busse, 2009; Metzler & Fuchs, 2014; Taylor & Silver, 2019), smartphone owners are younger and more affluent than non-owners and also differ on substantive variables (Antoun et al., 2019; Couper et al., 2018; Jäckle et al., 2019; Keusch et al., 2020).
Second, even if smartphone penetration were universal, some smartphone users might be more likely than others to participate in research on their mobile device. For example, when randomly assigning smartphone owners to participate in a web survey on their phone or a PC, smartphone respondents are shown to be younger (de Bruijne & Wijnant, 2014; Mavletova, 2013; Wells et al., 2014), more likely to be female (de Bruijne & Wijnant, 2014; Keusch & Yan, 2017; Tourangeau et al., 2017; Wells et al., 2014), have higher educational attainment (Keusch & Yan, 2017), are heavier mobile web users (Mavletova, 2013; Mavletova & Couper, 2016), and rely primarily on smartphones to access the Internet (Wells et al., 2014).
Recently, several studies have investigated the correlates of willingness to allow passive data collection on smartphones, both hypothetical and actual. Studying hypothetical willingness, Di Matteo et al. (2018) asked patients whether they would be willing to download an app to their smartphone that allowed researchers to track their mental health through, among others, GPS, accelerometer, SMS, and the microphone. They found that willingness to share audio data via the smartphone’s microphone was positively correlated with age.
Wenz et al. (2019) asked members of the UK Understanding Society Innovation Panel whether they would be willing to engage in a number of different research-related tasks on their smartphone. Older individuals and people with higher educational attainment reported significantly higher willingness to download an app that would collect data about how they use their smartphone, but age and educational attainment played no role in the willingness to share GPS location or activity data. In addition, respondents who reported a higher number of different activities on their smartphone and those who reported fewer security concerns when using the smartphone for data collection were significantly more likely to be willing to share data on smartphone usage, geolocation, and physical activity.
Another study of hypothetical willingness asked members of a Spanish opt-in online panel about their willingness to do 20 research-related tasks that went beyond answering survey questions (Revilla et al., 2019). Men, respondents who posted more frequently on Facebook, respondents with higher trust in their anonymity, those who liked answering surveys, and those who had responded to more surveys in the online panel showed significantly higher levels of willingness to engage in different types of passive behaviour tracking (e.g. sharing mobile GPS data, Internet browsing information, and Facebook data).
Keusch, Struminskaya, et al. (2019) asked German smartphone users about their hypothetical willingness to download an app that would collect technical characteristics of the phone, telephone network information, current location, app and Internet usage, and call and text logs. Male smartphone users, users with lower security and privacy concerns, users with higher trust in researchers, and users who reported more different smartphone activities also reported a significantly higher willingness to download such an app.
Struminskaya et al. (2020) asked members of a Dutch probability-based online panel (LISS) about their willingness to use their smartphone to share their current geolocation, to take a photo of their house, to take a video of their surroundings, and to take a photo of themselves. They found that willingness significantly differed by the type of data requested. In addition, older users, users who more frequently engaged in certain smartphone activities (e.g. taking pictures, using geolocation features), those with lower general privacy concerns, and those who believed a questionnaire guarantees anonymity were more likely to be willing to share data via the smartphone.
So far, only few studies have identified correlates of actual participation behaviour in smartphone data collection involving research apps. Elevelt et al. (2019) found that younger and higher educated people and those who had previously participated in surveys were significantly more likely to complete the diary and pop-up surveys in the LISS Smartphone Time Use Survey app. The propensity to share GPS locations on the smartphone was significantly higher for people who used their own smartphones and for those who had completed the diary and the pop-up surveys. Keusch, Leonard, et al. (2019) report that in a smartphone study among refugees in Germany, individuals with higher educational attainment and with higher reading proficiency as well as those who reported regularly using the Internet on their smartphone were significantly more likely to participate in mobile web surveys as part of the study. Refugees with low reading proficiency were also significantly less likely to download an app that passively collected data from participants’ smartphones. Jäckle et al. (2019) found that women and younger age groups were significantly more likely to participate in an app-based UK spending study, which asked people to take pictures of their shopping receipts, than men and older age groups. Beierle et al. (2020) reported a relationship between the number of permissions volunteers who had downloaded a research app granted with gender and age; women and younger participants were more likely to give no permission at all and less likely to provide all permissions.
Based on this earlier research, there appear to be three groups of individual characteristics that correlate with the willingness to provide self-reports and share passively collected data on smartphones with researchers: (a) sociodemographic characteristics, (b) attitudes on privacy, security, and trust, and (c) behaviour related to Internet and smartphone use. The data used in our study allows us to test for differences in sociodemographics and trust in the research organization. Based on earlier findings, we anticipate that users with higher educational attainment and those who show higher trust are more likely to participate in smartphone data collection via self-reports and passive measurements.
2.3 Non-participation bias in smartphone data collection
Regardless of the reason for non-participation, if participants and non-participants in a study using a research app differ in the variable of interest that could be measured using the data collected through the app, then bias will arise (Groves et al., 2009). Given the novelty of the data collection approach and the fact that auxiliary information from both participants and non-participants is needed to study non-participation bias, it is not surprising that we know relatively little about the effect of non-participation on substantive measures of interest in smartphone studies. For a mobile web survey in the Dutch LISS panel, Antoun et al. (2019) reported significant but relatively small (<3 percentage points) non-response bias in two out of 19 substantive variables on technology, lifestyle, and politics. Elevelt et al. (2019) found in the Dutch Smartphone Time Use Study that people who participated in all parts of the study (i.e. pre-questionnaire, diary, pop-up surveys, and GPS tracking) had reported spending significantly more time working and less time watching television than people who were not willing to participate.
Given that earlier studies find non-participation bias in various substantive measures of interest, we explore whether similar effects exist in a study conducting surveys and passive data collection on smartphones about employment and social embeddedness.
3 METHODS AND DATA
To answer our research questions, we use data from the IAB-SMART study (Kreuter et al., 2020), an app-based data collection effort among Android smartphone owners recruited from the Panel Study Labour Market and Social Security (PASS) in Germany.
3.1 Panel study labour market and social security (PASS)
PASS is an annual, probability-based household panel survey of the German residential population aged 15 and older conducted by the Institute for Employment Research (IAB) (Trappmann et al., 2019). The primary goal of PASS is to provide a data source for research on the labour market, poverty, and the welfare state in Germany. A dual sampling frame (population registers and welfare benefit recipient registers) is used to oversample welfare benefit recipients. The data collection mode of PASS is a sequential mixed-mode combination of computer-aided personal and telephone interviews. Extensive non-response studies show rather small biases for a range of PASS variables, for example, benefit receipt, employment status, income, age, and disability (Kreuter et al., 2010; Levenstein, 2010; Sakshaug & Kreuter, 2012; Trappmann et al., 2015).
3.2 IAB-SMART
The goal of the IAB-SMART study is to extend the traditional PASS survey effort measuring effects of long-term unemployment on social integration and re-integration into the labour market using a new data collection approach, namely a smartphone app that collects both self-reports via mobile surveys and passive measurement using sensors and log files. In January 2018, a random sample of 4,293 German-speaking PASS respondents aged 18 to 64 who had reported owning an Android smartphone in Wave 11 (2017) was invited via mail to participate in the IAB-SMART study. We restricted the study to Android devices because extensive passive data collection is limited under Apple iOS (Harari et al., 2016), and other operating systems had too low of a market share to justify additional programming effort. To participate in the study, smartphone owners needed to visit the Google Play store, install the IAB-SMART app on their phone, and decide if they want to activate several data collection functions. The downloading of the app included a multi-step consent process that was designed to make all data collection through the app GDPR-compliant. Data collection procedures and consent process were developed in close cooperation with and approved by the legal counsel of the German Federal Employment Agency, IAB’s parent organization (see Kreuter et al. (2020) for a detailed description). The field period of the study was six months.
Participants received incentives in the form of points for downloading the app, allowing passive data collection, and responding to survey questions in the app. The points could be redeemed for Amazon.de vouchers directly in the app. The study design included an incentive experiment with four groups. Invited sample members either received a 10- or a 20-Euro incentive for downloading and installing the app. Within these two groups, sample members were further assigned to either receive one Euro per passive data collection function per month (i.e. a maximum of five Euros per month; ‘no bonus’ group) or one Euro per data collection function plus a five-Euro bonus if they provided all five types of passively collected data in a month (i.e. a maximum of 10 Euros per month; ‘bonus’ group). Depending on the experimental group, participants could gain a maximum amount of between 60 and 100 Euros worth of points throughout the field period. Details about the experiment are reported in Haas et al. (2021).
Once installed on a smartphone and after the participant had consented to data collection, the IAB-SMART app could collect data in two ways: (a) through short surveys (up to ten questions at a time) administered by the app at predefined times and when a participant’s phone entered and left a predefined geolocation (geofencing; Haas et al., 2020) and (b) through passive data collection using sensors and log files on the smartphone. Five different passive data collection functions were available in the app, and participants could consent individually to any or all of them and revoke consent at any point during the field period:
- 1.
Mobile phone network quality and location information were collected every 30 min together with information on network providers and network technology.
- 2.
Paradata of participants’ incoming and outgoing calls and text messages (i.e. time stamps and hashed numbers, not the content of text messages or phone calls) were logged.
- 3.
Information on characteristics of the social network were collected by matching the first name of each contact stored in the device’s phone book with information from the website Genderize (https://genderize.io) to identify likely gender and first and last names with information from the website NamePrism (http://www.name-prism.com; see Ye et al. (2017)) to identify likely nationality. Only the ping results were saved and transmitted as classification probabilities for gender and nationality together with the hashed names.
- 4.
Activity data came from built-in sensors (accelerometer and pedometer) and are used to create measures of means of transportation (e.g. walking, biking, in a motorized vehicle) and periods of activity every two minutes.
- 5.
Smartphone usage information on which apps are installed on the participant’s smartphone and the frequency of their usage were collected as well. No information was collected on what is done within an opened app.
3.3 Analysis plan
To answer our first research question on what proportion of invited smartphone owners are willing to participate in the different parts of the smartphone study, we identify multiple participation patterns depending on the extent of compliance with our study protocol:
- 1.
Verified Installers are all invited sample members who downloaded the IAB-SMART app from the app store, went through the installation process, completed the short welcome survey in the app, and could be verified as eligible PASS Wave 11 participants.
- 2.
Function Participants are all Verified Installers who provided data at least once in a given data collection function of the research app. There are six groups of participants, one for each of the five passive data collection functions (Network and Location Participants, Call and Text Message Log Participants, Social Network Participants, Activity Participants, Smartphone Usage Participants) and one for the in-app surveys (In-app Survey Participants).
- 3.
Full Participants are all Function Participants who provided data at least once in all of the five functions and answered at least one question in an in-app survey.
Note that the definition of these participation pattern groups is increasingly restrictive, and the groups become smaller with each stage, that is, all participants in later groups are also included in earlier groups.
To assess whether participation patterns correlate with characteristics of the invited smartphone owners, we explain non-participation in the three stages described above using a set of covariates from our initial sample of 4,293 invited PASS members. To do so, we specify multivariate logistic regression models with participation in a given stage (0 = non-participation, 1 = participation) as the dependent variable. Based on findings of earlier research on correlates of non-participation in smartphone studies, we include two sets of covariates measured in earlier waves of PASS as predictors into our models. The first set of covariates comprises sociodemographic characteristics (i.e. gender, age, educational attainment, nationality, region, community size, marital status, household size, presence of own children in the household, household income, employment status, and welfare receipt). Second, we include panel tenure with the PASS and whether the participants had given consent to data linkage of PASS survey data with administrative records of the Federal Employment Agency as part of the panel as a proxy for trust in the research organization. While earlier studies had found that Internet and smartphone usage behaviour correlates with the willingness to participate in smartphone studies as well, we do not have such variables available from PASS. In addition, we included a variable for the incentive experiment. Table A1 in the Online Supplementary Materials presents the variables used in this analysis and how they were operationalized.
Finally, we investigate non-participation bias for five substantive measures that were self-reported in PASS. The selected measures could be enhanced using the passively collected data from the IAB-SMART study. As part of the annual PASS survey, respondents were asked to report (1) the size of their personal network and (2) their degree of social inclusion. Social inclusion was measured on a 10-point end-labelled scale ranging from 1 = ‘excluded’ to 10 = ‘included’. We use the following categories for our analysis: ‘low’ = 1–3, ‘medium’ = 4–7, ‘high’ = 8–10. The questions on social embeddedness could be complemented with the passively collected call and text message log file data and the number of contacts in the address book in the future. We also study the effect of non-participation on psychographic variables, specifically (3) the Big Five personality traits (McCrae & John, 1992). The German version of the 21-item Big Five Inventory (BFI-K) (Rammstedt & John, 2005) was implemented in Wave 5 of the PASS study. For the analysis, we created tertiles of each factor, that is, ‘low’, ‘medium’, and ‘high’. Recent studies have found that personality traits can be predicted using log file data of smartphone usage (Chittaranjan et al., 2013; de Montjoye et al., 2013; Stachl et al., 2017, 2020; Xu et al., 2016). Next, we study non-participation bias in the labour market variable (4) working hours. In the future, participants’ working hours could be inferred from geolocation data for people who usually work at the same location. Finally, we estimate non-participation bias in (5) social media usage. The question on social media network usage was last asked in Wave 8 of the PASS. The following social media networks were included in the question: Facebook, StudiVZ, MeinVZ, Xing, Twitter, LinkedIn, Lokalisten, Wer-kennt-wen, MySpace, Google Plus, other. From the smartphone usage data collected as part of IAB-SMART, we could directly measure how many social media apps participants use.
We estimate these substantive PASS survey outcomes based on the full sample of all invited PASS Android smartphone owners (f) and compare them to the estimates that come from the participants (p) in the individual stages of the IAB-SMART study. By comparing the estimates from survey questions that could also be measured using smartphone sensors across the different participation groups, we can assess how large the bias in these measures would be if passive measurement were used. To determine the magnitude of non-participation bias in the substantive PASS variables, we calculate the difference between the two as
Next, we calculate the standard error of the estimated bias following the formula used by Lee (2006) as
As a robustness check, we also calculate standard errors for non-participation bias using the replication method described in Eckman, Unangst, et al. (2020). Since the results do not substantially differ from the original analysis, we only present these results here.
To test the significance of a given bias, we use a z-test. To calculate a test statistic, we divide the estimate of the difference by the standard error of the difference.
We use Stata 15.1 for all our analyses, and we apply case-wise deletion for multivariate models. PASS’s design uses a geographically clustered and stratified sample based on primary sampling units (Trappmann, 2013). To account for this complex design in our analyses (Eckman & West, 2016), we correct our estimates by acknowledging clusters, stratification characteristics, and finite population corrections for sampling without replacement using Stata’s survey-set command (svyset psu, strata(strpsu)).
4 RESULTS
4.1 Participation rates in the different parts of the study
Figure 1 presents the different participant groups in the IAB-SMART study. Out of the 4,293 PASS Wave 11 respondents who had reported owning an Android smartphone and were randomly assigned to receive an invitation for the IAB-SMART study, 685 installed the app and entered a valid registration code (16.0% of the invited sample). Five of them did not respond to the welcome survey in the app nor did they provide any other type of data, and for another 57, the age or gender provided as part of the welcome survey did not match the PASS records. In the latter cases, the IAB-SMART app might have collected data during the field period, but the person providing the data was not the invited PASS member but someone else in the household or a third person who potentially received the invitation and verification code from the invited person. Since we cannot link the data from these cases with existing PASS data, we would drop these cases from any substantive analysis and count them as non-participants. This leaves us with 623 Verified Installers, 14.5 percent of our invited sample.
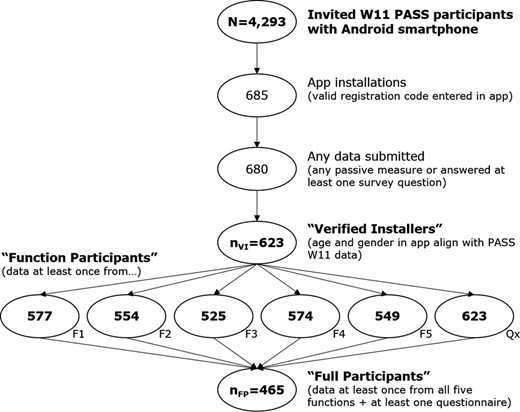
Flowchart of participation behaviour in the IAB-SMART study (Note: F1 = Network and location; F2 = Call and text message logs; F3 = Social network; F4 = Activity; F5 = Smartphone usage; Qx = In-app surveys)
The number of Function Participants who provided data at least once varies across the five passive data collection functions. While 577 participants or 13.4 percent of the invited sample provided information on network quality and location (F1), only 525 participants (12.2%) provided data about the characteristics of their social network (F3) at least once. Per definition, all Verified Installers are also Function Participants for the in-app surveys (Qx).
Finally, 465 individuals are Full Participants: they provided data at least once in all of the five functions and answered at least one question of the in-app surveys. This is 10.8 percent of the sample invited to participate in the IAB-SMART study.
4.2 Correlates of participation
Figure 2 show the average marginal effects (AMEs) from multivariate logistic regression models predicting participation in the IAB-SMART study based on sociodemographic characteristics of the invited PASS members, variables describing their relationship with the IAB as the research organization conducting the study, and the experimental incentive groups (detailed results for all models can be found in Table A2 in the Online Supplementary Materials). Of the sociodemographic variables used in our models, gender, age, education, nationality and region have a consistently significant effect on study participation. Women are two percentage points less likely than men to install the IAB-SMART app, to consent to network and location data collection, and to answer to in-app surveys. There is a negative relationship between age and IAB-SMART participation with the three oldest age groups (50 to 54 years, 55 to 59 years, 60–64 years) being significantly less likely to participate than the reference group (15–19 years). PASS members in the three oldest age groups are 11 percentage points, 16 percentage points, and 13 percentage points less likely to be Verified Installers compared to the youngest group. Interestingly, this effect is relatively consistent across the different stages of participation and the different types of data collected in the IAB-SMART study. Participation increases with educational attainment; PASS members with a post-secondary degree are six percentage points more likely to participate in any stage of the study compared to primary school degree holders. We also find that PASS members who hold the German citizenship are five to seven percentage points more likely to participate than non-citizens, and that PASS members who live in the former East German states are three to five percentage points more likely to participate than residents in former West German states. Community size, marital status, household size, presence of own children in the household, household income, employment status, and welfare receipt are not significantly correlated with participation in the IAB-SMART study (p > 0.05).

(a) Average marginal effects (points) and 95%-confidence intervals (bars) from models predicting participation in different stages of the IAB-SMART study (Part 1) (b) Average marginal effects (points) and 95%-confidence intervals (bars) from models predicting participation in different stages of the IAB-SMART study (Part 2)
Turning to the relationship between the invited PASS members and the IAB, we find, as expected, that the longer a person is part of the PASS, the more likely they are to participate in the IAB-SMART study. Compared to PASS members who had been in the PASS for one or two waves before the invitation to IAB-SMART, PASS members with a panel tenure of three to seven waves and eight to 12 waves were three to four and four to five percentage points more likely to participate, respectively. The correlation between consenting to linking administrative data as part of the PASS survey and participating in IAB-SMART was slightly positive but did not reach statistical significance (p > 0.05).
We also find that sample members who received a 10-Euro incentive without a bonus were less likely to participate in all stages of the study compared to the other three incentive groups.
4.3 Non-participation bias in substantive variables
Table 1 presents the estimates for substantial PASS variables based on the full invited sample in Column 1. The other columns present the absolute non-participation biases in percentage points as the difference between the percentage in the full invited sample and the percentage in the sample at the individual stages in the participation process (see Formula (1) above).
Full sample estimates and non-participation bias for substantive PASS variables.
| Function participants | |||||||||
|---|---|---|---|---|---|---|---|---|---|
| F1 | F2 | F3 | F4 | F5 | Qx | ||||
| Invited sample % | Verified installers Bias | Bias | Bias | Bias | Bias | Bias | Bias | Full participants Bias | |
| Social embeddedness | |||||||||
| Size of personal network | |||||||||
| 0 − 2 | 16.8 | −2.3 | −2.6 | −2.3 | −2.1 | −2.7 | −3.1 | −2.3 | −3.2 |
| 3 − 9 | 58.4 | 5.7** | 5.8** | 5.5** | 5.8** | 5.9** | 6.7*** | 5.7** | 6.8** |
| 10 or more | 24.9 | −3.4 | −3.2 | −3.2 | −3.7 | −3.3 | −3.5 | −3.4 | −3.6 |
| Social inclusiona | |||||||||
| Low | 5.7 | −.2 | −.3 | −1.0 | −1.1 | −.4 | −.8 | −.2 | −1.8 |
| Medium | 39.1 | −1.7 | −2.0 | −1.2 | −.8 | −2.0 | −2.0 | −1.7 | .5 |
| High | 55.3 | 1.9 | 2.3 | 2.2 | 1.9 | 2.4 | 2.7 | 1.9 | 1.3 |
| Personality–Big 5b | |||||||||
| Extraversion | |||||||||
| Low | 32.1 | 3.9 | 4.8 | 4.0 | 5.2 | 5.1 | 4.4 | 3.9 | 5.3 |
| Medium | 32.0 | −2.2 | −3.1 | −2.7 | −3.8 | −3.0 | −2.2 | −2.2 | −3.1 |
| High | 35.9 | −1.7 | −1.6 | −1.4 | −1.4 | −2.1 | −2.2 | −1.7 | −2.2 |
| Openness | |||||||||
| Low | 36.1 | −1.8 | −1.4 | −2.6 | −1.9 | −2.6 | −2.7 | −1.8 | −4.1 |
| Medium | 31.8 | 1.8 | 2.1 | 3.1 | 2.7 | 2.7 | 3.1 | 1.8 | 4.2 |
| High | 32.1 | .1 | −.7 | −.5 | −.7 | −.1 | −.4 | .1 | −.1 |
| Conscientiousness | |||||||||
| Low | 35.3 | −1.4 | −1.3 | −1.8 | −3.1 | −2.2 | −1.9 | −1.4 | −3.3 |
| Medium | 33.3 | 2.6 | 2.4 | 3.9 | 3.1 | 3.1 | 3.5 | 2.6 | 3.1 |
| High | 31.4 | −1.3 | −1.1 | −2.1 | −.1 | −0.9 | −1.6 | −1.3 | .1 |
| Neuroticism | |||||||||
| Low | 33.6 | 4.0 | 4.0 | 4.0 | 4.1 | 4.7 | 4.8 | 4.0 | 4.6 |
| Medium | 32.9 | −1.7 | −1.8 | −.9 | −.3 | −1.6 | −2.3 | −1.7 | −.9 |
| High | 33.5 | −2.4 | −2.1 | −3.1 | −3.7 | −3.0 | −2.6 | −2.4 | −3.8 |
| Agreeableness | |||||||||
| Low | 37.1 | .5 | .8 | 1.2 | .5 | −.4 | −.3 | .5 | −2.0 |
| Medium | 33.6 | 4.7 | 4.3 | 4.3 | 4.0 | 5.7 | 4.8 | 4.7 | 5.1 |
| High | 29.2 | −5.1 | −5.0 | −5.5 | −4.5 | −5.3 | −4.5 | −5.1 | −3.0 |
| Labour market | |||||||||
| Working hours | |||||||||
| Under 35 h | 16.0 | −1.3 | −1.2 | −.6 | −.5 | −1.0 | −1.0 | −1.3 | .0 |
| 35–40 h | 21.3 | 2.6 | 3.1 | 3.3 | 3.4 | 2.6 | 2.4 | 2.6 | 3.3 |
| More than 40 h | 19.9 | 3.0 | 3.5 | 3.0 | 2.5 | 3.3 | 2.8 | 3.0 | 2.6 |
| Not working | 42.8 | −4.3 | −5.4** | −5.7*** | −5.3* | −4.9* | −4.2 | −4.3 | −5.9** |
| Social media usage | |||||||||
| No of social media networks used | |||||||||
| 0 | 39.1 | −8.3*** | −7.4*** | −7.3*** | −8.2*** | −7.0*** | −7.3*** | −8.3*** | −8.5*** |
| 1 − 2 | 34.5 | −.7 | −1.6 | −1.5 | −2.0 | −1.1 | −2.2 | −.7 | −1.5 |
| 3+ | 26.4 | 9.0*** | 9.0*** | 8.8*** | 10.3*** | 8.1*** | 9.4*** | 9.0*** | 10.0*** |
Original social inclusion scale ranged from 1 = excluded to 10 = included. Low = 1–3, medium = 4–7, and high = 8–10.
Scores based on the 21-item BFI-K (Rammstedt & John, 2005) implemented in Wave 5 of the PASS. For the analysis, we created tertiles of each factor, i.e., low, medium, and high.
For the measures of social embeddedness, we find that among the Verified Installers the share of PASS members who report a personal network of 3–9 people is 5.7 percentage points higher than in the invited sample (p < 0.001). This bias is relatively consistent across the stages of participation and the different types of data collected in the IAB-SMART study. The bias in the measures for self-reported social inclusion are small and not significant (p > 0.05).
While some of the bias estimates for the Big 5 personality are up to 5 percentage points, none of them is statistically significant (p > 0.05).
In terms of working hours, we see that IAB-SMART participants are less likely to report that they are not working compared to the invited sample. The bias estimate varies between −4.2 percentage points for F2 Participants (p > 0.05) and −5.9 percentage points for Full Participants (p < 0.01). Note that this finding is not comparable to the AME results of Figure 2, because these were operationalized as employment status and estimates from a multiple regression (i.e. employment status under control of welfare benefit receipt).
We find the largest absolute bias for the measure on social media usage. PASS members who report not using any social media network are 8.3 percentage points underrepresented among Verified Installers compared to the invited sample (p < 0.001). In contrast, the share of PASS members reporting that they use three or more social media networks is 9.0 percentage points higher than in the invited sample (p < 0.001). Again, the bias is relatively stable across the stages of participation and for the different types of data collected.
5 DISCUSSION
Smartphone data collection using research apps allows to administer mobile surveys and passively collect data from sensors and log files. While these data can provide researchers with valuable information about individual and social behaviours on a very fine-grained level over a longer time, the success of such a data collection depends heavily on smartphone users’ willingness to download a research app and consent to sharing data. In the IAB-SMART study, we found that out of the 4,293 German Android smartphone owners invited to the study, 14.5 percent downloaded the app, went through the installation process, completed the welcome survey, and were verified as eligible participants. This participation rate is somewhat lower than what other studies reported when recruiting participants from the general population (Elevelt et al., 2019; Scherpenzeel, 2017; Struminskaya et al., 2021).
While the relatively low participation rate seems disappointing on first sight, one has to consider that most earlier studies have collected one type of sensor data only (e.g. geolocation), usually over short periods (e.g. two days). In contrast, our study asked participants to provide extensive access to a variety of passively collected data, including geolocation, call and text message logs, characteristics of the social network, activity data, and app usage, over six months. Our results show that the majority in the general public still seems to be rather skeptical about this form of data collection, and researchers probably need to develop better ways of explaining why the collection of these data are important as well as how the data are collected, processed, and analysed in a privacy-preserving way.
A low participation rate does not necessarily mean that the results of the IAB-SMART study are biased. We thus investigated differences between participants and the invited sample. As shown in earlier studies using smartphones for survey and passive data collection (e.g. Elevelt et al., 2019; Wenz et al., 2019), participation in the IAB-SMART study is strongly correlated with several sociodemographic characteristics of the invited individuals, including age, education, nationality, and region. Given that especially older people and people with lower educational attainment in Germany are also less likely to own a smartphone (Keusch et al., 2020), the findings presented in this paper show that existing coverage error in these groups is further exacerbated by non-participation error. Researchers who want to collect data from the general population using research apps will need to adjust their estimates, for example, by weighting, to account for the differences in participants and non-participants.
One limitation of our study is that we do not have data on specific attitudes about privacy and data sharing from participants and non-participants. We thus cannot directly estimate the effects privacy concerns have on the participation decision, and we hope that future studies will provide more evidence on this issue. However, we found that the longer a person was part of the longitudinal offline panel they were recruited from, the more likely they were to participate in our smartphone study. We interpret this finding as an indication of trust that has been built up over time between long-term panel members and the research organization. Given the extensive amount of potentially sensitive data that our app collected, we assume that recruiting participation from a fresh sample of the general population using a similar app will yield a lower participation rate.
To study the effect of non-participation on substantive variables that could be measured through the sensor and log file data that our app collected, we analysed the differences in point estimates between the full sample and the study participants. Out of the nine measures of social embeddedness, personality, labour market, and social media use, we found significant biases for the self-reported size of the social network, the number of working hours, and the number of social media networks used. The fact that non-working sample members were underrepresented by four to six percentage points among the study participants is especially worrisome in the context of a study that collects employment-related measures. Even larger was the bias for social media use. Among the IAB-SMART study participants, people who reported using three or more social media networks were around nine to 10 percentage points overrepresented compared to the initial sample invited to the study. While we do not have information on other types of Internet and smartphone usage from both the participants and the non-participants in our study, we can assume that we would find similar biases for such related measures. Compared to self-reports in surveys, passive measurement produces more precise estimates of smartphone usage behaviour, such as mobile Internet use in general and engagement with social media platforms in particular (Araujo et al., 2017; Boase & Ling, 2013; Jones-Jang et al., 2020), and self-reports on these behaviours are thus most likely to be substituted by passive measurement in the future. We thus caution researchers not to provide unadjusted point estimates for these types of behaviours based merely on the samples from studies using research apps. In general, our findings show once more how important it is to study non-participation bias on a variable-specific level that goes beyond mere sociodemographic differences.
We also found that once the IAB-SMART app was downloaded there was, as expected, higher participation in the self-reported portion than the passive measurement. However, we see relatively little variation in what specific types of passively measured data participants provided through the app, which is in line with previous research (Beierle et al., 2020); function participation ranged between 13.4 percent for data on network quality and location and 12.2 percent for information from the participants’ phonebooks about the characteristics of their social networks. In addition, the relationship between sample member characteristics (i.e. socio-demographics and trust) and participation is highly comparable across the individual stages of participation and for the different types of passively collected data. Similarly, the bias in substantive variables stays relatively stable.
Although there is relatively little variation in the absolute numbers of participants who provided data through the five passive data collection functions of the IAB-SMART app, less than 11 percent of all invited sample members provided all types of data at least once during the six months field period. On the one hand, setting a more strict definition of participation neither affects the relationship between participation and panel member characteristics nor the bias estimates in substantive variables. On the other hand, this finding has practical implications, showing the complexity of calculating participation rates in such studies. This result suggests the need for a more standardized way of reporting participation metadata in studies that combine survey data collection with passive measurement on smartphones and other devices, such as wearables, smart watches, and activity trackers, along the lines of the AAPOR (2016) Standard Definitions. In a study that collects multiple types of data through a research app, the same person might be counted as a participant for some parts of the study and as a non-participant for others, depending on the research question and what type of data is used in the analysis.
The length of the field period might add even more complexity. For this paper, we defined participation as providing data through the app at least once during the six month field period. However, the full potential of this data collection approach lies in the continuous collection of high-frequent measurements to study behaviour and change thereof over time. As reported in Kreuter et al. (2020), almost 90 percent of sample members who downloaded the app did not change their consent settings once the app was up and running, and less than 20 percent of participants had fewer than 180 days of data at the end of the field period. Nevertheless, missing data due to device-related errors (e.g. manufacturer and OS settings, third party apps) and participants’ behaviour (e.g. temporarily turning device off) can accumulate over time, and over 50 percent of the originally scheduled network and geolocation measurements (F1) were missing (Bähr et al., 2020). In some settings, even short field periods (e.g. less than a week) might reveal interesting patterns, for example, about repetitive, daily behaviours. In other cases, long, uninterrupted measurement is necessary to understand changes over time. Thus the length of time a case must be part of the study in order to count as a participant may differ across studies.
The findings from the IAB-SMART study reported here are certainly only generalizable to studies conducted in a similar context (i.e. recruiting from a sample of Android smartphone owners out of an existing longitudinal study in Germany, using a quite elaborate incentive scheme, collecting specific types of data). In particular, we restricted our sample to Android smartphone owners, deliberately excluding owners of Apple iPhones and smartphones with other operating systems. In an earlier study using PASS data (Keusch et al., 2020), we found that around two-thirds of German smartphone owners have an Android smartphone and less than one third own an iPhone. We found significant differences in various sociodemographic, attitudinal, and behavioural characteristics depending on the operating system of the smartphone. While we consider this an issue of coverage bias, and not non-participation, we do not know whether iPhone owners would show similar or different participation behaviour compared to the Android smartphone owners in our study. Nevertheless, we see our study as a valuable contribution to a growing body of literature on novel ways of collecting different types of social and behavioural data from smartphone users. In the future, we hope to see more studies that investigate the effect of non-participation on the outcome measures that are supposed to be collected with smartphone sensors and log files, taking into account regional differences in smartphone use and norms when it comes to sharing smartphone data.
Supporting Information
Additional supporting information may be found in the online version of the article at the publisher’s website.
ACKNOWLEDGEMENT
Open access funding enabled and organized by ProjektDEAL. Georg-Christoph Haas’ time was supported by the German Research Foundation (DFG) through the Collaborative Research Center SFB 884 “Political Economy of Reforms” (Project A9) [139943784 to Markus Frölich, Florian Keusch, and Frauke Kreuter].
