


Summary
The paper describes a comprehensive approach to problems of performance measurement that can be used to tackle a wide range of situations, including designing monthly board and leadership reports in enterprises, assessing research quality and monitoring the efficiency and effectiveness of government programmes. It provides a review of various methods for tackling these problems and outlines some current areas of research. Although technical statistical issues are buried somewhat below the surface, statistical thinking is very much part of the main line of argument, meaning that performance measurement should be an area attracting serious attention from statisticians.
1. Introduction
1.1. Purpose
Performance indicators permeate most aspects of everyday life in government, business and industry. Whatever is being done—exercising due diligence as a company board member, evaluating the efficiency and effectiveness of a government programme, monitoring a patient's health, selecting players for a professional sporting team, assessing a research grant, tackling safety issues in a workplace, … —there is ever-increasing reliance on ‘metrics’ to benchmark, to set priorities and to monitor progress.
However, this increasing need has not been matched by increasing research activity into systematic ways to develop performance indicators for a specific application. Rather, solutions tend to be ad hoc, with little general learning being transferred from one area of application to another. It is a situation that would appear to call for increased attention by statisticians.
Of the various approaches that are described, this paper advocates the use of an organizing principle—alignment—as a systematic way of tackling problems of performance measurement, coupled with two key imperatives—the need to establish a link to higher level business drivers, and to identify priorities that are likely to have the biggest effect on the business. An important consequence of adopting this approach is the delineation, at different scales, of chains of metrics in-process →output→outcome (impact), the first two links typically being objective in character and the last subjective. It is the last link in the chain—and arguably the most important from a decision-making perspective—that has received the least attention. In contrast with most of the published literature, this paper focuses more on this aspect, and less on the rather better-studied early links.
1.2. Historical developments
Statisticians have been studying the use of performance indicators to monitor, control and improve industrial processes and systems for a long time, the first notable contribution probably being the classic 1939 work on statistical process control by Walter Shewhart (e.g. Shewhart (1986)). However, performance indicators are also in widespread use in many areas that have been largely unstudied by statisticians. There has certainly been critical and scholarly focus on specific topics. For example, in the UK ‘league tables’ for educational institutions have received much attention (e.g. Goldstein and Leckie (2008), Foley and Goldstein (2012) and references cited therein). In academia, so-called ‘bibliometrics’ are in widespread use for ranking academic departments, schools and institutions, for awarding research grants, and for assessing cases for promotion; see for example Adler et al. (2009) for a critique of their use. Performance indicators in the area of healthcare have been studied extensively by Spiegelhalter and co-workers (see for example Spiegelhalter et al. (2012) and references therein) and Ash et al. (2012), and in numerous articles by Ronald Does and his colleagues in the context of implementing Six Sigma programmes (see http://www.uva.nl/profiel/d/o/r.j.m.m.does/r.j.m.m.does.html). Battisti et al. (2010) have studied how to measure innovation, in response to the innovation charity Nesta (nesta.org.uk) and two UK Government departments becoming interested in the development of an innovation index in an attempt to rank firms and governments in terms of their innovation performance.
However, no sets of overarching principles or frameworks have emerged that provide general guidance about how to approach problems of performance measurement in these and other such settings. One consequence of this has been the production of lists of performance indicators that have been generated with little or no attention paid to the adequacy or suitability of the list, or to how the indicators can be used for monitoring, control and improvement (see for example Parmenter (2010), with its long list of performance measures on pages 217–293, yet essentially no mention of processes and, on page 8, dismissal of the need to distinguish lead from lag indicators!).
That said, some insight about how to start to develop a suitable approach can be gained from elsewhere in the management and marketing literature.
In a manual that formed the basis of a course on industrial management for Japanese industrialists (Sarasohn and Protzman, 1948, 1998), Homer Sarasohn began by posing the question ‘Why does any company exist?’. In rejecting the possible response that its purpose is to make a profit, he observed that such a response
(Sarasohn and Protzman (1948), page 1). One immediate implication of this passage—if one accepts its argument—is that the issue of performance measurement as it relates to an enterprise is really multivariate: we not only need metrics relating to the interests of the owners of the company, but also to several other interested parties (or stakeholders) in order to assess the viability of the enterprise.‘… is entirely selfish and one-sided. It ignores entirely the sociologic aspects that should be a part of a company's thinking. The business enterprise must be founded upon a sense of responsibility to the public and to its employees. Service to its customers, the wellbeing of its employees, good citizenship in the communities in which it operates—these are cardinal principles fundamental to any business. They provide the platform upon which a profitable company is built’
The next insight comes from marketing and derives from a business paradox that confronted AT&T in 1986. At that time, AT&T was a very large company, with about 300000 employees in 19 business units that operated in 32 countries and competed in 67 market sectors. They were surveying 60000 customers world wide each month and achieving 95% customer satisfaction. Yet, at the same time, they lost 6% market share, where 1% corresponded to $600 million. The then chairman, Bob Allen, put together a team from across the business units and told them to find out why there was no connection between customer satisfaction and business performance and to fix it. Ray Kordupleski, who led the team, recounts the following story (Kordupleski, 2003, 2018).
Many of AT&T's problems are captured in a graph similar to Fig. 1, which shows loyalty (as measured by the percentage of customers very willing to repurchase) plotted against overall customer satisfaction.
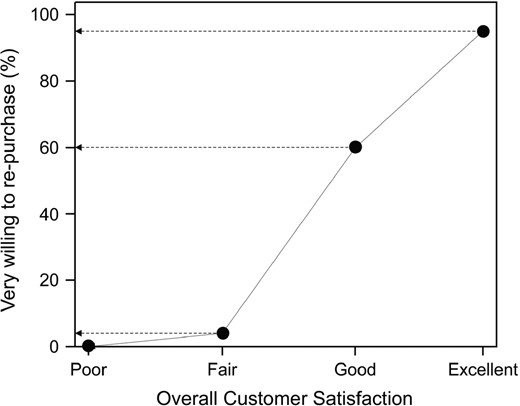
Relationship between overall customer satisfaction and loyalty for AT&T in 1986: 95% of respondents rating AT&T excellent were very willing to repurchase, compared with 60% of those who rated them good and 4% for those rating them fair (after Kordupleski (2003))
Kordupleski summarized the main problems as follows.
- (a)
Responses of good or excellent were pooled and categorized as satisfactory. However, there is no such thing as a satisfied customer, only degrees of satisfaction, and evidently good is very different from excellent in terms of loyalty.
- (b)
Improvements were focused on the 5% of people rating AT&T poor or fair, rather than on the largest group (good), 40% of whom were probably looking elsewhere for a supplier.
- (c)
The results compared one part of AT&T with another part of AT&T, rather than AT&T against its competitors.
- (d)
The survey ignored issues to do with price, just focusing on quality.
However, buried deep in the survey there was a question about value, which assesses people's perception of the quality of what they receive, balanced against their perception of the price paid. It was when AT&T redesigned their survey to focus on value and relative value (or customer value added) that they obtained lead indicators of high level business drivers such as market share, revenue share and return on investment (e.g. Kordupleski (2018), chapter 1; see also Section 2.3 below). In fact, AT&T's leadership could manage all customer-related aspects of their business with just three key ratios: relative satisfaction with value, relative satisfaction with quality and relative satisfaction with price.
This is a simple but profound outcome. Firstly, these top level metrics are all measures of perception, rather than hard numbers (profit, market share …). Further, it raises the possibility of applying similar logic to relationships with other important stakeholders, and so points to a plausible approach to developing a performance measurement system for an enterprise by establishing a concept of value for each group of stakeholders. In devising a generic approach for this and for other performance measurement issues, we shall use as exemplars three different situations, two of which present wide-open areas for further research.
- (a)
Scenario 1: you have just been appointed to the board of an enterprise—perhaps a publicly listed company, perhaps a private company or maybe a quasi-autonomous government body—and are about to attend your first board meeting. Although you have not taken a company director's course, you have a sufficient understanding of governance matters to be aware that board members have individual and collective accountability for the wellbeing of the enterprise. The board papers have been circulated a few days in advance, and you open them and start to browse through the numbers being reported. What sorts of numbers would enable you to exercise your Director's duties with due diligence?
- (b)
Scenario 2: you have just been appointed Deputy Vice-Chancellor (Research) of a university that has not been performing well in the last few years of competing for research grants and so is sliding down the university rankings’ scale. The national assessment criteria have resulted in an edict from your Vice-Chancellor that all research must be submitted to ‘tier 1’ journals. As a consequence, your researchers are abandoning the pursuit of research projects of considerable prospective benefit to the community (an important part of your university's charter) in favour of smaller theoretical research activities that provide an opportunity for publication in ‘authorized’ journals. How can you turn things around?
- (c)
Scenario 3: you have just had a meeting with the head of the Department of the Environment. The best climate forecasts that are available suggest that the critical shortage of water is likely to continue for years. The government has decided on a major national project to encourage every household to make use of ‘grey’ water by offering subsidies for installation of dual reticulation systems. This will have the side benefit of providing an injection of funds into the economy and a boost to employment. However, the government wants to make sure that its money is being spent efficiently as well as effectively. What will you do to ensure this?
Although these three scenarios are fictitious as described, they are synthesized from actual situations. And, in each case, there is a critical underlying issue relating to performance measurement: what sorts of performance indicators need to be in place to carry out these tasks well? This in turn leads to consideration of questions such as these.
- (i)
What really needs to be measured?: impacts?: outputs?; inputs?; something else?
- (ii)
What is the purpose of the measures?: benchmarking?; monitoring?; control?; improvement?
- (iii)
How do the measures relate to business processes?
And so, more basically,
- (a)
where do we start?;
- (b)
what sorts of metrics will help?;
- (c)
how do we know whether what we produce is useful, let alone sufficient for what is really needed?
1.3. Layout of the paper
Section 2 discusses performance measurement for an enterprise: an appropriate context for scenario 1. Section 2.1 provides a brief overview of earlier work, and Sections 2.2 and 2.3 look in more detail at a generic methodology that will be applied throughout the paper. In particular, the concept of alignment emerges as an organizing principle that provides a means of tackling a range of other performance measurement issues including those in scenarios 2 and 3.
Section 3 considers extending these concepts to issues arising in research environments, such as assessing research quality (scenario 2); Section 4 provides some comments about measuring the deployment of government programmes (scenario 3). Section 5 contains a concluding discussion.
Throughout the paper an asterisk indicates that a definition or description for the marked term is available in Appendix A, and the code (S) means see the on-line supplementary material.
Although technical statistical issues are buried somewhat below the surface of many performance measurement problems, statistical thinking is very much part of the main line of argument, meaning that performance measurement as a general topic should be an area attracting serious attention from statisticians.
2. Performance measurement for an enterprise
2.1. Earlier work
A review of previous approaches to performance measurement for an enterprise can be found in Fisher and Nair (2008), and Fisher (2013), pages xxi–xxiii, so the discussion here is confined to mentioning just two of these.
One simple approach
‘… is to look for a very small set of generic metrics that can be used throughout an organization or, equivalently, at all scales of measurement from micro to macro …’ (Fisher (2013), page xxi).
Fisher and Nair (2008) commented that
‘The power of this concept is that it could be used to focus communication at all levels of the organisation: in the words used by a senior industry figure to one of the authors, “I want to be able to drill down through management layers with a single metric, to find out what's causing a problem”’.
It is a matter of historical interest that the Six Sigma movement originated from just such a starting point at Motorola, Inc. (personal communication from Debby King-Rowley, former global Director of Executive Education at Motorola, September 13th, 2008):
‘There was a very early focus on cycle time reduction across the board. That was introduced from the C-suite down in 1986. At that time, Motorola was working on quality through the 3 leading guru schools of thought at the time—Deming, Phil Cosby, and Juran. No single approach was being promoted from corporate. When cycle time was introduced, it was introduced as part of a 3-legged stool—cycle time, quality, cost. All three had to be in balance within the business units. Cycle time was the only one being driven (in goal of 50% reduction and process) from headquarters. Once cycle time focus was in place, an eye was turned to quality to standardise the approach on a company-wide basis. A lot of work was being done with Deming's concepts, but an internal electrical engineer, Bill Smith, in our then “Communications Sector” created the concept of Six Sigma. He took the idea to Bob Galvin, who is quoted as telling Bill “I don’t fully understand it, but it seems to make sense. Come meet with me weekly til I understand it.” Bill did, Bob fully grasped it, then others (particularly statisticians like Mikel Harry) were brought in to support and advance Bill's Six Sigma. Then the rest is history.’
Robert Kaplan and David Norton tackled the problem from quite a different perspective; indeed, from four perspectives. In a series of publications (e.g. Kaplan and Norton (1992, 1996a, 1996b, 2006, 2010) they introduced and developed the so-called Balanced Scorecard as a means of measuring strategy. In their initial work, they defined four so-called perspectives—customer, internal, innovation and learning, and shareholder—from which they suggested that a set of measures be derived to give senior officers a fast but comprehensive overview of the business. Subsequently, they found it necessary to introduce other perspectives, e.g. an environmental perspective.
We provide further comment on the Balanced Scorecard at the end of Section 2. Here, suffice it to say that, to the extent that it works, it is still not addressing the whole performance measurement problem. Fisher (2013) suggested that a performance measurement system should provide, inter alia,
- (a)
a concise overview of the health of an enterprise (where is it now, and where is it heading?),
- (b)
a quantitative basis for selecting improvement priorities, and
- (c)
alignment of the efforts of the people with the mission of the enterprise,
and suggested that such a system could usefully be modelled with two basic components:
- (i)
a framework for performance measures and
- (ii)
a general process for putting the measures in place (i.e. populating the framework) and using them to best effect, e.g. by identifying priorities for action to address the most pressing business issues—falling market share, high staff turnover, loss of community support, … .
Much of the published research on performance measurement relates to frameworks, not systems: little if anything is said about how to identify and use the performance measures. Neely et al. (2007) provided an overview of some of the frameworks that are available, particularly the Balanced Scorecard, and noted some of its deficiencies (see also Atkinson et al. (1997) in this regard). An Internet search of ‘performance measurement system’ identifies a number of other ‘systems’, none of which appears to be complete, either because of the limited scope of the framework or because the response to (ii) is inadequate.
As a final comment, a performance measurement system is still, at best, a crucial aid to decision making that allows boards to exercise—and demonstrate that it is exercising—due diligence in leading an enterprise. Thus, it can assist in managing overall risk rather than eliminating it. As W. Edwards Deming observed (e.g. Deming (1993)), ‘Management is prediction’. Statisticians understand better than most the import of this statement.
2.2. A performance measurement framework
A stakeholder-centred performance measurement framework was described in detail in Dransfield et al. (1999) (see also Fisher (2013), chapter 3) and will only be outlined here. It comprises a set of three principles* relating to alignment, process thinking and practicability; a paradigm for performance measures and a structure for performance measures.
The following paradigm was communicated by e-mail to the author by Myron Tribus around 1993.
- (a)
What products or services are produced and for whom?
- (b)
How will ‘quality’, or ‘excellence’, of the product or service be assessed and how can this be measured?
- (c)
Which processes produce these products and services?
- (d)
What has to be measured to forecast whether a satisfactory level of quality will be attained?
It seems so obvious that one wonders why it should even be put in writing. However, it is easy to find examples to demonstrate that some people do not abide by its logic. There is an extensive literature on the subject of ‘key performance indicators’ (KPIs). The term itself is often taken to be self-defining, although this is often contradicted by subsequent description and usage of specific KPIs. In many instances, for example, KPIs relate to the fourth step of the Tribus paradigm, without the first step having been carried out: in other words, the target has not been specified yet people are happy to start firing. (The author is indebted to Jim Rosenberger for introducing him to the concept of Texas target practice: firing a gun against a barn wall, and then drawing the target where the bullets actually hit.) A similar situation can be found in the literature relating to measuring research quality: indicators are selected without first defining what is meant by ‘research quality’. This issue will be revisited in Section 3. Evidently, the paradigm captures the essence of aligning activities with the ultimate goal.
The proposed structure, or hierarchy, for performance measures is motivated by the postulate that an enterprise can only be successful in the long term if it creates and adds value (in a sense to be defined) for five different groups of stakeholders: its owners, its customers, its people, its partners and the wider community (see Dransfield et al. (1999) for a detailed discussion). Each of these groups makes some form of investment in the enterprise, whether it be money, effort, support, …, and each has alternative possibilities for the investment: hence the need to create superior value for the stakeholder than they can acquire elsewhere. (The italicization reflects another point of confusion in the literature: some researchers use the term ‘customer value’ to refer to value created by the customer for the company, rather than the reverse as is intended here.)
So, the starting point for performance measurement in this stakeholder view of the world is to ask ‘What does value mean for each stakeholder group, and how can we measure it?’. This provides a basis for measuring success. Success measures constitute the ‘strategic zone of measurement’ and so fall within the remit of the board of the enterprise. However, success measures (equivalent to measures of outcomes) are not suitable for managing the enterprise: they are lag indicators, resulting from past efforts. (‘Managing on outcomes is like steering a car by looking in the rear view mirror’: an observation probably due to Myron Tribus. It is also a reason that the calculation of bonuses for leaders of some large enterprises is based on the results 5 years later; see for example the bonus bank approach of Stern Stewart; Bischof et al. (2010).) The Holy Grail of performance measurement is to find lead indicators of success, and it is these measures that will be termed KPIs in this paper. KPIs constitute the ‘tactical zone of measurement’ and are of interest to both the board and the leadership team.
The key to improving KPIs and hence success measures is, of course, to work on the various business processes in the enterprise, which calls for many more measures relating to monitoring, controlling and improving processes. These measures comprise the ‘operational zone of measurement’ and relate to accountabilities and responsibilities of numerous people in the enterprise. The three zones of measurement correspond to three zones of management as discussed, for example, by Sarasohn and Protzman (1948, 1998) and subsequently as reflected in systems such as Hoshin Kanji* to ensure alignment of operational activities with strategic intent.
Fig. 2 depicts these three zones, and the purpose of the metrics in each zone.
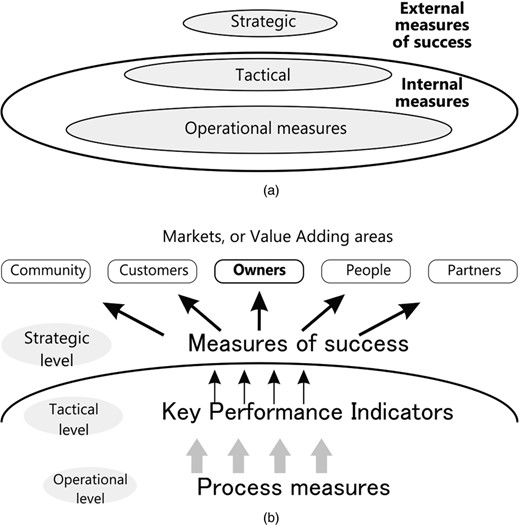
The two figures show the performance measurement framework, with its focus on five stakeholder groups, and with three distinct zones of measurement delineated: in the strategic zone, measures of success are outcome or lag measures, a consequence of the past efforts of the enterprise; the tactical zone is of more interest to the leadership of the enterprise in terms of management, because the KPIs are lead indicators of future success; the operational zone comprises the usual metrics for monitoring, controlling and improving processes and so improving KPIs
The next issue to be considered is how to put appropriate measures in place and to use them to set priorities. An excellent market research process for just this purpose has been available for about three decades in the context of customers but is largely unknown in the statistical community. The key elements are sketched in Section 2.3, and then developed and adapted in Sections 2.5–2.8 to produce the complete system and so to provide the board and leadership reports. Section 2.4 contains a discussion of some technical statistical issues that are associated with the process.
2.3. Finding customer-related metrics: a process for managing customer value
We return to the AT&T example that was introduced in Section 1. As described by Kordupleski (2003, 2018), the AT&T team devised a new style of survey instrument that structured the survey questions in a customer satisfaction survey according to a so-called ‘value tree’; Fig. 3.
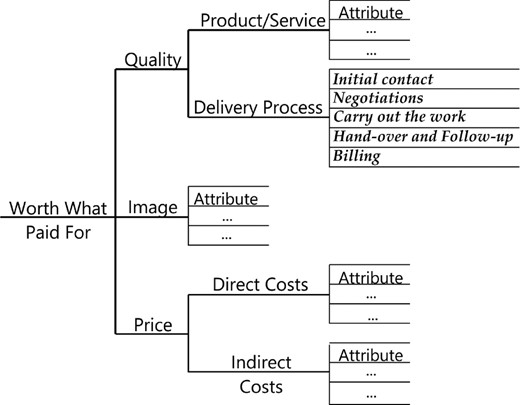
Prototypical structure of a customer value tree: in this representation, overall value (described as worth what paid for) has three main ‘drivers’, quality, image and price; quality is represented as the product or service received, and the delivery process comprising the sequence of customer experiences in receiving this product or service; price has as its drivers both direct costs and indirect costs (or cost of doing business); the small sets of ‘attributes’ associated with each of the main branches are determined from market focus groups; a respondent assigns ratings on a 10-point scale, starting at the lowest level of the tree and working upwards, so yielding a tree-structured measurement
Data are obtained by asking respondents to rate the performance of their supplier on a 10-point scale, where 1 is poor and 10 is excellent, starting with the attributes of product or service, followed by an overall rating of product or service, and so on, until eventually an overall rating for value is assigned. This leads to a structured set of ratings that can be modelled and analysed in hierarchical fashion, by fitting product or service as a function of its attributes, delivery process as a function of its subprocesses, quality as a function of product or service and delivery process, …, and finally, value as a function of quality, image and price.
To make the results readily understandable and actionable by senior executives, Kordupleski recommended analysing the data on their original scale by fitting simple linear models (see Section 2.4 for more discussion). The goal is to arrive at a set of impact weights and mean ratings as shown in Table 1, which displays the competitive profile for the top level of the value tree. Two important actions derive from Table 1.
A top level customer value competitive profile†
| Impact weight (%) | Mean rating (se±0.05) | Relative rating (%) | ||
|---|---|---|---|---|
| This company | Competition | |||
| QualityQ | 42 | 7.7 | 7.6 | 101 |
| Image I | 15 | 7.1 | 7.3 | 97 |
| Price P | 30 | 6.9 | 7.0 | 98 |
| Value V | 7.3 | 7.5 | 97 | |
| Impact weight (%) | Mean rating (se±0.05) | Relative rating (%) | ||
|---|---|---|---|---|
| This company | Competition | |||
| QualityQ | 42 | 7.7 | 7.6 | 101 |
| Image I | 15 | 7.1 | 7.3 | 97 |
| Price P | 30 | 6.9 | 7.0 | 98 |
| Value V | 7.3 | 7.5 | 97 | |
The overall value score is 7.3, compared with the competition which averages 7.5, so, for this enterprise, the customer value-added score is below par at 97%. (Par would be a customer value-added score in the range 98−102, allowing for the variability in the data.) The ratings are on a 10-point scale, where 1 ≡ poor and 10 ≡ excellent. The impact weights have been derived by fitting a simple linear regression model to V as a function of Q, I and P, and then normalizing the coefficients to add to the value of R2.
- (a)
The overall value score needs to be linked to higher level business drivers, such as customer loyalty. A way to do this is shown in Fig. 4. It provides a basis for setting an overall (say 12-month) improvement goal for the rating of customer value, e.g. an increase of 0.5.
- (b)
Table 1 suggests where to focus improvements and allows prediction of the change in the value rating. To take a trivial example, suppose that three improvement teams are set up, one focusing on quality, one on image, and one on price, and they have been set the following targets: improve quality Q by 0.5 (7.7 → 8.2); improve image I by 0.5 (7.1 → 7.6); improve price P by 0.6 (6.9 → 7.5). Based on the impact weights in Table 1, the predicted improvement is 0.495, which is very close to the goal of 0.5.
The lower levels of the value tree can now be used to identify where to focus attention: identify attributes that have high impact weights and low relative ratings and bring the usual quality improvement tools to bear.
One final process step is needed to yield the desired performance measures. Whereas a value survey involves surveying the whole market—both one's own customers and those of one's competitors—if possible, the improvement activities will generally result in lower level transaction surveys of one's own customers. These help to identify low level quality attributes and, finally, (hard) in-process measures that can be used to monitor, control and improve business processes. The overall chain of actions is shown in Fig. 5.
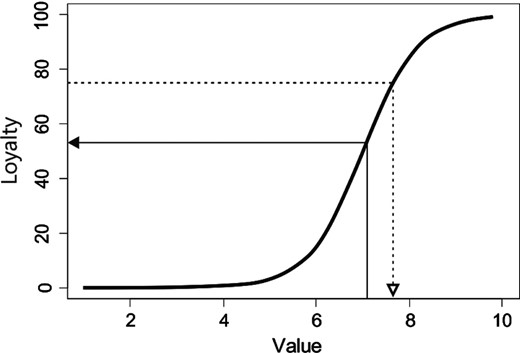
A value–loyalty graph shows the typical relationship between value, on a 10-point scale, and the percentage of people who are very willing to show some specific form of loyalty, such as being very willing to recommend an enterprise to others, or very willing to repurchase: in this example, the specific score V = 7.1 corresponds (←) to about 63% of people being very willing to recommend (i.e. providing a rating of 8, 9 or 10 on a 10-point scale); if the 12-month target for loyalty is chosen as 75%, this means that the value score must be increased to about 7.65 (based on Fisher (2013), exhibit 4.1; after Kordupleski (2003))
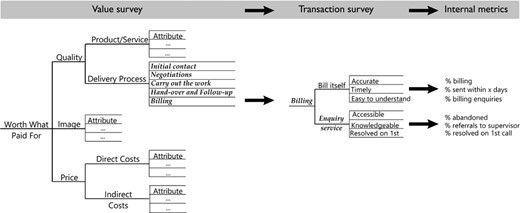
Complete chain of actions for development of internal metrics: priorities identified in a value survey trigger a transaction survey for an important business process, leading to identification of operational quality attributes and internal metrics that can be tracked to monitor improvement (from Fisher (2013), exhibit 5.11; after Kordupleski (2003))
There are some important points to make about this overall process.
- (a)
It is consistent with survey process desiderata*.
- (b)
The overall measure of customer satisfaction can be linked to higher level business drivers (see Fig. 4). Making this connection is critical, because customer loyalty can be linked to bottom line financial performance and so form the basis for choosing between competing possibilities for improvement. In an initial customer value study of senior managers by the Property Division of a research agency, five business impact questions were asked. The loyalty results for each question corresponding to the overall rating of value were
- (i)
40% rating the Division as strongly aligned with corporate objectives,
- (ii)
7% rating the Division highly on optimizing ecological sustainability,
- (ii)
3% rating the Division highly on improving operating costs of facilities,
- (iv)
27% rating the Division highly on developing and maintaining valued research facilities and
- (v)
20% rating the division highly on optimizing utilization of properties.
The striking graphical results (S) corresponding to Fig. 4 led to specific initiatives being included in a 5-year strategic plan developed shortly thereafter.
- (i)
- (c)
It provides the leadership with a means of selecting their top two or three priorities for improvement: what needs to be fixed and in what order? Many satisfaction survey instruments identify a large number of issues to address, but with little guidance about which improvements are likely to make the biggest difference. What is actually needed to support good decision making is a short list of top priorities: more data will be available in a few months to identify other areas that require attention, and in which order. According to this approach, focus attention in areas leading to the greatest gain in customer value and so in customer loyalty (or whatever other higher level business metric is appropriate).
- (d)
It demonstrates an important hierarchical structure among performance measures, consistent with the performance measurement framework. Some measures are far more important than others. The customer value-added score is a success measure, the value score is a tactical measure and the attribute scores and in-process measures are operational measures.
- (e)
It reveals the interplay between lead and lag indicators. At the highest level, this is represented by the value score as a lead indicator for the customer value-added score. At the lowest level, the in-process measures are lead indicators for the satisfaction ratings of their corresponding quality attributes. A not-so-incidental point arises here: distinguishing between attributes and in-process measures that have desirable consequences and those that, although seemingly good for the business, may have undesirable consequences elsewhere in the system. Kordupleski (2003) illustrated this point compellingly with the example of a billing process. If the company's focus is on banking customers’ payments as fast as possible, it leads to billing process measures such as overdue payments. However, if the focus is on what is important to the customer about the whole payment process, this leads to quality attributes such as no surprises, easy to understand and easy to correct, and to in-process measures such as percentage of invoices generating enquiries and percentage of invoice enquiries resolved at first call. These are ‘customer friendly’ metrics while still enabling the business to operate more efficiently.
- (f)
The structured survey instrument provides a means of checking that no important satisfaction driver has been omitted. If, at some level, the model fit is unsatisfactory, something is missing, and the focus group work needs to be revisited.
- (g)
Overall value is linked to the business processes that are the means to improve it.
- (h)
An on-going dialogue with stakeholders is essential. The whole process of managing customer value (and, more generally, stakeholder value) is one of conducting an on-going dialogue with the stakeholder—asking what needs attention next, responding to the feedback, letting the stakeholder know about the improvements, and then asking ‘What next?’. (It goes without saying that this cannot be accomplished without an internal culture of continuous improvement.)
- (i)
Overall, the process helps to align the people in the enterprise with creating and adding value for customers.
- (j)
All the major branches in the value tree can be used for benchmarking purposes.
- (k)
The customer value tree provides a clear interpretation for the term ‘value proposition’. Thus, taking Table 1 as a starting point, a company may choose as its strategy to be at par with the competition on price and image, but to excel on quality, and that strategy would inform its improvement actions relating to lower level branches of the value tree. Kordupleski (2003), page 25 (see also Fisher (2013), page 48), has an interesting way of representing this in a so-called ‘value map’.
- (l)
The market's perception of what constitutes value does not stay fixed in time. At some point such a change will start to become evident through degradation in the quality of the model fits and early warning may also be gleaned from qualitative responses. One needs to sample the market at a frequency that is appropriate to the market to be able to guard against poor quality data; however, see the next point.
- (m)
People are becoming increasingly resistant to requests for feedback. In particular, this makes it increasingly difficult to obtain competitive data, and more reliance needs to be placed on internal benchmarking, for example by using the value–loyalty plot.
Before looking at how customer value management can be adapted to other stakeholder groups, we consider some statistical modelling issues.
2.4. Statistical modelling and analysis issues
2.4.1. The rating scheme
To provide context for these comments, we take as an example the National Student Survey 2017 (http://www.thestudentsurvey.com/content/NSS2017_Core_Questionnaire.pdf). A simple analysis of the National Student Survey instrument shows that it probably fails all of the desiderata* for such surveys. One critical weakness derives from its use of the Likert scale (Likert, 1932), with students being asked, in effect, ‘Please rate your agreement with …’ by using a seven-point scale ranging from strongly disagree to strongly agree. The problem with this approach is that it measures agreement, not performance level: students are being asked to indicate agreement or disagreement with a number of statements, rather than to rate the performance of the institution (via the instructor). Also, it can lead to difficulties of interpretation. Subjective judgements are built into the survey statements. For example, a student may disagree strongly with ‘I have received detailed comments on my work’ yet the comments may have been quite sufficient for the student's needs. A more egregious example is the overall statement ‘Overall, I am satisfied with the quality of the course’. A student may strongly agree that he or she is ‘satisfied’; however (see Section 1.2), there is no such thing as a satisfied customer, only that there are degrees of satisfaction, and the degree of satisfaction relative to the competition is what really counts. Such an approach to satisfaction surveys does not address this issue. See Kordupleski (2003) for a comparison of different approaches to posing survey questions.
2.4.2. Modelling value data
A critical consideration in modelling and analysing value data is the interpretability of the results by decision makers—typically non-statisticians—to inform the selection of a small number of improvement priorities. So, the goal is to provide the sort of results that are shown in Table 1.
The initial approach that was used at AT&T, where the customer value programme was developed and launched in response to AT&T's 1986 crisis, was due to Rich de Nicola and Ray Kordupleski (Kordupleski, 2003, 2018). It involved modelling the data set by using a sequence of hierarchical models as described in the previous section. At each level, they fitted simple linear models and then converted the regression coefficients to elasticities* to aid interpretation.
Subsequently, Kordupleski left AT&T, and after a while the customer value programme started to drift. Senior leadership in Lucent again became concerned about their customer data. An in-house statistical research group led by William Cleveland built a comprehensive hierarchical Bayes model for the entire available data, which extended over several survey periods. Clark et al. (1999) reported careful empirical validation of modelling assumptions (e.g. whether it is reasonable to model data measured on the 10-point scale as continuous variables), and that modelling appeared to be very effective in explaining the various components of variation in the data. However, this came at a significant cost: the model involved using a transformation to symmetrize the data and the results were reported on the transformed scale as trellis graphics rather than in the form that is shown in Table 1 that is better suited to direct interpretation and action by management.
The empirical evidence from studying a wide range of value data sets (e.g. Kordupleski, personal communication, and the author's own experience) suggests that, if interpretability is an overriding consideration, then the following simple modification of the de Nicola–Kordupleski approach suffices to give reliable and actionable results. Fit a least squares model. Occasionally collinearities can occur and can generally be handled satisfactorily by eliminating one of the attributes. Set negative coefficients to 0. Use coefficients as impact weights, normalized to add to multiple-correlation coefficient R2. Use R2 to describe the model fit. Poor model fits, particularly those exhibiting large negative coefficients, are indicative either of insufficient care being taken to identify all the important attributes of a particular driver or, if this occurs after a number of survey cycles, of significant change in what is important to the market.
Of course, the linear models are only approximations but (exemplifying George Box's observation about all models being wrong but some being useful) the approximations are very useful here, because the goal of the analysis is usually to identify the top two or three areas needing focus. Experience in applying this approach in a variety of settings, particularly for customers, confirms that, provided that the choice of the top level structure for the value tree and the initial identification of attributes are done carefully, statistically acceptable model fits can be obtained that are useful for prediction; and, further, selecting and implementing improvements based on on-going acquisition and analysis of value survey data leads to continuous improvements in business results.
2.4.3. Modelling value data collected over time
Most monitoring of markets is still done by static survey—monthly, quarterly or yearly. However, there may be something to be gained from acquiring and analysing customer satisfaction data continuously to enable a timely response to changes in customer satisfaction, and the same is true for other stakeholders.
In this situation, rather than collecting the entire data set in a period of 3–4 weeks each quarter, a small fraction is collected every week or two, resulting in a sequence of values (X1, t1), (X2, t2), … where Xi is the tree-structured observation from respondent i at time ti, i = 1, 2,…. The goals of the modelling and analysis are now slightly enhanced:
- (a)
obtain results similar to those in Table 1, where the weights convey a sense of the relative importance of the various factors in determining a customer's overall satisfaction with the superordinate attribute, and the summary ratings have associated estimates of precision, either in the form of standard errors or expressed as confidence intervals;
- (b)
report the results in the original scale;
- (c)
detect ‘interesting’ temporal changes, either in ratings or in weights;
- (d)
provide readily interpretable trend charts of what is going on.
Fisher et al. (2005) developed a method for modelling such data by using a Kalman filter, including a running R2 to normalize the regression coefficients as described earlier. An application of this method is given below in the context of people value surveys (Section 2.5).
2.4.4. Handling mistaken responses
Generally, in value surveys, respondents are asked to rate an enterprise on a set of statements where, the higher the rating, the greater the degree of satisfaction with how the enterprise is perceived to be performing. When the stakeholder group is the community, value is sometimes modelled as a trade-off between perceived benefits of a proposal, and perceived concerns. There is negligible prospect of misunderstanding (S) when respondents are asked to rate a list of prospective benefits. However, respondents can be confused about the meaning of a high versus a low rating when it comes to rating concerns, resulting in flipped ratings (11 – R instead of R). Fortunately, it is possible to handle such situations, by using the expectation–maximization algorithm to decide which responses should probably be reflected (R→ 11 – R), so that approach B can be adopted with some confidence. (See Fisher et al. (2008) and Fisher and Lee (2011) for a discussion of the project and of the expectation–maximization approach respectively.)
2.4.5. ‘Ordered text mining’
In addition to being asked to provide ratings, respondents are requested to provide reasons for their ratings of main branches and of overall perceived value. These data can provide valuable insight into what needs to be addressed, once an area of focus has been identified as a priority from the analysis of the quantitative data. With a large number of respondents, it is of interest to explore whether some automated procedure might suggest common themes among the reasons for low ratings.
There is a substantial literature relating to text mining and related methodologies (topic modelling, …) for studying unstructured text. Generally, these procedures have been applied to large blocks of text. The situation here is a little different: there are large amounts of small blocks of text (e.g. a maximum of about 250 characters), and there is a quantitative covariate (the rating) associated with each small block. There is some published work on this problem: see for example McAuliffe and Blei (2008). David Banks and his students Christine Chai and Min Jun Park have made a preliminary study of some value survey data by using topic modelling and obtained some encouraging results with the very limited data that were available (1158 words and 530 comments, after data cleaning); see Chai (2017). The small size of each comment, which is deliberately restricted to minimize the amount of time that is needed to complete a survey, presents a challenge to the technique.
2.5. Managing people value
For people, a value tree that has proved helpful in practice (as judged by the quality of model fits and by the improvements in the business resulting from actions taken in response to each round of survey results) is shown in Fig. 6. The concept of value is described as worth working here, with three main drivers: work, image and remuneration.
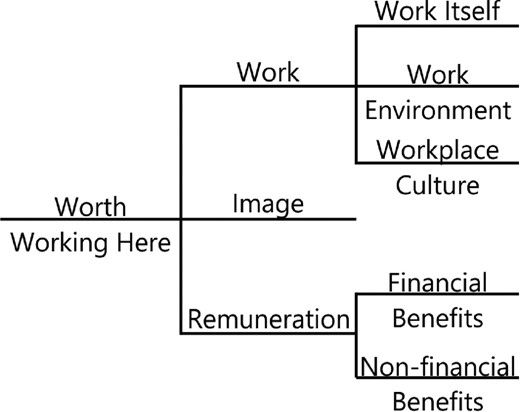
A possible high level structure for a people value tree, as the basis of a staff survey: the concept of overall people value is described by worth working here
Staff surveys based on this instrument tend to be rather shorter than traditional staff surveys, while still having the important property that it is possible to check statistically to ensure that no important attribute has been omitted.
For many enterprises, typical survey practice is to conduct a huge staff survey annually, or perhaps every 2 years. However, such a low frequency is useless for managing for improvement. At best, an enterprise can only react to bad news some time after things have started to go downhill and people have become sufficiently disenchanted that some have left … which has a very deleterious effect on the business bottom line. According to a rule of thumb that is used in the human resources area, unplanned staff turnover is conservatively reckoned to cost an enterprise at least 150% of the annual salary package for senior officers, and 100% for less senior people, and that is without counting the lost knowledge and knowhow. (See for example Lucas (2013) and Turnage (2015) for more discussion. Whereas academic institutions tend to have very low staff turnover, it is the author's experience that for other enterprises, such as building and construction companies, turnover may be of the order of 15–20%, and at least one leading events management company runs at 45%. And, at some nursing homes in the USA, turnover exceeds 100% for some categories of staff.) Thus there are considerable savings to be made by effecting a few per cent reduction.
Here, continuous surveying has much to offer. Fisher (2013), section 6.5, described such a process applied to a small government agency of about 100 people, where an initial survey of all the staff provided the basis for identifying some key improvement activities. The value tree that was used was a precursor to that shown in Fig. 6. The initial survey results for work and its drivers are shown in Table 2.
Profile for part of the initial people value survey for a government agency†
| Driver | Impact weight (%) | Mean rating (precision ±0.20) |
|---|---|---|
| Work itself | 50 | 5.5 |
| Work environment | 24 | 5.3 |
| Image | 26 | 5.9 |
| Work | 5.5 |
| Driver | Impact weight (%) | Mean rating (precision ±0.20) |
|---|---|---|
| Work itself | 50 | 5.5 |
| Work environment | 24 | 5.3 |
| Image | 26 | 5.9 |
| Work | 5.5 |
Impact weights have been normalized to add to 100%; the actual unexplained variation was 14%; mean ratings have been adjusted by a constant for confidentiality (from Fisher (2013), exhibit 6.8).
Shortly thereafter a continuous process was implemented involving sampling a few randomly selected respondents each week, to monitor the effect of improvement initiatives and to identify where next to focus attention. Fig. 7 shows the trends in the ratings and impact weights after a number of weeks of surveying. There are quite pronounced concave patterns in the ratings. Even more striking, however, are the trends in the relative impact weights. Whereas the initial impact of work itself was 50%, by the end of the period it had dropped to 0, whereas the relative importance of work environment had risen from 25% to 75%. During this period, the head of the agency had been summarily dismissed. People lost all interest in their jobs, and their overall feelings about their work were being driven largely by the poisonous work environment.
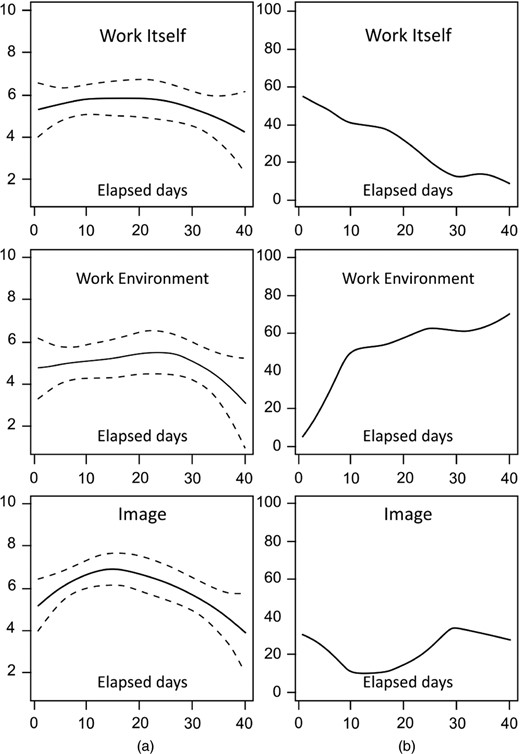
Results from a continuous monitoring people value survey, over a 3-month period (the sudden dismissal of the head of the agency has produced a pronounced effect in trends for both ratings and impact weights (from Fisher (2013), exhibit 6.9): (a) trends for ratings; (b) trends for per cent impact
The early availability of such information makes it possible for senior officers to act in a timely fashion to minimize the long-term damage, especially in terms of losing staff.
2.6. Managing partner value
Whereas the main structure of the value trees for customers and for people is reasonably generic in each case, the same is not so for partners or for the community.
For partners, the nature of the partnership has a critical effect on the structure of the value tree. Fig. 8 displays the very different sorts of partnership that are possible, from a simple transactional, or customer–supplier, model (where, if needs be, one can simply change supplier at possibly negligible cost) to a strategic relationship in which, effectively, the enterprise and its co-venturers live or die together. Possible partnership value trees for the three positions A, B and C in Fig. 8 are shown in Fig. 9.
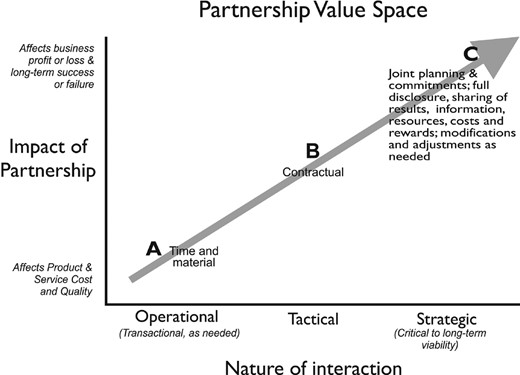
Partnerships can range from simple customer–supplier relationships to strategic relationships where there is complete mutual dependence: it can be helpful to distinguish three types of partnership, each with a characteristic concept of value (from Fisher (2013), exhibit 7.1)
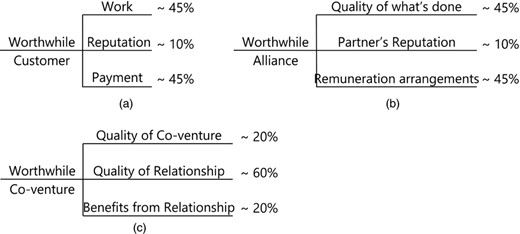
(a) Operational model, suppliers, (b) tactical model, alliances, and (c) strategic model, co-ventures: value means something very different for the different types of partnership; just as importantly, the relative importance of the three value drivers in each model reflects the very different nature of each type (from Fisher (2013), exhibit 7.2)
Apart from operational relationships where the number of suppliers can be huge, only small amounts of data are collected in assessing partnership value (there being relatively few partners), so no formal statistical analysis is possible. Instead, the emphasis is on the process for summarizing and presenting the responses in such a way that a common understanding can be developed and priorities assessed (see Fisher (2013), chapter 7, and Fisher and Peacock (2017) for details and another example), so this is not pursued further here.
2.7. Managing community value
Failure to engage in meaningful dialogue with the community before making significant investment has been the downfall of many enterprises (Fisher et al., 2008). This is particularly so in relation to environmental issues such as attempts to introduce genetically modified crops or embarking on new mining ventures. The concept of value will vary according to the circumstance. For example, the Invasive Animals Cooperative Research Centre conducted a 3-year community national weekly survey in Australia to monitor community attitudes to management of invasive species of animals, to inform the communication activities (Fisher et al., 2008, 2012). In this context, one possible community value tree has the structure that is depicted in Fig. 10.
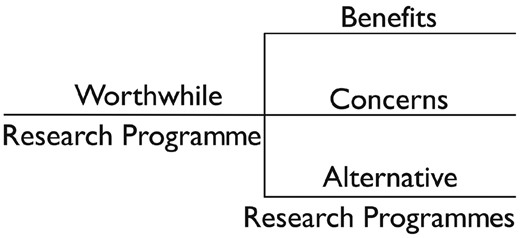
Example of community value and its drivers for an agency carrying out research into methods for managing pest animals: alternative research programmes refers to research by other agencies targeting different environmental issues; the concept of value is captured by the term worthwhile research programme
The study aimed to identify the critical factors determining the community's overall satisfaction with the research conducted by the Invasive Animals Cooperative Research Centre and then to track perceptions weekly with a view to identifying issues that needed to be addressed and to monitor the effect of communication initiatives. Again, the overall value score is of interest only in so far as it is possible to relate it to higher level business drivers (see Fig. 4) where, in this instance, the sorts of ‘loyalty’ questions of interest would take the form willingness to support widespread management of a specific pest (e.g. mice) by using a genetically modified virus to make females infertile, or willingness to support research into viral methods for control of other pests such as rabbits and foxes. This study used the same continuous survey modelling approach as described earlier.
2.8. Managing owner value
Who owns the enterprise?
Again, a variety of answers implies a variety of concepts of owner value. Here, we look at possibly the most complex of these: a publicly listed company whose owners are shareholders buying and selling their share of ownership on a stock exchange. This last point raises a new issue. For the most part, the owners will have only limited knowledge of the company that they own. They are not privy to detailed information about day-to-day operations, let alone to strategy and tactics about how the company seeks to gain and sustain competitive advantage. Rather, they have delegates collectively known as the board, who (supposedly) protect their interests in their investment and who do have privileged access to commercially sensitive information. So the term owner value for a publicly listed enterprise means, in practice, board value.
Fig. 11 provides a representation of value for such an enterprise. This was developed after extensive consultation with highly experienced business leaders (Board Chairs, Company Directors and Chief Executive Officers). It represents board value in terms of three principal drivers: return on resources invested, wellness and risk. (In this context, wellness refers to the health of an enterprise as characterized by the state of its relationships with its customers, its people, its partners and the community, the condition of its assets and the market view of the enterprise as an investment.) Return on resources invested is itself composed of returns (direct financial and other measures of wealth) and the annual business cycle (the business process that generates the returns). Risk has three processes as its drivers.
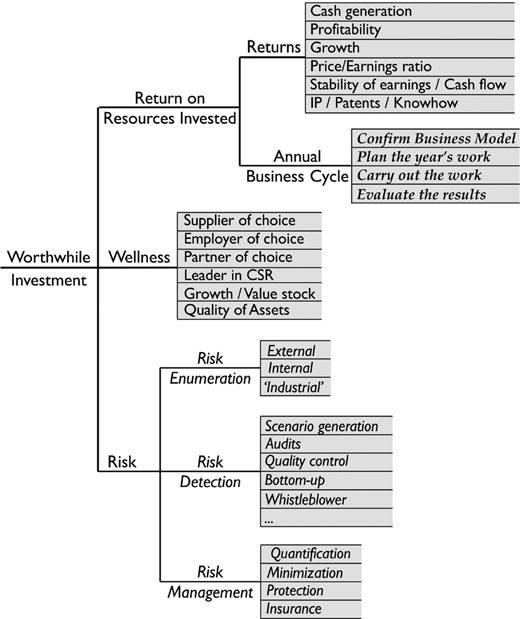
Example of a value tree for the board, as proxies for the owners: return is elaborated in terms of financial and non-financial performance quantities and assets, and the key business process which, for the board, is the annual planning cycle; risk is so important that it is elevated to the same status as return and wellness; items shown in italics are processes; the board value tree helps to identify the specific groups of lead indicators (shaded in the figure) that need to be monitored regularly (e.g. monthly or quarterly) by the leadership, to provide a concise overview of where the enterprise is headed (based on Fisher (2013), exhibits 9.2 and 10.1)
If this tree is accepted as a reasonable representation in terms of completeness of its coverage of important drivers and attributes of board value, it has two important implications. Firstly, the board value tree describes the scope of what regular board reports need to contain, to provide board members with the ability to exercise due diligence. And, secondly, the board value tree identifies items for which lead indicators are needed monthly or quarterly, namely those highlighted in Fig. 11.
In other words, an answer to the question of what should constitute the quantitative content in monthly or quarterly board reports flows logically from considerations of stakeholder value. This appears to be the first time that a logical basis for answering this question has been developed.
The actual format and content of the reports raise a host of presentation and statistical issues that go beyond the scope of this paper (see Fisher (2013), chapter 10, for a discussion) and provide plenty of opportunity for statisticians to be involved in devising lead indicators and cross-relating time series of lead and lag indicators.
Norbert Vogel, who has been involved in evaluation of enterprises against globally recognized business excellence award criteria such as the European Foundation for Quality Management and the Baldrige awards for over 30 years, has observed (personal communication) that the use of performance measurement to support decision making in enterprises is typically the area requiring greatest attention. It is arguable that this is attributable, at least in part, to the non-availability of a system for identifying and using appropriate performance measures. The system that is described here is itself consistent with the criteria and so would appear to offer a way forward for improved leadership and management of enterprises.
2.9. Other comments and comparative remarks
2.9.1. Objective and subjective measures
As will now be evident, the value and relative value metrics, which are the highest levels of metrics in the performance measurement system, are subjective: they are measures of perception.
In the context of so-called league tables when comparing institutional performance, Goldstein and Spiegelhalter (1996) commented that
‘In judging whether an institution has enhanced the welfare, health or performance of its members between their entry and exit, the term ‘value added’ has come to be used widely. This term is borrowed from economics, but it is difficult to justify in areas such as education or health.’
In fact, the term escaped its economics roots about 40 years ago: around 1980, it was being used by Richard Normann informally in the context of customers and, as we have seen, rather more formally a few years later by people at AT&T. The issue that arises here (and that recurs in the context of measuring research quality) is ‘Who is asking whether “the institution has enhanced the welfare, health or performance of its members”, and what is their concept of value?’. The answer to this can lead to a meaningful concept of value added.
2.9.2. Hierarchical models for value
Hierarchical models occur in many contexts in statistics, decision theory, operations research and elsewhere, and there are, in fact, similarities between the tree structures that are employed here and those in other settings. For example, the ‘analytic hierarchy process’ and ‘multiple-criteria decision analysis*’ are structured techniques for organizing and analysing complex decisions, based on identifying a number of supposedly relevant criteria. ‘Quality function deployment*’ also uses a tree-structured elaboration of customer requirements as a means of translating the customer requirements into engineering specifications and plans to meet those requirements, and it is thus relevant to understanding the attributes of the product branch in a value tree. Belton and Stewart (2002), page 66, explicitly described a concept of a value tree featuring the criteria and the competing options. Keeney (1992) devoted a whole book to ‘value-based thinking’. However, the goal of these methodologies is different from that of customer value management: they seek to make an ‘optimal’ choice from a number of options. In contrast, the purpose of customer value management is continuous improvement of value by on-going identification of process and system improvements (so that business processes appear in stakeholder value trees as a matter of necessity). With analytic hierarchy process or multiple-criteria decision analysis the number of decision makers is small. Typically, with customer value management, the number is large (the whole market). Further, customer value management provides assurance that no important factor has been omitted from consideration.
Although not explicitly tree structured, the ‘goal question metric strategies approach*’ offers a means of ensuring alignment of a specific set of metrics with higher level business goals and strategies. However, it does not lead in any obvious way to a complete performance measurement system satisfying any of the desiderata (a)–(c) in Section 2.1.
2.9.3. Balanced Scorecard
The Balanced Scorecard can now be positioned in a broader context. It reflects a philosophy of management that translates an organization's strategy into a set of objectives, measures, targets and initiatives and aligns the organization to them. As such, the Balanced Scorecard's vehicle for deployment throughout an organization is the organizational chart; consequently, an individual's performance metrics are aligned vertically through the chart to the objectives and strategies.
Unfortunately, as Myron Tribus has pointed out in many places (e.g. Tribus (1989, 1992)), work processes flow across an organization, not up and down, and so cut across internal organizational boundaries. For example, it is evident in Fig. 3 that the delivery process will involve, in turn, the marketing and sales, legal, service and accounts departments. People who are involved (should) have process ownership, accountability, responsibility and delegated authority relating to process flow, so the metrics that they (should) monitor, manage and report (should) relate to process outcomes and outputs and to in-process measures all of which, ideally, will be aligned with producing an excellent product and experience for the ultimate customer. Although it has a process perspective, the Balanced Scorecard says very little about process ownership, or about the differences between outcome, output or in-process measures, so appropriate alignment is likely to be due more to accident than to design.
There are several other issues, some closely related. The lack of distinction between outcome, output and in-process measures is a local manifestation of the failure to distinguish the three zones of measurement: strategic, tactical and operational. There is no explicit recognition of the need for relative measures that are benchmarked against what a company's competitors are doing, which is especially important at the strategic level. And there is no guarantee that there will be measures relating to all important stakeholders. If none of the strategies or objectives is concerned with partners, or the community, then there will be no Balanced Scorecard metrics for them. As a consequence, the board and senior leadership are not well placed to be duly diligent in managing all facets of risk.
Kaplan (2010) has argued vigorously against a stakeholder approach. However, the examples that are cited in Kaplan (2010) (pages 14–17) can equally well be regarded as issues of market segmentation and setting of priorities by leadership, and so do not fundamentally undermine the approach that is advocated here.
2.9.4. Six Sigma
In an interesting review of Six Sigma techniques, Montgomery and Woodall (2008) provided a neat encapsulation of the three ‘generations’ of Six Sigma described by Hahn et al. (2000):
‘Generation 1—mainly Motorola in a manufacturing setting—defect elimination, reduction of variability
Generation 2 (especially at GE)—relate these to projects and activities linked to improved business performance via improved product design and cost reduction
Generation 3—creating value throughout the organisation and for stakeholders’.
Thus our approach dovetails with third generation Six Sigma as a performance measurement front-end system.
2.9.5. Net promoter score
The net promoter score (Reichheld, 2003) is a now-ubiquitous stakeholder satisfaction metric for assessing customer satisfaction, supposedly rendering the whole customer value management process unnecessary. Fisher and Kordupleski (2019) explain why it is totally unsatisfactory.
2.9.6. Coda
With all the models for value established, we can see the principle of alignment enacted, as shown in Fig. 12. It brings to mind Sarasohn's archer (inset in Fig. 12), a cartoon used 70 years ago (Sarasohn and Protzman 1948, 1998) to capture the same concept in the context of management.
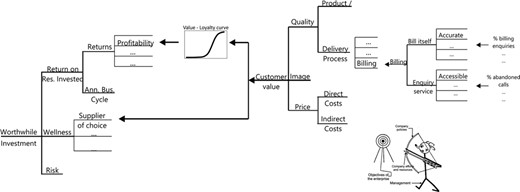
The main diagram illustrates the implementation of the alignment principle, from the operational level of in-process metrics to the ultimate measure of impact, the owner's perception of the enterprise as a worthwhile investment: only the customer value tree is shown, but the value trees for people, partners and community provide similar alignment (the figure is derived from the profit tree diagram in Kordupleski (2003), page 82); the inset is an adaptation of the Sarasohn archer, a cartoon drawn by Homer Sarasohn that appeared in the training manual (Sarasohn and Protzman, 1948) used to teach management to top Japanese executives just after the Second World War; the accompanying caption read ‘The policies created by management must direct the efforts and resources of the company to a defined target—the fundamental objectives of the enterprise’
3. Applying a stakeholder value approach in research environments
Multifarious assessment processes are associated with academic and research institutions, relating to teaching and learning and to research, and ranging from evaluation of individual courses to worldwide ranking of universities. The outcomes of such processes have very significant consequences for the income and reputation of universities, the funding and reputation of researchers and research centres, and the learning experiences and subsequent careers for students. Evaluating these processes from the perspective of our general approach suggests that there is plenty of opportunity for improvement.
This section provides a brief review of some of the work that is associated with measuring the quality of research work and of academic institutions, and then looks at some specific problems using the methods of the previous section.
3.1. Current assessment methodologies
There is a widespread desire to be able to rank individuals in a given discipline, university departments in a given discipline, research centres, universities, and so on, for purposes such as promotion, recruitment of faculty and students, and for allocation of research funding and other resources. This leads to a host of issues, including
- (a)
a (bureaucratic?) desire to avoid subjective measures,
- (b)
a (bureaucratic?) desire to use data that are ‘objective’ and easy to collect,
- (c)
a (bureaucratic?) desire for repeatability,
- (d)
a (bureaucratic?) desire to encourage efficiency and productivity,
- (e)
the cost of carrying out rankings,
- (f)
whether to use rankings or ratings
and others that will be mentioned shortly.
Naturally, competing methodologies abound for tackling issues (a)–(f) in such a way as to address the desired assessment goal. These are listed in the on-line supplementary material, together with some comments on the issue of bibliometrics. For now, we look at how the concepts that were described above can be applied to some examples of assessment in academic institutions.
3.2. Some specific cases
3.2.1. Assessing the quality of graduate programmes
Applying the Tribus paradigm immediately raises the critical issue ‘Who is asking the question?’ … to which the answer is, potentially, many different sorts of people, including
- (a)
current and prospective students,
- (b)
current and prospective faculty members,
- (c)
current and prospective employers—academic, non-academic,
- (d)
other people in the university, not least Deans, Provosts or Vice-Chancellors and other senior officers,
- (e)
university financial officers,
- (f)
granting agencies
etc. And their conceptions of what constitutes quality vary considerably. Fig. 13 shows plausible top level quality trees for the first three groups. Clearly, they are very different. If that is so, how likely is it that a simple set of measures of the ‘quality’ of a graduate programme can make sense? Quality, like beauty, is in the eye of the beholder.
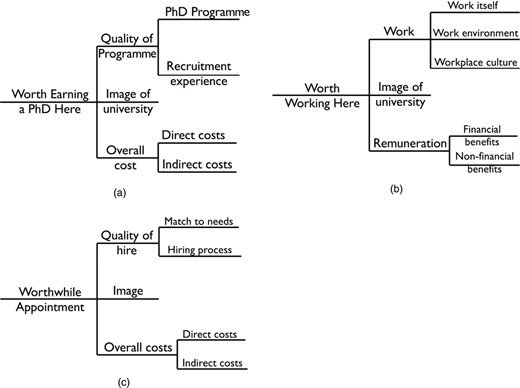
Plausible value trees—three examples of the differing types of people interested in the quality of a graduate programme: (a) a prospective student (quality of programme is a principal driver of value); (b) a prospective faculty member (quality of programme probably enters through work environment and image); (c) a prospective academic employer of graduates from the programme (quality of programme will be an important component of image); their views about what represents quality and metrics that might be useful in making a decision will differ markedly from situation to situation
There are several points to be made about the issue of how the various sorts of performance measures fit together, and in light of the discussion in Section 2.2.
- (a)
Not all performance measures are equal. For example, in the current context, there is a hierarchy of measures, leading to the measure of perceived quality (and, ultimately, of overall perceived value).
- (b)
There is a lead–lag interplay between hard and soft measures. In the transaction survey (Fig. 5), the internal measures are chosen as ‘hard’ (i.e. ‘objective’) measures that are likely to be good lead indicators of attribute ratings (perceptual measures of low level outcomes). Further, these hard measures are output process measures and so susceptible to management and improvement by applying standard quality improvement methods, leading to improvement in the perceptual measures.
- (c)
Good hard measures may be difficult to find. This point has already been noted in Section 2.3, point (e). It is also at the heart of the problem of measuring ‘quality’ of a department, school or university. Many obvious examples of bad hard measures come to mind immediately.
- (d)
Outcome measures are measures of perception (i.e. soft, or subjective, measures). Output measures may be hard or soft. Outcomes are rarely if ever one dimensional. However, viewed as measures of perception, they may be captured by a single measure once the key components (drivers) of the desired outcome have been identified.
Two further points flow from this: firstly, that the starting point for performance measurement must be to clarify the overall desired outcome and then to ensure alignment with this outcome; secondly that it is difficult to see how using a mixture of hard and soft measures to define the outcome makes sense.
3.2.2. Measuring the quality of applied research centres
The Australian Research Council's ‘Excellence in research in Australia’ (ERA) assessment process provides a potential basis for allocating research funding. An ERA assessment of a research group arrives at an overall summary in the form of a single number: 5 (‘Well above world standard’), 4 (‘Above world standard’), 3 (‘World standard’), 2 (‘Below world standard’) and 1 (‘Well below world standard’).
One of the ERA's stated objectives is to ‘identify excellence across the full spectrum of research performance’ (http://www.arc.gov.au/pdf/era12/ERA%20Factsheet_Nov%202012.pdf). However, it is evident that the process favours researchers publishing frequently in high quality peer-reviewed journals or authoring research monographs with leading publishing houses. Whereas some long-established Australian universities have a lengthy tradition of research that is amenable to such assessment, a number of younger universities have a charter with rather more emphasis on ‘doing research that benefits the community in this State’ (or words to that effect): in other words, useful applied research whose end customer is unlikely to be the reader of a peer-reviewed journal or book. Nonetheless, their researchers compete for Australian Research Council research funding.
One of these universities commissioned a research project to develop a way to assess the quality of applied research groups, with two goals:
- (a)
providing a defensible means of calibrating the work of the research group on the ERA five-point scale and
- (b)
identifying ways in which the university could work with the group to improve its ERA-type rating.
A process for doing this was developed and then carried out for one of the university's research groups. The university had already established three key criteria that they wanted to use, so an applied research group quality tree was developed with these as the main branches; Fig. 14. Each main branch will be examined in detail.
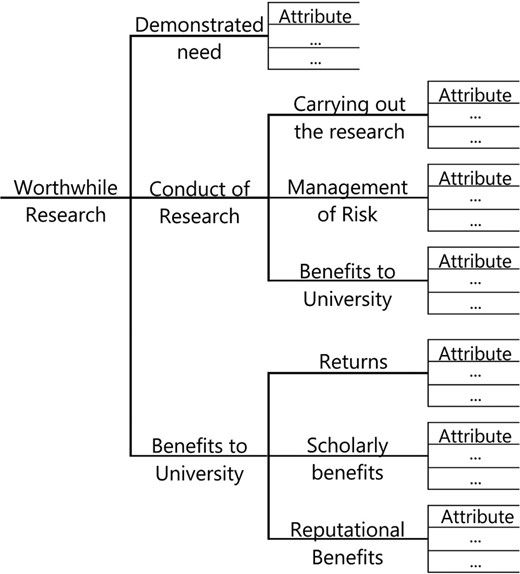
Applied research group quality tree as a basis for developing an overall ERA rating and for improvement
3.2.2.1. Demonstrated need
The purpose of demonstrated need is to provide evidence of beneficial impact of the university's research on the wider community. There are two distinct situations to be considered—
the principal beneficiaries are a few major investors in the research, for whom the impact is relatively soon after the conclusion of the research and
the impact is well removed in time and space, not infrequently a group in society who are completely unaware of the research being done
—and that calls for two quite different models.
For demonstrated need (a), overall investor value can be assessed by building a suitable version of Fig. 11, as shown in Fig. 15. Additionally, investors can be asked for business impact responses, such as willingness to reinvest with another project by this group or willingness to recommend this group to another investor for a different research-and-development project.
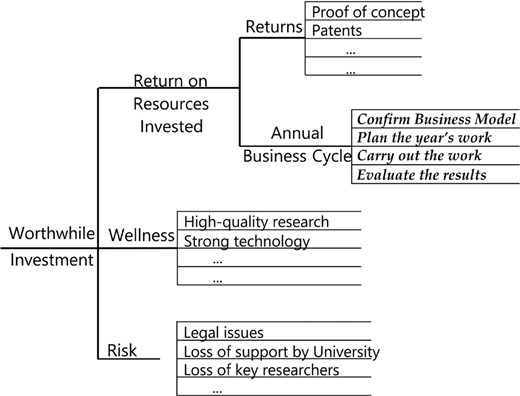
Possible model for investor value, for a small number of investors in a university research group
For demonstrated need (b), overall community value can be measured by building a suitable version of Fig. 10, as shown in Fig. 16. Selection of attributes may require discussion with large funding agencies.

Possible model for community impact of strategic research
3.2.2.2. Conduct of research
The purpose of this driver is to elicit evidence of how the Centre goes about identifying and responding to external needs. These processes will be the main focus of improvement activities. The attributes are identified by interviewing senior university officers.
3.2.2.3. Benefits to university
The purpose of this driver is to identify the range of benefits that are provided to the university by the Centre's work. Again, the attributes are identified by interviewing senior university officers. The research group is then requested to prepare a submission. This is not a lengthy document. For each major research programme, the group is asked to submit a brief report that provides
- (a)
information about the proportion of the Centre's resources involved,
- (b)
a summary of research outputs and outcomes—scholarly research, tactical research, research into dissemination and university-specific outcomes—and
- (c)
a two-page narrative that demonstrates the need for the research to be done, describes stages of the research, particularly how the research activities reach the end-users, and provides qualitative evidence of the impact of the work; and demonstrates that the university has gained benefit.
The next step is to collect data from key stakeholders. Initially, the university must decide on the relative importance of the three main drivers of value. Investors and funding agencies are then surveyed (usually by interview) to obtain an overall rating for the first branch in Fig. 14. (For example, investors would be asked to complete a survey based on Fig. 15, with the overall rating for worthwhile investment carried forward as the rating for demonstrated need in Fig. 14.) Senior officers of the university are requested to provide ratings for the other branches, and their responses analysed and summarized into a set of ratings. (Not all officers are necessarily in a position to rate all drivers and attributes.)
All this information—survey results, narratives and other support material (strategic plan, outputs from scholarly work, reports, products, …)— is made available to a review panel comprising internal and external assessors. The panel then develops its own ratings, and an overall assessment.
To use these results, start with the second objective of the process first. The overall ratings at the upper levels of the tree in Fig. 13 can be used for internal university benchmarking. As described in the context of managing customer value (Section 2.3), the results help to identify those improvements that will make the biggest difference to the overall rating of value.
There are various ways to determine an overall rating on the ERA five-point scale, for the first objective. For the investor model (demonstrated need (a)) one possibility is to conduct a very high level investor value survey for investors in research groups at a number of universities. The survey could be very short, using just the overall value statement and its three drivers in Fig. 14. It would also include the business impact statements in the description of demonstrated need (a) which would enable construction of value–loyalty graphs like that in Fig. 4. The ERA scores could then be allocated to specific intervals of the y-axis. With this information, the overall assessment by a particular investor could be calibrated. The second situation (demonstrated need (b)) can be handled along similar lines.
This overall approach provides some important benefits. For example:
- (a)
it examines, in a methodical way, all aspects of how the research group conducts its activities;
- (b)
it assesses the outcomes that relate to the group's outputs in terms of the stakeholders appropriate to those outcomes;
- (c)
bibliometrics such as h-indices, citation statistics and impact factors are not critical inputs to the process, but they may be adduced by the group as evidence of the quality of its outputs;
- (d)
the results for the overall process can be used to justify a claim for a particular ERA rating, when applying for funding for applied research when the research results are not assessed in the traditional way;
- (e)
the results allow the university to benchmark the groups in the university, to identify specific areas of focus for improvement for individual groups and also to identify more generic issues requiring a whole-of-university response.
3.2.3. Measuring research impact and research engagement
The Australian Research Council has been developing methodology to measure engagement and impact* in relation to the extent to which university research is being translated into economic, social and other benefits and to encourage more collaboration between universities and research end-users. It recently announced the results of a pilot evaluation of its methodology (Australian Research Council, 2017) by
‘a) Assessing engagement using a suite of quantitative indicators and supporting narratives. b) Assessing impact through narrative studies, with one impact study submitted per [specific research area].’
The overall rating for each was on a three-point scale: limited, emerging and mature. 11 indicators* were used to assess engagement, together with an optional supporting 500-word narrative, with the rating assigned
‘… [depending] on the assessment panel's holistic judgement of the evidence provided by the indicators and the narrative. There was no weighting applied to any particular indicator. Following assessment, the panel assigned a rating of either Limited, Emerging or Mature … ’
(emphasis added). In light of the discussion in Section 3.2.2, there appears to be a straightforward path to making a considerable improvement in this approach (e.g. Fisher and Peacock (2016)) to ensure alignment with what is really important to partners in an engagement, or to end-users.
4. A stakeholder value approach to managing efficient and effective delivery of government services
In scenario 3 from Section 1, the question ‘Who is the customer here?’ produces several possible answers, including the Minister and people at various levels in the department, not to mention the wider community who supposedly benefit from the proposed programme.
There is a large literature and there are many applications for programme evaluation. However, for the most part, these are post hoc evaluations against objectives and quantitative targets. The challenge is, preprogramme launch, to work out a set of performance measures to be managed during the course of the programme so that it can be conducted efficiently and effectively.
An outstanding example of failure to put suitable controls in place occurred with a stimulus package of initiatives that were implemented by the Australian Government in 2009 in an attempt to stave off a recession following the global financial crisis. One major initiative was to provide 2.7 million homes with free ceiling insulation to a value of $1600 each. However, the programme resulted in a disaster:
‘[The government] conceived of, devised, designed and implemented a program that enabled very large numbers of inexperienced workers—often engaged by unscrupulous and avaricious employers or head contractors, who were themselves inexperienced in insulation installation—to undertake potentially dangerous work’
(Hanger, 2014), with four people dying as a consequence. Even a moderate attempt to put appropriate performance measures in place to provide some assurance of efficient and effective delivery of the problem would almost certainly have avoided these rudimentary blunders.
How to establish an appropriate set of measures in a systematic fashion is still largely a greenfield site for researchers in performance measurement. The tension between a transient set of political masters wishing to introduce new programmes and a rather more permanent bureaucracy best suited to maintaining the status quo has meant that until relatively recently there has been slow progress with developing mechanisms that allow politicians coming into office to implement programmes that will fulfil their election promises. In a recent book (Barber, 2015), Michael Barber has canvassed the issues relating to the ‘process of delivery’ and described how they were addressed by the Delivery Unit that he established for the second Blair government during 2001–2005. (This work had lower priority and was subsequently discontinued under subsequent Prime Ministers.) Such performance measurement activities as have taken place have been focused mainly on attempting to measure outcomes. However, the delivery chain (as Barber terms the process that was developed by his Unit) would lend itself to identifying and deploying the sorts of performance measures that are needed to provide confidence that good outcomes would be achieved. Goldstein and Spiegelhalter (1996) referred to
‘… an increasing interest in the development of “performance indicators” as part of an attempt to introduce accountability into public sector activities such as education, health and social services, where the focus has been on the development of quantitative comparisons between institutions’.
The approach that is advocated in this paper implies putting in place a front end of metrics relating to the customer's (or customers’) views of quality or value to create essential alignment of the performance indicators with what is really needed, and to ensure relevance.
In Australia, the Federal Government's Department of Finance has been carrying out an investigation into performance indicators, including the possible use of non-financial indicators, as a response to the Public Governance, Performance and Accountability Act 2013. The primary focus of the Resource Management Guide (Australian Government, 2015) is on measuring the effectiveness of government programmes, with a brief commentary about efficiency, output and input measures. However, it is just a beginning and needs significant work simply to resolve such fundamental issues as appreciating the different roles of hard measures versus measures of perception and of input, in-process, output and outcome measures, being wary of measures of activity as measures of efficiency, the role of process capability in terms of setting targets, use of graphs to show trends, quantifying uncertainty, and so on.
5. Final comments and future directions
5.1. Performance measurement for organizations
The scope and nature of the quantitative content of a board report is a logical consequence of the approach that was described in Section 2. Although it is almost impossible to be prescriptive about details, the key elements, relating to lead and lag indicators for all important stakeholder groups, yield a concise and comprehensive overview of the status of an enterprise, showing its current situation and where it appears to be heading, and providing a basis for sound decision making (i.e. helping the leadership to answer the question ‘What should we focus on next, and why?’). The approach will work regardless of the type of enterprise.
Some statistical issues are not yet understood properly. These include
- (a)
developing statistical models for relationships between different stakeholder value trees,
- (b)
designing community value surveys that avoid the ambiguities that are associated with rating concerns and
- (c)
developing the theory of the Kalman filter to incorporate the information that the weights must be non-negative (see Section 2.5 and Fisher et al. (2005)).
5.2. Measuring research quality
Much work needs to be done. The approach that was sketched in Section 3 has shown promise in one application. However, in a world addicted to benchmarking, credible ways need to be found to relate the results from that approach to the currently popular methods for calibrating research, research groups and research institutions. Also, many more studies are required to explore, modify and possibly even to reinvent the implementation of a stakeholder view. A productive way forward may be to enhance the research excellence framework with some of the stakeholder value modelling described in this paper.
5.3. Performance measurement for government programmes
At least in the UK and Australia (as evidenced by Australian Government (2015)), the use of non-financial performance measurements to monitor delivery of government programmes if, indeed, any such usage is occurring, is rudimentary at best, e.g. binary responses to questions such as ‘Are we meeting programme milestones?’, or activity measures such as the number of training hours provided. Two major pieces of work are called for:
- (a)
development of a general approach to identifying and putting in place what would be, in effect, a web of performance metrics—strategic, tactical and operational, lead and lag;
- (b)
development of statistical modelling and analysis tools to apply in such situations, always being mindful of the need to provide results in a relatively simple and actionable format.
Thus, in all three cases and in many others that are not treated here, there is a pressing need for sound statistical advice. The work may not seem glamorous and the technical statistical research problems not immediately evident, but the benefits are potentially of great consequence for our society.
In a report discussing the British Government's use of performance indicators, Bird et al. (2005) noted that
‘Research is needed into the merits of different strategies for identifying institutions or individuals in the public release of PM data, into how new PM schemes should be evaluated, and into efficient designs for evaluating a series of new policies which are monitored by PIs.’
‘The Royal Statistical Society considers that attempts to educate the wider public, as well as policy makers, about the issues surrounding the use of PIs are very important. High priority should be given to sponsoring well-informed public debate, and to disseminating good practices by implementing them across Government.’
This paper seeks to broaden the scope of the debate that is suggested in the last sentence, and to suggest a general approach to making progress.
5.4. Stakeholder value and strategic planning
Alignment of an enterprise's activities with current and future stakeholder needs provides a reaonable basis for strategic planning. Fisher (2018) describes such a process and shows that metrics derived from on-going stakeholder value surveys provide a natural way to measure and monitor progress with the strategic plan. (The paper introduces, as an example, a graduate student value tree.) We note that the stakeholder perspective that is adopted in this paper is broadly consistent with that outlined in Eden and Ackerman (1998), chapter 7.
5.5. Culture surveys
There is widespread demand for measuring and monitoring culture in enterprises, whether it be relating to safety, risk, cyber security or, more generally, corporate culture. Many survey instruments in current use derive from work done in safety culture as it related to the aviation industry: see for example Sexton et al. (2006). However, recent experience with such instruments suggests that there may be much to be gained from exploring alternative approaches along the lines of those advocated in this paper.
6. Discussion on the paper by Fisher
Andrew Garrett (ICON Clinical Research, Marlow)
I am grateful to the Royal Statistical Society for the invitation to propose a vote of thanks to Nick Fisher for presenting a thought-provoking paper that challenges the statistics profession to engage to a greater extent in performance measurement across government, business and academia. It is, by its nature, a wide and varied topic and Fisher has presented a systematic approach to tackle performance measurement in relation to benchmarking, prioritization and monitoring. Fisher advocates an organizing principle coupled with the need to establish a link to higher level business drivers and to identify priorities based on effect size. In this respect it can be viewed as a paper directed towards the need to establish causation (directional through the value tree) and to estimate effect size(s). Fisher's paper is interspersed with examples, while also providing helpful historical context.
The Society's strapline is ‘Data, evidence, decisions’. Fisher is right to point out that, in relation to performance measurement, different stakeholders typically ask different questions, ask multiple rather than single questions and importantly are faced with different decisions. In that respect the data collected and the evidence assembled must be carefully considered such that those decisions are reliable. The visual aspect of the value tree is appealing therefore in terms of communicating and explaining the hierarchy and flow and, although perhaps not explicitly referenced, also helpful in identifying data that need to be captured.
Statistical thinking is often required to address potential bias (and to account for variability). In my experience in performance measurement typically there are specific issues to address when collecting subjective data. These include issues around the sampling frame including representation, the effect of missing data (including non-response) and whether the data collected are truly independent. For instance, determining the denominator when surveys are sent to multiple contacts within a customer organization, and when some customers forbid surveys, can all lead to simple aggregated scores where it is not entirely clear what is being estimated. Fisher has deliberately focused on establishing the link between output (described as typically objective) and impact (described as typically subjective) and so perhaps bias has understandably received less focus.
Fisher references some of the work around league tables in education and health. League tables are used by many in a predictive sense—taking the view that the future will reflect the past. Yet, examination grades, for instance, simply represent a set of results at a moment in time that can be summarized in various hierarchical ways, notably by school. They are a realization, never to be repeated, and reflect the infinite decisions previously taken—the questions set, the marking and re-marking, the choices of subjects to take, schools to join and entry requirements to meet: decisions made by students, parents, teachers, examination boards etc. So although data=all, understanding the drivers is key (as Fisher rightly points out) if the output is to be truly useful.
Fisher correctly distinguishes between lead and lag indicators and describes the lead indicators as the Holy Grail of performance measurement. That is my experience also, and lead indicators can prove elusive. Naturally the discussion turns to correlation and causation. Digitalization has resulted in the capture of our spending habits, and loyalty (in terms of repurchase) can be assessed on the basis of a wide range of features, employing machine learning on large realtime data sets. In this respect algorithms are regularly revised to maintain or improve predicted outcome—a short-termism that reflects an environment that is constantly changing. It is a means to an end—a decision. The traditional statistician's approach values parsimony and models that quantify relationships that bring understanding. When I look at Fisher's valuetrees and the linkages shown, I am drawn to the work of Pearl (Pearl and Mackenzie, 2018) in relation to causality, and I wonder whether performance measurement with its focus on decision making and lead indicators would benefit from the application of causal diagrams with the chain, fork and collider junctions, in particular to tease out and distinguish between association (‘What if I see?’), intervention (‘What if I do?’) and the counterfactual (‘What if I had done?’).
Moving briefly to the quantitative, Fisher uses modelling in Section 2.3 to determine the weights. I am drawn to Fig. 4 (the value–loyalty graph) but I wonder how portable it is and how stable through time. However, the benefit of Fisher's linkage to outcome (impact) is undeniable, notwithstanding the need to account for the inherent uncertainty here.
Nason (2018) in an editorial challenges the UK's teaching excellence framework (TEF) from a statistical perspective stating that ‘There is a lack of quantification and presentation of uncertainty throughout’ and that ‘So far as we can tell, the TEF does not actually assess any teaching’. To support Fisher's view further that performance management is worthy of statistical attention, Nason states
‘Overall, the RSS's view is that there is a real risk that the consultations’ statistically inadequate approach will lead to distorted results, misleading rankings and a system which lacks validity and is unnecessarily vulnerable to being “gamed”’.
Fisher has clearly hit on a hot topic and once again I would like to thank him for bringing it to the timely attention of the statistics profession.
Robert Raeside (Edinburgh Napier University)
This paper is a wonderful reminder of the need for rational and systematic thinking in decision making and its application to performance management. Although the operational research community built on the ideas of Ackhoff (1971) to approach problems and decisions with scientific thinking and the need to account for uncertainty, risk and decision maker bias (see White (2006)), Fisher has developed a comprehensive framework and has demonstrated the merit of applying this framework to improve commercial business, universities, non-profit organizations and government planning. Fisher makes a further contribution by applying statistical thinking to allow operational, tactical and strategic measures to be connected in a hierarchy and proposes that regression methods can be used to compute connecting weights. The approach proposed by Fisher goes beyond multicriteria decision making, which is stylistically similar to the value trees that Fisher presents in that weighting is more explicit and where data exist allows processes to ‘speak’ for themselves. An important benefit of the methodology given in this paper is that it is predictive and forward facing: a clear benefit to strategic thinking and securing sustainability.
However, concern remains about irrationality that arises among decision makers as experts still have inputs into the importance of different risks, although a statistical approach might help to mitigate this and how the value tree is formed and has many judgemental components. As in model building the approach of Fisher is dependent on variables (value components) selected and data used to determine weights. Cognitive psychologists such as Fishhoff et al. (1983) have shown that humans act irrationally in the assessment of risks, e.g. that air travel is perceived as dangerous but driving to the airport is not; this type of perception will impact on the success of Fisher's approach. Similarly, sociopolitical pressures mean that real discussion over the development of models, value trees and to the operation of the process will be compromised. It is clear that some individuals can exert undue influence on boards, research strategy and government expenditure. Added to this is that systems are often fragile when disruptive innovations appear such as high street retailer closures in response to Internet purchasing; in addition, the effect of disruptive individuals and the propagation of brand damaging messages via social media can wreck the best of strategies. Hence, awareness that people and society are potential weaknesses of systematic approaches is required but by incorporating data-driven validation these negative effects can be exposed and damage limited.
Fisher's work demonstrates that the importance of a systematic approach which is pursued offers businesses and other organizations a route to improvement and sustainability. But for this to work research is needed to develop methods to parameterize value trees and to incorporate measures that allow predictions to be made. Both statistical thinking and statistical communication in businesses and organizations need to be developed. These skills should not only be the province of leaders but should also be disseminated throughout the organizations, customers and stakeholders. In short society needs to become more appreciative of statistics and this points to the role for education. Sadly, many business schools fail to perceive the value of statistics and many programmes at undergraduate and postgraduate levels have become devoid of statistical input.
The vote of thanks was passed by acclamation.
Denise Lievesley (Green Templeton College, Oxford)
Warm congratulations go to Nick Fisher and thanks for addressing such an important topic (one of the few since Bird et al. (2005)). There is insufficient discussion of performance indicators (PIs) within statistical circles—perhaps their production and dissemination (particularly in the form of league tables) is seen as a political or a media rather than a scientific exercise. Ironically statistics and PIs are generally seen as synonymous, with the misinterpretation of PIs bringing statistics into disrepute.
Too often there is a lack of a distinction between decisions made entirely on a normative basis and those which have a more objective rationale. This particularly applies with regard to the weights assigned to the component parts of a performance framework.
I welcome Nick's structured approach to build a greater understanding of the value and the role of lead PIs and to improve their theoretical underpinnings.
My own experience of PIs comes entirely from being on charitable boards and from the public sector—their use in the National Health Service, in the university and research sectors, and internationally in the United Nations.
Unfortunately too frequently PIs are used as a stick rather than a carrot. They are not owned by those who are being assessed or called to account. My own experience of going undercover in the National Health Service was that those with responsibility for collecting the data often had little appreciation of why they were being collected and data were certainly not being fed back to them in a constructive way to help them to improve their services. The result is that data are manipulated to hit the target but in doing so they may completely miss the point.
The focus has often been on what can be counted at the expense of the tricky issue of measuring the quality of a service or product. This has caused problems in aligning the efforts of the people with the mission of the enterprise.
With large organizations it can be extraordinarily difficult to achieve an appropriate balance between local specificity, ownership and relevance and comparability over space (and time). We also need to balance timeliness (which is important if we want to take action to improve services) with frequency (with the inherent risk that we mistake noise for signal if we gather the indicators over too short a period).
Thanks again go to Nick for a framework to structure our thinking on these increasingly important issues.
David J. Hand (Imperial College London)
Professor Fisher is to be congratulated on drawing attention to a vitally important domain which would benefit significantly from more ‘statistical thinking’.
However, the title of the paper seems to be missing a word—perhaps ‘corporate’ or ‘organizational’—because, of course, the measurement of performance has been explored in very great detail in many different fields, ranging from athletics, to medical doctors, to racing cars. I myself have written a book on evaluating performance—of supervised classification rules. The implicit assumption that ‘performance’ must be about organizational performance perhaps explains the lack of reference to the very large technical literature on measurement theory.
In particular, no mention is made of the fact that measurements in the area of corporate performance are necessarily ‘pragmatic’ (as opposed to ‘representational’; see, for example, Hand (2004)) in that the two fundamental questions ‘what should be measured?’ and ‘how should you measure it?’ are opposite sides of the same coin, i.e. the ‘how’ of the second question is determined by the ‘what’ of the first, but also vice versa. Furthermore, the paper says that ‘the issue of performance measurement as it relates to an enterprise is really multivariate’. So, in measurement theoretic terms, corporate performance indices are what Alvan Feinstein called ‘clinimetric’ measurements, i.e. they seek to summarize multiple attributes into a single index, as contrasted with ‘psychometric’ measurements, which seek to measure a single attribute by using multiple items. It might be worthwhile to look at the development of clinimetric measurements in medicine and social science.
The paper says that ‘The Holy Grail of performance measurement is to find lead indicators of success’. I do not think that is quite right. Surely the aim is to find lead causes of success, along with ways of measuring those causes. Better still, one needs to construct a multiple-indicator, multiple-cause model (see, for example, Fayers and Hand (2002)).
I commend the author for warning about apparently desirable attributes that may have undesirable consequences elsewhere in the system. I have experienced this in the retail credit industry, in situations where the sales division and the risk division fail to communicate adequately. One must be wary of the law of unintended consequences, and a holistic perspective can be critically important.
I wonder whether there should be a further warning: that circumstances can change, so that what seems reasonable now, perhaps before the programme commences, may not be reasonable later.
Peter J. Diggle (Lancaster University)
I find the underlying philosophy of this paper compelling, and my comments are on points that might reasonably be considered to be secondary to the paper's core message.
Sampling frequency
In many contexts, data relevant to an organization's performance can now be collected in realtime. Should they also be analysed in realtime? More importantly, should decisions be made in realtime? In a market with multiple competitors, if all players make decisions in realtime, could this set up destabilizing feedback loops?
Communicating uncertainty
The conventional way to communicate uncertainty in an estimate (whether of performance or anything else) is to quote the standard error of the estimate, or something essentially equivalent such as a confidence or credible interval. In my own work concerned with monitoring spatial or temporal variation in health outcomes, I have often found that clinical or public health decisions are made in the context of a policy that is expressed along the lines of ‘if a particular condition C is met, a particular action should follow (or at least be considered)’. For example, in the UK, clinical guidelines for patients in primary care who are at risk of kidney failure is that, if a patient is losing more than 5% of kidney function per year (condition C), referral to specialist secondary care (action A) should be considered. I suggest that, in this case, an interval estimate of a patient's current rate of change in kidney function is not the right answer, and that a more appropriate measure of uncertainty to guide the clinician's decision is the predictive probability of C given all available data.
Modifiability
Any organization's performance can be affected by factors that, in varying degrees, the organization can or cannot influence. In presenting concise reports to boards, is there a way to quantify the modifiability of different factors?
Matthew E. Barclay (University of Cambridge)
I enjoyed and learnt from Fisher's description of his approach to performance measurement. In my experience, many attempts at performance measurement would be greatly improved by a clear focus on ensuring that measures are appropriately aligned. I also found the ‘value trees’ appealing and think that there are interesting parallels with the ‘programme theories’ used by social scientists to design and evaluate interventions (Rogers, 2008; Funnell and Rogers, 2011).
As an applied statistician working in healthcare, I do not think that I could simply apply the approach Fisher proposes to my own work with performance measures. There are four specific challenges that occur to me when I think about developing a performance measurement system for quality of care at a hospital.
- (a)
Patients cannot always give feedback. The subjective experience of end-of-life care is probably impossible to measure.
- (b)
Selection bias: some diseases have very poor prognosis, and the experience of patients who survive to give feedback may be very different from those who do not. For some diseases, such as lung cancer, half of patients die within 6 months of diagnosis: this is a major concern.
- (c)
Unintended consequences: for example, measurement of subjective experience during chemotherapy may incentivize the use of treatments with lower toxicity, even if they are simply less effective, leading to worse outcomes.
- (d)
Accuracy of subjective ratings: there are numerous examples of patients giving top ratings for patient experience, for example, despite recognizing serious problems with their experience of care (Dougall et al., 2000; Burt et al., 2017).
The following contributions were received in writing after the meeting.
Michael Barber (Delivery Associates, London)
The paper is valuable as a piece of rigorous analytical work looking at how large organizations including governments need to design and make use of performance indicators if they are to be successful. Fisher makes the important point that organizations need to think of the range of stakeholders they serve and to design performance indicator systems that meet the varying needs of all their stakeholders.
He also helpfully distinguishes between the ‘tactical’ and ‘operational’ measures, which are needed for internal purposes and the ‘strategic’ measures which need to be public and on which the organization will be judged publicly.
I have three comments all focused on how Fisher's framework might apply to governments, which is my area of expertise.
- (a)
The next evolution of my thinking about the effect of government expenditure and policy on outcomes is set out in my report for Her Majesty's Treasury (Barber, 2017) alongside the budget. This envisages government departments managing public money to deliver against four pillars. These are:
- (i)
achieving medium-term outcomes goals (such as reduced crime and improved public health);
- (ii)
controlling inputs so that money is spent for the purposes it was intended, distributed fairly and transparently and not wasted;
- (iii)
measuring the engagement of users of services, especially where this is critical to delivering outcomes (public health would be an obvious example), and also the perceived legitimacy of government expenditure among taxpayers and citizens; this would apply not just to public services but also to expenditure on matters such as defence and security;
- (iv)
measuring stewardship—tracking whether leaders at every level in public services are leaving the institutions they are responsible for in better shape than they found them: this set of indicators ensures that there is no incentive to succeed in hitting short-term goals by hollowing out the future.
- (i)
- (b)
The evolution of data systems, data analytics and data visualization provide rich opportunities for governments to present data to the public and to engage in dialogue with citizens about the agenda; although there is progress we are only at the beginning of making the most of this opportunity.
- (c)
However good the data and the performance management system, human judgement—in government systems that means political leaders as well as public servants and officials—remains crucial. The data inform but they do not decide, as Sir Dave Brailsford, leader of Team Sky, the cycling team, put it. In government there are huge judgements to be made based on values and on degree of ambition which can be informed by the data but not decided by them.
I hope these comments help to build on Fisher's excellent paper and indicate where the debate, at least in relation to government, may head in the future.
Christine P. Chai (US Department of Housing and Urban Development, Washington DC)
(The views and opinions expressed here are those of the author and do not necessarily reflect the view of the US Department of Housing and Urban Development or the US Government.)
I really appreciate that Professor Fisher cited my doctoral dissertation (Chai, 2017) and acknowledged the text mining work with my advisor David Banks and Min Jung Park (student collaborator). I am also delighted to see that performance measurement is receiving more attention from statisticians and other professionals.
This paper describes performance measurement surveys from a business perspective, which can potentially motivate interdisciplinary collaboration for management. I totally agree with the objective—to understand the customers’ and stakeholders’ views, so that the organization can identify and focus on the relevant performance indicators.
I have some comments on the paper, to elicit future research in performance measurement.
First, I am curious about how to analyse the ‘image’ of customer values because it is relatively difficult to quantify. In a customer value tree, the overall value is divided into three parts: quality, image and price. The tree shows several quantifiable elements for ‘quality’ and ‘price’, but the ‘image’ branch just says ‘attribute’.
Second, I am also interested in how the overall rating for value aligns with the attribute ratings. Assuming 1 is poor and 10 is excellent in a customer value survey, it is possible that someone rates an 8 on all elements but gives a 4 as the overall rating. It is also possible that someone rates a 6 on all elements but gives a 9 as the overall rating. I know the two examples are extreme, but I am interested in a prediction model from attributes to the overall score. In this way, agencies would know which attributes are more important to the customers, because of the direct influence on the overall rating.
Last, but not least, a current issue in measuring research quality is that certain types of research may be rated systematically higher than the others. In my opinion, rating calibration is needed to adjust for the category differences, and Guo and Dunson (2015) proposed a Bayesian approach to level the playing field across ratings of different movie genres.
In conclusion, what I like the most about this paper is the perspective—creating the connection between statistics and business management. The ideas for improvement are not only in statistical modelling, but also in understanding people insights. This is a well-written paper and I highly recommend it.
Robert Kass (Carnegie Mellon University, Pittsburgh)
Shortly before reading Nick Fisher's very nice summary of his stakeholder centric approach to performance measurement, I was perusing a wonderful autobiographical history, written by dozens of participants at one of the great medical research centres during its ‘glory years’ (roughly 1950–1975), and I was asking myself what lessons might apply to our current situation: even without acknowledging that our world is, as Fisher says, ‘addicted to benchmarking’, we still want the best possible environments for academic research. How do we create them? In the old days (50 years ago), it may have been possible to assess a research institute by surveying, at length, a handful of ‘the best people’ to obtain their opinions on quality, which would be consistent with one of Fisher's fundamental points, that the most useful performance measures are often perceptual. That old system had its flaws but, in any case, after exponential growth in the research population, together with drastically altered demands on time, it has become more difficult to implement. My takeaway of Fisher's message is this: it remains very worthwhile to discover perceptions, but we should remember that perception is ‘stakeholder dependent’ and, furthermore, becomes much more valuable when well defined, via carefully crafted questions based on specific goals, goals that must themselves be considered carefully. In fact, care in crafting can also reduce the effect of the flaws in the old system (e.g. the self-perpetuating ‘old boys’ network’).
There is, however, a familiar tension here. Some of the most important effects of research operate on very long timescales, and attempts to guide perceptual evaluation may feel artificial. There is an interesting parallel with education, where, for similar reasons, common metrics also make many educators uncomfortable. But cognitive psychology has contributed much to understanding the relationship between teaching and learning (Ambrose et al., 2010). By analogy, it would seem that a better understanding of research perception could also be valuable, and I am therefore wondering whether some of the important outstanding problems in performance measurement might be psychological, rather than statistical.
Thomas A. Louis (Johns Hopkins Bloomberg School of Public Health, Baltimore)
I enjoyed reading and learned much from Nick's thought-provoking paper. It generated comments on some of his points, and motivated discussion of ones that he left out or gave insufficient attention.
Kudos goes to Nick for emphasizing that goal identification must come first (the ‘why’), then data collection and analysis. Available data may not be up to the task and, usually, new data collection will be needed. Collecting appropriate data is important, but it is only one step towards the goal of improving quality, productivity or job satisfaction. Effective management is essential because, when used by amateurs, Balanced Scorecards and other instruments can produce a considerable overhead with little benefit, and possibly some harm.
Nick makes the implicit assumptions that all who provide information are well intended, and are not gaming the process; also that available information is relevant and accurate. These optimistic views are by no means always the actual situation; detection and prevention are essential. Data providers are generally quite savvy and will optimize. For example, hospitals ‘upcode’ case severity, substantially improving performance ratings (and income!). In US academe, the number of faculty is one input to ranking departments. Early on, the rules for counting were unclear, and in some instances faculty were given full membership in more than one department, upping the rating for each. Clear definitions, rules and audits are necessary to ensure equity.
Although problems associated with ratings based on journal impact factors are well known, they are still a mainstay. In this regard, I applaud the Australian Research Council's use of a holistic judgement. These and other examples highlight the broad relevance of Nick's warnings regarding unintended consequences in research environments (the easy driving out the good; the short term dominating longer term and suppressing fundamental research). Muller (2018) and Wilsdon (2015) have provided a host of cautionary examples in a variety of settings.
More kudos is deserved for Nick's highlighting the importance of statistical thinking, including that management should be future oriented, based on prediction. In addition, I would have liked to see some discussion of how to accommodate prediction uncertainties in decision making. Importantly, in designing and evaluating a performance measurement system, past may not be prologue; levels and associations seen in preassessment data may not persist post assessment. So, it is important to pilot all aspects, to assess unintended consequences and to employ causal analysis to sort things out.
Finally, Nick's specification of future directions is almost perfect; additional emphasis of the foregoing will achieve that state.
Fionn Murtagh (University of Huddersfield)
This is a seminal paper in regard to performance measurement, that is quantitative, and primarily for industrial practice. Section 1.2 also refers to education and academia, and government departments. At the end of this section, there is the general context (starting with the expression ‘What really needs to be measured?’) for quantitative performance measurement and its evaluation.
That performance can also be qualitative as well as quantitative is noted in Section 1.2 (third page). Section 2 pursues the extremely important domain of industrial practice and enterprises. Section 3 has the domains of quantitative performance measurement in research environments and, for this also in Section 4, the domains are government services.
The following comments are for the very complete incorporation also of qualitative performance evaluation. Section 2.7, ‘Managing community value’ may be also considered as the social context, and the need to contextualize all data analytics is very standard for correspondence analysis, also termed geometric data analysis. Section 2.9.2, ‘Hierarchical models for value’, makes note of the very important role of hierarchical modelling.
The following remarks may be increasingly relevant here, in relation to the predominantly quantitative performance measurement approach. Allin and Hand (2017) considered wellbeing and health with qualitative as well as quantitative perspectives, and Keiding and Louis (2016) also dealt with seminal issues in the currently standard requirements of ‘big data’ analytics. Given the importance of the hierarchical nature of complex systems (Murtagh et al., 2011), we consider hierarchical, and hence ultrametric topological, regression, where the hierarchical clustering is determined in the semantic, factor space mapping from the sources of data that are qualitative as well as quantitative. An approach to statistically quantifying impact in Murtagh et al. (2016) takes the initial action, mapped into the semantic factor space, and there is the quantitative relationship between that and the collective outcome in the factor space. In Murtagh et al. (2018), innovation from published research is hierarchically structured, and also stratification is aimed at, rather than pure ranking. The themes indicated here are worthy of further deployment and are to be complementary to the comprehensive approach set out in the current paper on quantitative performance assessment and evaluation.
Stephen Senn (Edinburgh)
I welcome this paper and the chance it gives the Royal Statistical Society to debate an important topic. Although the Society issued an interesting report on this subject some years ago (Bird et al., 2005), we statisticians have as a profession been complicit in implementing and even helping to devise the illogical and harmful approaches that have been successively used in various research assessment exercises and frameworks in the UK. Examinations such as those that Fisher has provided are valuable and I welcome the opportunity to debate the issues.
Here are four principles that resource allocation performance indicators ought to reflect.
- (a)
The output–input principle: outputs should be related to inputs.
- (b)
The aggregation principle: redefining the membership of units of assessment should not change their evaluation as a class.
- (c)
The reasonable smoothness principle: arbitrary boundaries should be avoided as far as possible.
- (d)
The transparent allocation principle: if such indicators are to be used for resource allocation it should be clear from the start how.
(Note that principles (a)–(c) are closely related to desirable properties of many statistical inferential procedures and principle (d) is related to statistical codes of conduct (American Statistical Association Board of Directors, 2018).)
Principles (a) and (b) taken together require that inputs and not just output–input ratios are recorded so that the reweighting can occur. This is because, if two units i and j having inputs Ci and Cj and outputs Pi and Pj are combined, the new output input ratio is
where Ri and Rj are the individual ratios.
Successive resource allocation exercises in the UK violated all these principles. For example, it was a requirement for researchers to have four assessable publications (in violation of principle (c)), resource allocation was made in highly non-linear and unpredictable ways (in violation of principles (b) and (d)) and inputs such as grant income already awarded were use as outputs (in violation of principle (a)).
I have one further comment to the author regarding assessing the content of graduate programmes. He lists six groups (a)–(f) who have an interest in graduate programmes but there is a very important seventh group and that is past students. This is because universities are certificating institutions. They thus owe it to past certified graduates to maintain their standards. This is easy to see because one can imagine the effect there would be on recruitment if students knew that a given university would lower standards once (but not before) they had obtained their degrees (Senn, 2007).
Dennis Trewin (Melbourne)
This is an important topic and I congratulate Nick Fisher for submitting this wide-ranging paper that should provoke the interest of more statisticians in the topic. In addition to the application of appropriate statistical methods for performance measurement, Fisher's paper raises some research questions for statisticians. Statisticians can add real value to performance measurement. As Fisher says,
‘Statistical thinking is very much part of the main line of argument, meaning that performance measurement should be an area attracting serious attention from statisticians’.
Performance measurement is used extensively but there are numerous problems, especially the use of key performance indicators (KPIs) including the following.
- (a)
KPIs are usually post hoc and only provide a partial, and often unbalanced, picture of performance, and frequently can be gamed. They really should only be used for monitoring and understanding.
- (b)
KPIs provide a disincentive to improve performance in areas which are not reflected by a KPI.
- (c)
KPIs can provide the wrong incentives often with disastrous consequences as has been demonstrated by a recent Royal Commission in Australia when used by banks for determining remuneration.
- (d)
KPIs generally provide little of the detail required to determine process and other improvements.
One of the strengths of the Fisher approach is that it overcomes most of these problems. Other strengths of Fisher's method are the balanced approach—it looks at value provided from the point of view of customers, staff, partners, owners and the community at large—and lead indicators of success. However, I do have some suggestions.
The Fisher approach could be quite complex and expensive. Perhaps that can be justified in some cases. However, I think it is worth having cut-down versions that provide the most important benefits for a client without the full expense.
The Fisher approach identifies the key areas for improvement. However, the information content is limited to the branches of a tree. There will often be a need to go further to identify the details to support improvements. It should be possible for the Fisher approach to be supplemented with approaches that provide additional information. One such approach my colleagues and I developed for use in quality evaluation at Statistics Sweden (Biemer et al., 2014). It is a balanced approach that examines attributes of quality such as knowledge, communication, expertise, compliance with standards and planning for and effectiveness of mitigation.
Tyler J. VanderWeele, Dorota We¸ziak-Białowolska, Piotr Białowolski and Eileen McNeely (Harvard University, Cambridge)
We fully support Fisher's call for more thoughtful selection of workplace and performance metrics, and aligning these with goals and outcomes. In our view, an often neglected set of measures that is strongly related to workplace performance is employee wellbeing or flourishing (VanderWeele, 2017). Companies often provide various health-related resources but neglect other aspects of employee wellbeing (We¸ziak-Białowolska et al., 2018). We have proposed elsewhere some simple questions to assess flourishing (VanderWeele, 2017) including not only physical and mental health, but also happiness and life satisfaction, meaning and purpose, character strengths, social relationships and financial security. We have begun to collect data concerning these questions from employees at Aetna, Owens Corning, Kohler, an international group of flight attendants, and factory workers in supply chains in Mexico, Sri Lanka, Cambodia and China.
Why should managers also care about these other aspects of employee flourishing? First, employees with high psychological wellbeing are less likely to leave, reducing costs due to turnover (Wright and Bonett, 2007). Second, aspects of wellbeing are associated with lower levels of distraction at work; and distraction at work can be a much greater loss to revenue than is absenteeism (Białowolski et al., 2018). Third, employees care about meaning in their workplace activities and would often be willing to trade off some income for greater meaning (Achor et al., 2018). Fourth, these other aspects of wellbeing can be drivers of business-related outcomes. There is evidence that life satisfaction has more powerful causal effects on job satisfaction than job satisfaction has on life satisfaction (Bowling et al., 2010). Whereas businesses often pay more attention to health, our own data (for instance on factory workers in Mexico) indicate that life satisfaction is as important as health for job satisfaction; social relationships are more important than health for co-worker performance; and character strengths (‘seeking to do good’) are more important than health for job satisfaction, work engagement and avoiding work injury (Fig. 17). In many cases, employer goals and employee desires will often, in fact, align. Although companies sometimes report on social impact in sustainability reports (Holme and Watts, 2000), we believe more attention needs to be paid to the flourishing of employees in the workplace. Improving employee flourishing is relevant as its own end, but it also improves business outcomes. The measurement of employee flourishing thus constitutes an important approach to help to align metrics to management's outcomes and outputs.
Wellbeing predictors of subsequent work performance outcomes (the results are from regressions of wave 2 business outcomes on wave 1 flourishing in the worker wellbeing longitudinal survey (We¸ziak-Bialowolska et al., 1992) from three factories in Mexico (N = 952); standardized estimates (log-odds for work injury) with p<0.05 are displayed; control variable were wave 1 work outcome, gender, age, education, being married, having children at home, taking care of an elderly person, job tenure (up to 1 year, more than 1 year and up to 5 years, and more than 5 years) and factory): (a) job satisfaction; (b) co-worker performance; (c) work engagement; (d) work injury
The author replied later, in writing, as follows.
I thank the discussants for their kind remarks and interesting and probing comments.
There are a few generic issues touched on by some of the discussants.
For brevity, the paper provided few details about reporting the results of a stakeholder value survey and using them for improvement. Further discussion of how to respond to survey results by using the usual processes of quality improvement can be found in Kordupleski (2003) and Fisher (2013), together with more details relating to data quality, choice of rating scale, sampling issues, bias, variability and the challenge of obtaining competitive data.
Over time, ratings, impact weights, attributes and the shapes of loyalty curves can change (see Fig. 7). Sampling frequency needs to relate to the likely pace of change in the target stakeholder group, and so to provide timely warning of such things as the efficacy of an intervention, the entry of a disruptive technology to the market, changes in work practices, new legislative or regulatory regimes, and so on. Sudden degradation of a model fit is a clear warning that a step change has occurred in the market and research is needed to identify new and important attributes. And loyalty curves need to be based on relatively recent data. Continuous sampling has much to offer, at little or no extra cost.
I agree with Dr Garrett that it would be interesting to explore the application of causal diagrams. In this regard, I would make two comments.
- (a)
From the point of view of improving a business, the discoveries of such analysis would need to be presented to leaders in such a way that they can understand what they mean, how they connect to the business bottom line and how they can be used to take action for improvement.
- (b)
There is now a large body of case-study evidence by Ray Kordupleski and others that the value management processes really do result in sustained business improvement.
Garrett also raises the issue of assessing teaching excellence. I believe that this area presents a huge opportunity to effect significant improvement in current practice to benefit both teachers and students. The emphasis needs to be as much implementing a process that is supportive of improvement activities as on the value survey itself, which is the means of measuring progress and identifying priorities.
Professor Raeside has reservations about the stability of the value management process, both in terms of the quality of the model (≡ value tree) and in how the results will be used by a leadership susceptible to buffeting by internal and external disruptive forces. These influences can be significantly mitigated in two ways: careful design of the survey instrument, and a process of reporting the initial results designed to gain everyone's ‘buy-in’, or ‘ownership’ of the results and consequent selection of priorities.
Professor Lievesley's comments about alignment and quality of service serve to underline a point stressed by Ray Kordupleski: customer value data need to be used by the leadership to focus the attention of the whole enterprise on the customer, rather than the ‘Texas target practice’ approach of collecting performance data in the hope that they might be useful. Unfortunately, not everyone is in a position to demand to know, a priori, how requested data are to be used (reporting?; improvement? …) before they are supplied, especially in environments such as academe and the National Health Service.
Professor Hand takes me to task (albeit gently) on several counts. On most, I think we shall have to agree to disagree. I think the generic approach goes beyond the organizational: the word ‘some’ inserted before ‘problems’ in the title would accommodate this without requiring a review of the vast literature to which Hand alludes. And my implicit approach (perhaps too implicit in this paper) to ‘some’ problems of performance measurement is to embed them in an overall process of continuous improvement in a way that provides beneficial impact for the ultimate stakeholder, a sound and actionable basis for leaders to select priorities for action and confidence that the most important factors affecting ultimate success have been accommodated, and that avoids distorting behaviours. In terms of this process:
- (a)
I am not persuaded that ‘what should be measured?’ and ‘how should you measure it?’ are opposite sides of the same coin;
- (b)
concerning ‘clinimetrics’, I am wary of psychometric instruments which, in my experience, do not have the quality attributes of this processes.
As to Hand's and my different views of the Holy Grail, I feel that mine is rather more realistic: lead causes at an enterprise level may be extremely complex mixtures of factors.
Professor Diggle makes an important point about communicating uncertainty. For brevity I had limited such considerations to noting the standard errors in Table 1 in the paper. However, in proper reporting, much richer information should be provided. For example, Fig. 18 is extracted from Fisher (2013) and shows something close to an ideal that could be readily realized in full electronic reporting.
Mr Barclay raises some interesting challenges in relation to measuring the quality of healthcare in hospitals. Of course, the approach I have described cannot be a panacea. However, it can help to ask some valid questions. For his first issue (patients cannot always give feedback), to what extent is feedback from family or friends a valid proxy? In case of selection bias, what is the overall ‘quality’ that one really wants to gauge? If it is patient satisfaction with overall efforts made to provide the best treatment, perhaps more data are available. It is difficult to comment on accuracy of subjective ratings, as the focus (at least in the case of Burt et al. (2017)) is at such a low transactional level (Table 3) that there may be a large amount of noise in the qualitative data arising from accompanying conversation. One might ask why two supplementary requests were not made:
- (a)
overall, please rate the doctor on the consultation;
- (b)
what was the main reason you assigned this rating?
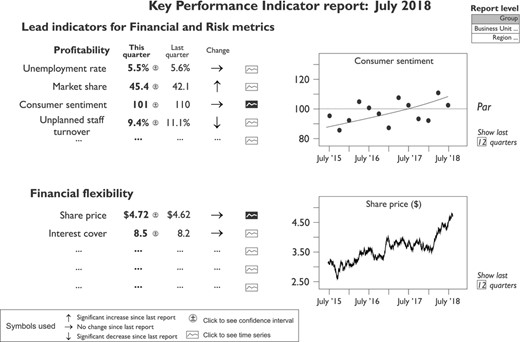
Small fragment of a putative electronic board report for key performance indicators, showing how variability is captured in various ways: standard errors are associated with each metric; the significance or otherwise of any change since the last report is indicated; graphs are available showing overall trends in time (after Fisher (1998))
General practitioner–patient interpersonal skills items†
| Factor | Thinking about the consultation which took place today, how good was the doctor at each of the following?: | |||||
|---|---|---|---|---|---|---|
| Very good | Good | Neither good nor poor | Poor | Very poor | Doesn’t apply | |
| Giving you enough time | ||||||
| Asking about your symptoms | ||||||
| Listening to you | ||||||
| Explaining tests and treatments | ||||||
| Involving you in decisions about your care | ||||||
| Treating you with care and concern | ||||||
| Taking your problems seriously | ||||||
Source: Burt et al. (2000).
This would have made it possible to estimate the relative importance of the factors in explaining overall patient satisfaction, to assess whether anything was missing, and perhaps provided additional insight into the actual reliability of the instrument.
I am most grateful to Sir Michael Barber for his elaboration of issues and opportunities for statisticians to contribute to improvement of government activities, and for reference to his report (Barber, 2017). In the report, his third pillar is worded
‘Pillar 3 highlights the need to convince taxpayers of the value being delivered by spending, and of the importance of engaging service users’
(emphasis added). We are in urgent need of real life situations where we can learn how to tackle these problems, learn what works and does not work, and learn how to capture and document this knowledge in a way that can be readily utilized by others. The long-term support and commitment of senior government officers and even senior politicians will be essential.
In response to Dr Chai's query about image, a simple example is afforded by thinking about brand image in the context of purchasing a car. Seemingly inconsistent responses arise most commonly when an important attribute has been omitted from the survey, and the rating of which would lie well outside the range of the others. Calibrating research quality for different types of research is a complex issue. I have sketched one approach; however, much more exploration is needed. As usual, it begs the basic question: ‘Who's asking?’.
Professor Kass has effortlessly pushed me out of my depth, since my knowledge of cognitive psychology is effectively non-existent. It is an extraordinary challenge to identify research results whose profound and consequential nature will be appreciated only after many years, and especially when the individual concerned is not a prolific publisher. To a small degree, we can recognize people who might discover deeper truths by, say, the sorts of questions they ask in seminars. Might a research project aimed at collecting retrospective data on researchers provide useful input for psychological study and also a basis for attempting direct distillation of lead indicators of profundity?
Professor Louis's cautionary remarks about data quality are appreciated. He is also right to emphasize the need to accommodate prediction uncertainties in decision making: again, much more needs to be done. Fig. 2 attempts a tiny step in this direction. And I thank him for his approval of future directions. We need more people helping with this!
Professor Murtagh sketches some dazzling possibilities and I shall be intrigued to see how he exploits the complementarity he hints at in his comments.
I thank Professor Senn for his comments about resource allocation performance indicators which are not a topic I have explored. And he is quite correct that, in the context of graduate programmes, past students certainly have a significant vested interest … and, of course, a different view of what constitutes value.
I was unaware of the work of Professor VanderWeele and his colleagues but thank them for drawing it to my attention. Their finding are broadly consistent with my experience in running people value management processes, which is hardly unsurprising since the people value tree captures much of what flourishing is seeking to measure. Note that a specific intent of the people value survey is to provide actionable reports that enable leadership to select priorities, so the survey statements need to focus on actionable items.
Mr Trewin questions the cost of full implementation and asks about cut-down versions.
- (a)
Applying the methodology to itself, one is led to ask: ‘For any given stakeholder group, what is the benefit received, for the price paid?’. For customers, marketing departments have a good understanding of the cost of a lost customer; for people, the cost of an unplanned departure (50–200% of their annual remuneration package (e.g. Fisher (2013), page 61); and so on. That said, some stakeholder groups and subgroups will be far more important than others, so priorities need to be set.
- (b)
And, yes, it is easy to develop stripped-down versions appropriate to, say, small-to-medium enterprises.
Trewin also remarks that the information content is limited to the branches of the tree. In fact this is not the case: see the first paragraph above.
Acknowledgements
The work that is described in this paper is based on research going back over more than two decades, and the author is indebted to a large number of people for their critical commentary, encouragement, input and support, as described in Fisher (2013), pages xxvii–xxix. Additionally, I am indebted to Adrian Baddeley, Michael Barber, Giuliana Battisti, Rudy Beran, Bruce Brown, Tim Brown, Peter Diggle, Peter Green, Xiao-Li Meng, David Morganstein and Adrian Smith for various forms of assistance in preparing the paper, and to the Editor and reviewers whose comments led to substantial improvements in the presentation.
References in the discussion
References
Appendix A: Glossary
Analytic hierarchy process
‘… A basic approach to decision making. It is designed to cope with both the rational and the intuitive to select the best from a number of alternatives evaluated with respect to several criteria. In this process, the decision maker carries out simple pairwise comparison judgments which are then used to develop overall priorities for ranking the alternatives. The AHP both allows for inconsistency in the judgments and provides a means to improve consistency’ (Saaty and Vargas (2001), page 1)
Australian Research Council definitions of engagement and impact
Engagement: the interaction between researchers and research end-users outside academia, for the mutually beneficial transfer of knowledge, technologies, methods or resources End-user: an individual, community or organization external to academia that will directly use or directly benefit from the output, outcome or result of the research Impact: the contribution that research makes to the economy, society, environment and culture beyond the contribution to academic research
Australian Research Council quantitative indicators of engagement
- 1,
Cash support from end-users
- 2,
Total HERDC research income (specified categories)
- 3,
Ratio of Australian Research Council linkage grants to Australian Research Council Discovery grants
- 4,
Research commercialization income
- 5,
Cosupervision of HDR students by research end-users
- 6,
Co-authorship of research outputs with research end-users
- 7,
Co-funding of research outputs with research end-users
- 8,
Patents granted
- 9,
Citations in patents to traditional research outputs
- 10,
In-kind support from end-users
- 11,
Proportion of total research outputs available via open access
Desiderata for satisfaction surveys (after Fisher (2013), page 63)
- 1,
Ask the right questions in the survey instrument
- 2,
Ensure that no important question has been omitted from the survey
- 3,
Find a way of benchmarking the results
- 4,
Survey sufficiently often to obtain timely data
- 5,
Ensure that the resulting data are actionable
- 6,
Ensure that the results support decision making, in terms of identifying where to focus improvement efforts to yield the maximum overall benefit
- 7,
Link results to higher level business drivers
- 8,
Relate overall satisfaction metric to subsequent overall student outcomes
Elasticity
In the context of this paper, the term ‘elasticity’ is used in its econometric sense of the percentage change predicted in a response variable when a given explanatory variable changes by a certain percentage
Goal question metric strategies
‘Goal question metric+’ strategies provide mechanisms for explicitly linking measurement goals to higher level goals, and also to goals and strategies at the level of the entire business (Basili et al., 2009)
Hoshin Kanri
Hoshin Kanri (or managing by policy, or policy deployment) is a process for deploying policies or, more specifically, the strategic plan throughout an organization to ensure alignment of the work performed by all employees with the plans of middle management, and these plans with the goals of the company
Multiple criteria decision analysis
‘… A collection of formal approaches which seek to take explicit account of multiple criteria in helping individuals or groups explore decisions that matter’ (Belton and Stewart (2002), page 2)
Performance measurement framework principles
Alignment: the enterprise's approach to measurement encourages alignment of people and systems with the organization's mission, vision and goals Process and systems thinking: measures should be linked appropriately with system and process monitoring, control and improvement
Practicability: at any level in the enterprise, there is a straightforward procedure for identifying the sorts of measures that need to be collected, and what needs to be reported
Process
A combination of people, equipment, materials, methods and environment that produce an output
Quality function deployment
A structured technique to ensure that customer requirements are built into the design of products and processes: see for example Park (2003)
System
A network of interrelated processes and activities working towards a common aim
