


Abstract
Developing optimal health communication strategies about COVID-19 and vaccines requires an understanding of the health literacy level of populations, trusted sources of information, and perceptions of COVID-19 messaging. We examined how health literacy is related to knowledge about COVID-19 among American Indian and Alaska Native (AI/AN) peoples.
We surveyed 788 AI/AN peoples at five Tribal health organizations between January and May 2021. We assessed health literacy using a 4-item health literacy index, and knowledge of COVID-19 in three domains: protection against contracting COVID-19; contracting COVID-19, and clinical manifestations of contraction. Questions also included rating trust of COVID-19 information sources and perceptions of messaging.
Participants had a high level of knowledge about COVID-19; however, health literacy was not significantly associated with any domain of COVID-19 knowledge. Participants perceived the most trusted source of COVID-19-related health information to be health professionals, followed by health clinics. Social media was the least trusted source of information. Tribal sources of information were rated on average higher quality than non-tribal sources.
AI/AN peoples had high levels of accurate knowledge about COVID-19 regardless of assessed health literacy. Information sources should include Tribal-led organizations and health professionals to increase uptake of COVID-19 messaging.
Introduction
Effective health messaging requires an understanding of who people trust to deliver messages and what information sources are most effective in generating behavior change.1,2 Public health officials continue to stress the need for health literacy,3 and culturally appropriate, effective health messaging to increase vaccination rates and knowledge about COVID-19.4,5 An understanding of present COVID-19 knowledge among a population must be assessed to determine what information needs to be presented and how it should be presented.6 High health literacy is an important factor in slowing the spread of COVID-19 and is associated with lower levels of vaccine hesitancy.7,8 Some populations have a lower level of health literacy, including older adults, racial and ethnic minorities, and people with low educational attainment.9
Numerous studies have examined how to effectively communicate about COVID-19 to the general public,10 but few have examined American Indian and Alaska Native (AI/AN) perceptions of COVID-19, trust in message source, or preferred information channels. To address these needs, we surveyed AI/AN peoples at five healthcare organizations primarily serving AI/AN patients in urban settings. Our overarching goals here are to examine health literacy among AI/ANs, knowledge of COVID-19, trust in and rating of information source. The results of this study could be used to develop culturally informed health communication material for AI/AN peoples.
Methods
Study design
Community Organizations for Natives: COVID-19 Epidemiology, Research, Testing, and Services (CONCERTS) was designed to identify and remove barriers to increased COVID-19 testing and vaccination among urban AI/AN peoples and to address health disparities related to COVID-19 in this population. As part of CONCERTS, we created and implemented a cross-sectional patient survey in partnership with five healthcare organizations that primarily serve AI/AN peoples in urban settings to identify barriers, facilitators, attitudes, and risk factors for COVID-19 testing and vaccination. These health organizations provide a range of services including outreach and referral, dental, primary, and behavioral health care, as well as health promotion and disease prevention supported by additional state, federal, and local resources. The urban areas served by these health organizations are Albuquerque, NM; Anchorage, AK; Denver, CO; Minneapolis–St. Paul, MN; and Wichita, KS. Their active unique patient populations in 2019 ranged from 1269 to 25 043.
Patients eligible for inclusion in the study were seen at any of the five health organizations within the year prior to the survey, were 18 years or older, AI/AN, and not diagnosed with Alzheimer’s dementia or related dementias (ICD-10 codes F01-04, G30, or G31). We stratified sampling by age (18–54 vs. 55 and older) to ensure older participants at highest risk of severe COVID-19 are adequately represented. Each clinic generated a list of eligible participants from their electronic heath records and randomly sampled 200 individuals in each age group. These individuals were invited to participate by their clinic using a multi-pronged strategy. Clinic patients with an email address in their respective health organization’s electronic health records were sent an invitation to participate in CONCERTS along with a link to an online REDCap survey. Patients without an email address were mailed invitations to participate. Patients received up to four reminders (emails or phone calls depending on the data collection mode) over a 14-day period. Our goal was to enroll up to 150 participants per clinic. If this sample size was not achieved through the first round of emails, letters, and phone calls, we selected a new random sample of eligible participants from the electronic health records of the clinic in question. Participants were enrolled from January to May 2021 and received $100 compensation. Of the 4603 eligible patients contacted for this study, 788 (17.1%) were enrolled and completed the survey. This study was approved by the Washington State University Institutional Review Board (IRB), local health organization review boards, and the Indian Health Service national IRB.
Survey development and measures
The survey was designed to collect comprehensive information about participants’ demographic characteristics, co-morbid health conditions, individual and structural social determinants of health, pandemic impact on physical and mental health, socioeconomic and quality of life status, experience with and attitudes toward COVID-19, and receipt of and structural barriers to COVID-19 testing and vaccination. Survey questions were generally developed using the NIH RADX-UP Common Data Elements and PhenX Toolkit.11 When necessary, questions were modified for cultural appropriateness, administration mode, or to better reflect study aims. After the survey was developed, experts at each healthcare organization provided feedback on the appropriateness and relevance of all survey questions to their clinic populations. The resulting survey has 164 questions and took on average 40 minutes to complete.
Measures
Independent variable: health literacy index
We used a modified version of a health literacy index (HLI) (Chew et al., 2008) based on responses to four health literacy questions. Participants were asked: “How often do you have someone help you read clinic or health-related materials?”, “How confident are you filling out medical forms by yourself?,” “How often do you have difficulty learning about your health because of difficulty understanding written information?,” and “How often do you have a problem understanding what is told to you about a health condition?” For each question, participants chose one of 5 levels, with 1 being “never” and 5 being “always.” We reversed the levels from the original levels for easier interpretation and summed the responses into a single score that ranged from 4 (“lowest”) to 20 (“highest”).
Knowledge about COVID-19
Our primary outcomes are three domains of knowledge about COVID-19. Participants were presented with a list of potential (1) actions that can protect against contracting COVID-19 (8 items), (2) main ways that people currently contract COVID-19 (6 items), and (3) signs or symptoms of having contracted COVID-19 (9 items). Participants were asked whether each item was a protective action, main way of contracting COVID-19, or sign or symptom in a yes/no or true/false format. The total number of correct responses was summed in each domain into a score used for our analysis. Possible protective actions included wearing a face mask, washing hands, and avoiding touching eyes, possible main ways of contracting COVID-19 included unhygienic preparation of food or droplets of saliva from people who have COVID-19, and possible symptoms included cough, shortness of breath, and muscle pain. A full list of items is presented in Appendix A1.
Trust in information sources
Participants were asked about their level of trust in 15 sources of COVID-19-related health information. Trust ranged from 1 “Strongly disagree” to 4 “Strongly agree.” The sources included: healthcare professional, the health organization they were a patient of, Indian Health Service or tribal healthcare organization reports or website, pharmacist, government organization, Tribal leaders, family members, non-profit organization, friends, religious or spiritual leaders, television, newspaper, radio, magazines, or social media.
COVID-19 communication quality
Participants were asked to rate federal, state, local, and tribal communications about the COVID-19 pandemic as “excellent,” “good,” “fair,” or “poor.” These were coded as, 1 “excellent” to 4 “poor.”
Qualitative information
Participants were asked an open question, “What information would you want to decide whether to get a COVID-19 vaccine?”
Demographics
Demographic variables included gender, age, highest level of education completed, and household income. Household income was determined by responses to the question, “In the past 12 months, what was your total household income including wages, Social Security, disability, and child support?” We provided 15 different options from under $10 000 to over $150 000. Due to small cell sizes, we collapsed responses into four groups that also roughly corresponded to quartiles (<$15 000, $15–34 999, $35 000–59 999, and ≥$60 000).
Statistical analysis
We used ordinary least squares regression with robust standard errors and HLI as the outcome. Demographic factors were included as predictors to assess the association between COVID-19 knowledge and mean HLI. We then used ordinary least squares regressions with robust standard errors to test if individuals with higher reported health literacy had higher knowledge of COVID-19. Models were adjusted for age, gender, and income. Trust in information sources and COVID-19 communication quality were described with means and standard deviations (SDs) or frequency distributions and percentages.
All quantitative analyses, including descriptive statistics, were conducted with inverse probability weights to improve the generalizability of our findings. Weights were generated to correct for sample selection based on age, nonresponse according to age and gender, and number of patients from each clinic. The weights were designed so each of the five clinic populations contributed equal information to the final estimates. All statistical analyses were performed using Stata 17.0.12
We used thematic analysis to analyze the open-ended question “What information would you want to decide whether to get a COVID-19 vaccine?” We use both inductive and deductive narrative analysis processes. A review of other literature on communication and perceptions of COVID-19 (e.g. Ellenwood et al., 2023; Boyd and Buchwald, 2022) was used to form the initial categories (e.g. side effects, efficacy).13 An inductive approach was also used because little previous research has examined AI/AN perspectives toward COVID-19. This approach included evaluating the data throughout the analysis process for any unidentified themes, revising the code book, and coding both on initially identified and emerging themes. The first author of this article primarily completed the coding, supported by two researchers who met to discuss inconsistencies in coding and need for additional themes. Quotes excerpted from longer responses are used to illustrate findings when appropriate.
Results
Descriptive statistics
Table 1 shows descriptive statistics for age, gender, educational attainment, and household income. Our weighted sample had a mean age of 44 years, 60% were women, 52% had a high school diploma or equivalent, and 24% had an annual household income of <$15 000.
Summary statistics on demographics and health literacy scores by sociodemographic characteristics.
| Percentage, N = 767 | Mean (SD) health literacy index score | |
|---|---|---|
| Age category | ||
| 18–29 | 19.1 | 16.9 (2.9) |
| 30–39 | 23.9 | 17.6 (3.0) |
| 40–49 | 23.7 | 18.0 (2.6) |
| 50–59 | 16.9 | 17.4 (3.0) |
| 60–69 | 12.3 | 16.7 (3.2) |
| ≥70 | 4.1 | 15.8 (4.4) |
| Gender | ||
| Male | 39.9 | 16.7 (3.4) |
| Female | 60.1 | 17.7 (2.7) |
| Highest level of completed education | ||
| Less than high school, no diploma | 7.8 | 15.3 (3.8) |
| High school graduate or equivalent | 51.8 | 17.1 (3.1) |
| Associate, occupational, technical, or vocational degree | 17.7 | 17.8 (2.5) |
| College degree or higher | 22.7 | 18.2 (2.6) |
| Total household income (past 12 months) | ||
| <$15 000 | 23.8 | 16.1 (3.6) |
| $15 000–34 999 | 28.2 | 17.3 (3.0) |
| $35 000–59 999 | 24.5 | 17.6 (2.7) |
| ≥$60 000 | 23.5 | 18.3 (2.2) |
| Total | 17.3 (3.0) | |
Health literacy index scores range from 4 (lowest) to 20 (highest). N is unweighted, all other statistics incorporate survey weights.
The mean HLI score was 17.3 (SD = 3.0). HLI scores were lowest among participants who were 70 years and older, lacked a high school diploma, and reported an annual income of $15 000 or less. There were 3 domains of COVID-19 knowledge. In the first domain, knowledge about actions that can protect against getting COVID-19, participants correctly responded to 7.3 (SD = 1.0) of 8 possible actions; the mean number of correct responses about main ways that people contracted COVID-19 was 4.2 (SD = 1.4) out of 6 possible ways; and the mean number of correct signs or symptoms of a COVID-19 was 7.9 (SD = 0.7) of 9 possible symptoms.
Knowledge of COVID-19
Table 2 shows our regression results. In Column 1, we present the associations between demographic factors and HLI scores using ordinary least squares regression. Women had a mean adjusted HLI score 1.11 points higher than men (95% confidence interval [CI] [0.50, 1.71]). Compared to participants with no high school diploma, those with a high school diploma or equivalent had a 1.66 points higher mean adjusted HLI score (95% CI [0.53, 2.79]), those with an associate/occupational/technical/vocational degree had a 2.20 points higher mean adjusted HLI score (95% CI [1.01, 3.39]), and those with a college degree or higher had a 2.17 points higher mean adjusted HLI score (95% CI [0.95, 3.38]). Additionally, compared to participants with an annual income of $15 000 or less, participants with household incomes between $35 000 and $59 000 had a 1.13 points higher mean adjusted HLI score (95% CI [0.23, 2.05]) and those with household incomes $60 000 or more had a 1.53 points higher mean adjusted HLI score (95% CI [0.67, 2.40]). We found no significant associations between age and HLI scores.
Regression results examining factors associated with health literacy index and domains of COVID-19 knowledge.
| Health literacy index, N = 705 | Protective actions against COVID-19, N = 658 | Ways people are getting COVID-19, N = 652 | Signs and symptoms of COVID-19, N = 657 | |
|---|---|---|---|---|
| Health literacy index age category | 0.02 [−0.01, 0.05] | 0.03 [−0.02, 0.07] | 0.02 [−0.01, 0.05] | |
| 18–29 | Ref | Ref | Ref | Ref |
| 30–39 | 0.56 [−0.42, 1.53] | 0.09 [−0.21, 0.39] | −0.01 [−0.44, 0.41] | −0.07 [−0.27, 0.13] |
| 40–49 | 0.78 [−0.07, 1.63] | 0.04 [−0.26, 0.34] | 0.12 [−0.28, 0.52] | 0.01 [−0.18, 0.19] |
| 50–59 | 0.39 [−0.59, 1.36] | 0.11 [−0.21, 0.43] | 0.10 [−0.36, 0.56] | −0.06 [−0.29, 0.16] |
| 60–69 | −0.26 [−1.18, 0.66] | −0.12 [−0.42, 0.17] | −0.21 [−0.63, 0.21] | −0.07 [−0.27, 0.12] |
| ≥70 | −0.97 [−2.30, 0.36] | −0.20 [−0.60, 0.21] | −0.01 [−0.56, 0.54] | −0.43 [−0.87, 0.01] |
| Gender is female | 1.11 [0.50, 1.71] | 0.18 [0.00, 0.37] | 0.01 [−0.27, 0.28] | 0.06 [−0.07, 0.19] |
| Highest level of completed education | ||||
| Less than high school, no diploma | Ref | Ref | Ref | Ref |
| High school graduate or GED | 1.66 [0.53, 2.79] | −0.29 [−0.63, 0.05] | 0.05 [−0.46, 0.56] | −0.04 [−0.40, 0.31] |
| Associate, occupational, technical, or vocational degree | 2.20 [1.01, 3.39] | −0.15 [−0.51, 0.22] | 0.05 [−0.55, 0.66] | −0.12 [−0.49, 0.26] |
| College degree or higher | 2.17 [0.95, 3.38] | −0.11 [−0.48, 0.27] | 0.45 [−0.13, 1.03] | −0.06 [−0.42, 0.30] |
| Total household income (past 12 months) | ||||
| <$15 000 | Ref | Ref | Ref | Ref |
| $15 000–34 999 | 0.87 [−0.06, 1.81] | 0.21 [−0.06, 0.48] | 0.29 [−0.10, 0.68] | 0.22 [0.03, 0.41] |
| $35 000–59 999 | 1.13 [0.23, 2.04] | 0.27 [0.00, 0.54] | 0.37 [−0.04, 0.79] | 0.27 [0.06, 0.49] |
| ≥$60 000 | 1.53 [0.67, 2.40] | 0.38 [0.10, 0.66] | 0.62 [0.17, 1.06] | 0.29 [0.09, 0.49] |
| Constant | 13.54 [12.07, 15.01] | 6.79 [6.20, 7.39] | 3.31 [2.44, 4.19] | 7.45 [6.86, 8.04] |
| R 2 | 0.1569 | 0.0705 | 0.0841 | 0.0581 |
Column 1 dependent variable is health literacy index score, and estimates are from ordinary least square regression. Columns 2–4 dependent variable are domains of COVID-19 knowledge and results are from ordinary least square regressions. 95% Confidence interval in parentheses, robust standard errors were used in all regressions. **P < .05, ***P < .01.
In Columns 2–4 of Table 2, we present the results of ordinary least squares regressions on the associations between HLI scores and knowledge of COVID-19. HLI score was not significantly associated with any domain of COVID-19 knowledge, contrary to our initial hypothesis.
Compared to men, women knew an adjusted mean 0.18 more ways to protect against COVID-19 (95% CI [0.00, 0.37]). Household income had a positive association with all three domains of COVID-19 knowledge. Compared to participants with a household income of <$15 000, those with a household income of $60 000 or more knew an adjusted mean 0.38 more protective actions against COVID-19 (95% CI [0.10, 0.66]), adjusted mean 0.62 more ways people are getting COVID-19 (95% CI [0.17, 1.06]), and an adjusted mean 0.29 more signs and symptoms of COVID-19 (95% CI [0.09, 0.49]). Age and education were not associated with any domain of COVID-19 knowledge.
There were three items in our measures of knowledge of COVID-19 that were potentially ambiguous. We conducted a sensitivity analysis in which we excluded those ambiguous items, and our results did not change (Appendix Table 2).
Trust in information sources and COVID-19 communication quality
Figure 1 presents trust in various sources of information. The most trusted source of COVID-19- related health information was health professionals (97% trusted or strongly trusted), followed by health clinics with (90% trusted or strongly trusted). Social media was the least trusted source of information (27% either trusted or strongly trusted). Mass media sources including television, newspapers, radio, and magazines all were less trusted than interpersonal sources such as friends and family or spiritual or religious leaders.
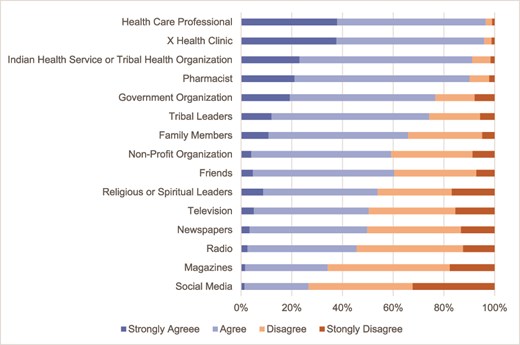
Trust in information sources related to COVID-19. Statistics include survey weights. X refers to the health clinic where the study was completed and was different for each site.
We also examined how different demographic groups assessed the quality of various institution’s communications about COVID-19 in Appendix Table 1. Institutions included federal health agencies, the Indian Health Service, the state health department, the city health department, and Tribal and urban Indian health organizations. The overall highest rating for quality of information about the COVID-19 pandemic was for the Indian Health Service (mean = 2.1, SD = 0.9). Other federal health agencies were rated the lowest (mean = 2.6, SD = 0.9).
Information about vaccines
A total of 160 participants responded to the question about information they would like to decide whether to get a COVID-19 vaccine. Of the 114 complete answers, 72 participants wanted information about side effects. For example, a participant requested information about “the short- and long-term effects of the vaccine.” Ten people wanted more information on the efficacy of the vaccine. A small number desired how it would affect people who had allergies, how the vaccine was tested, contents and differences between COVID-19 vaccines, and information on access and cost.
Participants reported hearing misinformation or disinformation: five had questions about how the vaccine affected fertility or caused sterility and three were concerned about poison or metal in COVID-19 vaccines. For example, “I’ve heard on social media that there was metal in the vaccine. I want to make sure it’s safe.” Two noted that “the vaccine could alter my Native American genetics using mRNA technologies.” The participants who expressed hearing that misinformation were not more likely to report higher levels of trust in social media, as only 1 of the 10 participants who expressed one of the concerns listed above responded that they trusted social media.
Discussion
We used patient survey data from five partner healthcare organizations that primarily serve AI/AN peoples in urban settings to examine the relationships between health literacy and knowledge about COVID-19, as well as trust in and ratings of various information sources. While health communication is not the only factor that leads to behavior change, it has been found to generate preventative behaviors and increase knowledge about a health risk.14 Numerous public health agencies, researchers, and policy makers have called for a greater need for understanding and developing health risk strategies.15 This is particularly true of COVID-19, as indicated by a statement of the World Health Organization’s director-general, “We’re not just fighting a pandemic; we’re fighting an infodemic.”16
Personal health literacy is the degree to which individuals can find, understand, and use information and services to inform health-related decisions and actions for themselves and others. According to the Indian Health Service “low health literacy is disproportionately burdensome to AI/AN peoples and their elders.”17 People with low health literacy skills often use more health services designed to treat disease complications and fewer preventive services than their counterparts with higher health literacy.18 In our large sample of AI/AN participants, we found higher educational attainment and income were both associated with a significantly higher level of health literacy and women had higher mean health literacy than men. These findings are aligned with the extant literature. A US survey estimated that 36% of adults have limited health literacy and these limitations are more common in those with lower levels of income and education.19 Differences in health literacy by household income may be due to the correlation between income and education, but we found education was not associated with greater knowledge of COVID-19, while income was. Speculatively, this may be due to the salience of COVID-19 for the workplace, as employment and household income are linked. Future studies are warranted to disentangle education and income effects in health literacy among specifically AI/AN populations. Regarding gender differences, some other studies report that women have higher health literacy than men,20 but some other studies do not find meaningful gender differences,21 suggesting such differences may be due to contextual factors like culture. While our study does not directly examine why AI/AN women might have higher health literacy than men, possible explanations supported by findings in other populations include greater familiarity with navigating healthcare systems and gender differences in expectations to care for sick family members.22
We hypothesized that higher health literacy would be associated with higher knowledge about COVID-19, as has been found in the general US population.23,24 However, in our study, health literacy was not associated with knowledge of COVID-19. Importantly, we found a high level of COVID-19 knowledge in all domains, meaning that the lack of an association between health literacy and COVID-19 knowledge reflects that individuals with lower health literacy had high COVID-19 knowledge as well. While our study does not address why we did not find a link between health literacy and COVID-19 knowledge, more research on why COVID-19 specific health messaging among AI/AN peoples appears to have been successful may be beneficial for improving health literacy in other domains. We found that women had significantly higher knowledge of actions that can protect against COVID-19 than men among all three domains of COVID-19 knowledge.
Trust in the source of information is crucial in developing and delivering health communication messages,25 particularly about COVID-19.26 Virtually all participants stated that health professionals were a trusted source, with trust in their clinic rated only very slightly lower. AI/AN populations also trusted information from health professionals on Alzheimer’s disease and cardiovascular disease.27,28 As trust is high, further messaging on COVID-19 and other pressing health topics could be delivered by these healthcare professionals and clinics.
Like in studies of the general public which find social media to infrequently be a trusted source of information,29 we found social media was the least trusted information source in this study. While we found that some participants reported hearing misinformation about vaccines, this was not more prevalent among participants who reported higher levels of trust in social media. This was true even in some cases where participants directly identified social media as the source of misinformation that influenced their decision-making around vaccination. There is, in general, a dearth of research on the role of social media in health communication in AI/AN communities during the COVID-19 pandemic. A 2022 study of a 1-year Twitter campaign to inform AI/AN audiences about healthy behaviors COVID-19 identified attributes of social media messaging which can improve engagement,30 demonstrating ways in which social media can be used to foster positive outcomes. Further research should investigate the role of social media in spreading health misinformation in AI/AN communities, even among individuals who do not express high levels of trust in social media.
On average, all agencies were rated “good” at communication about COVID-19, with several subtle differences in rating. Tribal organizations (including the Indian Health Service and Tribal and urban Indian health organizations) were rated higher than non-Tribal organizations (including federal health agencies and city and state health departments). This is consistent with other studies that concluded messages from Tribal sources are perceived as higher quality and are more trusted than non-Tribal sources.31 Because Tribal sources have been rated as higher quality, messaging about COVID-19 and vaccinations emanating from these sources may be beneficial.32,33
Despite a high COVID-19 vaccination rate among AI/AN peoples, concerns about the vaccine lingered as shown by the open-ended responses regarding questions of efficacy, side effects, and testing of COVID-19 vaccinations. Studies of the general US public found concerns about side effects, including fertility, and allergic reactions.34,35 In a study of the Nimmipuu Nation located in the USA, AI peoples were concerned about the potential of negative side effects, and this influenced if they would get vaccinated.36 Furthermore, consistent with other US populations,37 study participants were worried about metal in COVID-19 vaccinations or that vaccinations cause infertility, as well as AI/AN peoples-specific concerns such as mRNA affecting genetics.
Certain limitations should be acknowledged in the context of this study. First, the five Tribal healthcare organization sites primarily serve AI/AN peoples in urban settings and are not representative of sites and AI/AN peoples residing in rural and/or reservation areas. Second, participants differ from non-participants in unknown ways, such as socioeconomic status, health behavior, and health status among other factors, limiting generalizability to the latter and to whole populations.38 Third, our response categories for trusted sources were not precise. For example, we did not inquire if participants interpreted mass media as large national US news sources (such as the New York Times), or AI/AN-specific sources (such as Indian Country Today). Finally, this study does not delve into what information sources on COVID-19, vaccinations, or health information are actually used, limiting our ability to inform messaging strategies.
Effective communication has been shown to influence proactive health measures, such receiving COVID-19 vaccinations, ultimately reducing COVID-19 mortality and morbidity. Our results on health communication pertinent to COVID-19 and vaccinations can be used to design and deliver COVID-19 and vaccine messaging to AI/AN peoples, using trusted sources that have perceived high quality. Future research could include examining misinformation and disinformation about COVID-19 or other health risks in AI/AN communities.
Acknowledgments
We thank the research participants who shared their thoughts and intentions about COVID-19 testing with us. The authors also acknowledge Katie Nelson, MS, Odile Lallemand, MPH, and Carolyn Noonan, PhD, for their boundless energy, incomparable organizational skills, and enthusiasm. We also thank the staff and leadership of our healthcare organization partners, Southcentral Foundation, Denver Indian Health and Family Services, Indian Health Board of Minneapolis, First Nations Community Healthsource, and Hunter Health Clinic for their collaboration, insights, and responsiveness, and most importantly their trust.
Conflict of interests
The author(s) declared no potential conflicts of interest with respect to the research, authorship, and/or publication of this article.
Funding
This work was funded by the National Institutes of Health (U54MD011240-05S1).
Amanda D. Boyd, Professor
Austin Henderson, Assistant Professor
Azhar Uddin, Assistant Professor
Solmaz Amiri, Assistant Professor
Richard F. MacLehose, Professor
Spero M. Manson, Professor
Dedra Buchwald, Professor
