


Abstract
This study aimed to quantitatively confirm the effects of dental specialists’ work and stretching on musculoskeletal pain.
The pain pressure threshold was divided into five parts (neck, shoulder, trunk, lower back, and hand/arm) of the upper body and measured at 15 muscle trigger points. The pain pressure threshold before and after work was measured, and 30 min of stretching and rest were stipulated as an intervention.
The pain pressure thresholds reduced significantly in all muscles after work (P < .05). In the stretching group, the pain pressure thresholds increased significantly in all muscles (P < .05). In particular, the iliocostalis lumborum (lower back), rhomboid (trunk), transverse carpal ligament (hand/arm), levator scapulae-superior angle (neck), and upper trapezius (shoulder) muscles showed the greatest decrease in pain pressure threshold after work and the greatest increase after stretching.
Stretching helps immediately relieve musculoskeletal pain in dental professionals and can prevent and manage work-related musculoskeletal disorders.
INTRODUCTION
Work-related musculoskeletal disorders (WMSDs) include pain or damage to muscles and surrounding body tissues in the neck, shoulders, back, arms, and legs. WMSDs increase rapidly owing to changes in the industrial structure and social environment, causing a decline in work productivity, work-related accidents, work satisfaction, and quality of life.1 It is reported that this occurs in various occupational groups and causes economic damage to individuals, organizations, and society as a whole. WMSDs indicate particularly high risk for healthcare professionals,2 and their causes, risk factors, and ergonomic interventions have been studied.3–5
Because WMSDs are greatly influenced by the working environment the causes in occupational groups in the same environment must be analyzed. From this perspective, dentists and dental hygienists who treat small mouths precisely and repeatedly are at the same risk. Dental professionals, such as dentists and dental hygienists, are at a high risk for WMSDs.6–8 Repetitive movements, improper working posture, excessive force, long-term treatment without rest, and static working posture are the causes of WMSDs.9,10 Because WMSDs in dental professionals can degrade the quality of patient care, the prevention and effective management of WMSDs is crucial in dental professionals. In particular, dental treatment is a physically and mentally demanding task, so experts emphasize the need to develop a WMSD prevention program for dental professionals.9 Representative physical preventive measures for WMSD include exercises such as stretching and professional massage to stretch and relax the muscles. Stretching reduces muscle tension, increases blood circulation, and increases flexibility such that the body can be moved comfortably.11,12 In addition, it is advantageous to apply to the work environment because it does not require special skills or equipment and is not limited by and space.
Pain is a major symptom of musculoskeletal disorders. Accurate evaluation of pain is essential for the diagnosis of musculoskeletal disorders. In other studies, self-administered questionnaires such as Nordic Musculoskeletal Questionnaire (NMQ) were mainly used as a method to evaluate musculoskeletal pain.1,4,7,8,10 Self-administration questionnaires, such as the NMQ, were developed for use in epidemiological studies and are subjective assessments comparing general complaints of the musculoskeletal system. In clinical practice, digital pressure palpation is used to quantify pain. The pressure algometry provides a quantitative value related to mechanical sensitivity to deep structural pain as a way to measure pain pressure threshold (PPT).13 The PPT is the point at which painless pressure stimulation changes to pain pressure sensation, and by measuring this, the effect of various treatments or interventions on pain can be confirmed.14 In previous studies, pain reduction was reported to be associated with an increase in PPT, and it was concluded that pressure algometry is a useful measure for diagnosis and treatment evaluation of musculoskeletal disorders.15–17
Therefore, we confirmed the change in pain by measuring PPT before and after work in dental professionals. Second, we investigated the immediate effect of performing stretching intervention after work. The purpose of this study is to help dental professionals prevent and reduce musculoskeletal pain.
MATERIALS AND METHODS
Participants
The study was approved by the Gachon University Research Ethics Committee (1044396–201 511-HR-056-03). The purpose and process of the study were explained to dentists and dental hygienists at two dental hospitals in a metropolitan area. All participants met the following inclusion criteria: 20–60 years of age, employed for at least 6 months as a full-time worker, working 6 hours or more per day, 3 days or more per week and right handed. Subjects with any history musculoskeletal surgery, severe musculoskeletal disability, and medical contraindication to undertake physical exercise, lack of consent for participation in the study were excluded. Further, subjects had not received or engaged in any other treatment before the study intervention. Sample size was calculated using G-Power version 3.13 (Informer Technologies, Dusseldorf, Germany). The effect size was set at 0.90; α-error at a probability of 0.05; and power at 0.85. Each group required a minimum of 21 participants.
Experimental procedure
In initial recruitment, a total of 54 participants volunteered for the study. They were randomly assigned to two groups of 27 participants each. The two did not participate in the intervention program due to personal reasons. Therefore, a total of 52 subjects were used in the analysis as the stretching group (n = 27) and the control group (n = 25). The participants who provided written informed consent were instructed to fill a questionnaire to provide details corresponding to their age, weight, height, working hours, and working days. The two groups did not differ in terms of the participants’ general characteristics (Appendix A). The PPT of all participants was measured on the right side before work, after work, and after the intervention. Thirty minutes after work, the stretching group performed neck, shoulder, trunk, lower back, and hand/arm-related stretching under the guidance of a clinical physical therapist, while the control group took a break. Pain pressure threshold (PPT) was measured by a single trained examiner to ensure reliability. All experimental procedures are shown in Figure 1.
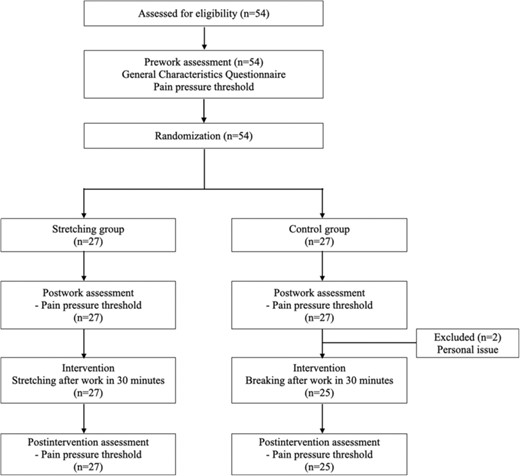
Study flow.
Algometric measurement
An Algometer (Somedic AB, Farsta, Sweden) was used to evaluate the PPT. The purpose and process of the measurements were explained to the participants. Measurements were obtained on the right side with the participant seated in a chair. After the algometer was placed perpendicular to a specified area, pressure was applied at a constant rate of 10 kPa/s. The participants were instructed to inform the examiner when unpleasant sensations or pain began, and the examiner recorded the value at the time of the participant’s expression. The algometer was measured at 15 muscle trigger points as follows: neck (occipitalis, levator scapulae-neck, levator scapulae-superior angle, splenius capitis), shoulder (upper trapezius, supraspinatus, anterior deltoid), trunk (rhomboid, pectoralis major-upper fibers, pectoralis minor), lower back (iliocostalis lumborum), hand/arm (wrist flexor group-forearm, wrist extensor, transverse carpal ligament, adductor pollicis). All measurements were performed by one examiner. The examiner measured twice consecutively at 1-min intervals. Two values were recorded and the average of the two values was taken as the final value.
Intervention
The stretching program was formed through a review of the relevant literature and consultation with professors of physical therapy and clinical physical therapists. Each part was stretched as follows: neck (neck stretches retraction, head rotation from side to side, head tilt from front to back, head tilt from side to side, neck protraction), shoulder (cross-chest stretch, triceps stretch, biceps stretch, reach for the sky, shoulder shrugs, pectoralis major stretch, side stretching, oblique muscle stretch), trunk (cat and camel, Latissimus dorsi stretch, mid-back stretch), and hand/arm (wrist flexor stretch, wrist extensor stretch, wrist radial stretch, forearm pronation stretch, finger flexion/extension). Stretching was performed after the end of all day work and under the supervision of a consulting physical therapist. The control group was allowed to rest for 30 min.
Statistical Analysis
The data were statistically analyzed using SPSS for Windows (version 19.00). Normal distribution was checked using Kolmogorov–Smirnov or Shapiro–Wilk tests. A t-test was used for the demographic characteristics of the participants, and a repeated-measures ANOVA was conducted to confirm the PPT according to the measurement time and intervention. A post-hoc test was performed for differences in PPT within groups using Tukey’s test. The difference in PPT between the two groups was analyzed using the t-test, and statistical significance was corrected using Bonferroni’s method. When assessing the significance of the effects, the P-value was set at <.05.
RESULTS
Neck
The difference in PPT between the two groups over time was significant for the occipitalis, levator scapulae neck, levator scapulae superior angle, and splenius capitis (P < .01). The neck-related muscles had a lower PPT after work than before work (P < .05). The stretching group’s PPT was significantly increased in all muscles in (P < .05) and only in the levator scapulae-neck in the control group. There was a significant difference according to intervention method (P < .05). In particular, in the levator scapulae-superior angle, the PPT increased the most at about 34.8% after stretching (P < .05). (Table 1).
Changes in the PPT of the examined neck muscle trigger points on the right side (Mean ± SD).
| Stretching Group (N = 27) | Control Group (N = 25) | Source | F | df | P | |
|---|---|---|---|---|---|---|
| Occipitalis (N) | ||||||
| Pre-work | 24.83 ± 5.98a | 22.32 ± 4.66a | Group | 10.394 | 1 | .002 |
| Post-work | 20.44 ± 5.63b | 17.16 ± 5.55b | Time | 34.337 | 1.542 | <.001 |
| Post-intervention* | 26.62 ± 7.91a | 17.64 ± 5.79b | G*T | 17.859 | 1.542 | <.001 |
| Levator scapulae_neck (N) | ||||||
| Pre-work | 32.07 ± 14.59a | 30.31 ± 10.4a | Group | 2.134 | 1 | .150 |
| Post-work | 21.04 ± 7.92b | 21.50 ± 9.37b | Time | 59.172 | 2 | <.001 |
| Post-intervention* | 30.95 ± 11.46a | 22.98 ± 8.93c | G*T | 12.995 | 2 | <.001 |
| Levator scapulae_superior angle (N) | ||||||
| Pre-work | 37.46 ± 15.73a | 35.94 ± 13.36a | Group | 1.325 | 1 | .255 |
| Post-work | 26.84 ± 10.64b | 24.82 ± 11.39b | Time | 40.483 | 2 | <.001 |
| Post-intervention* | 36.19 ± 11.18a | 25.60 ± 10.83b | G*T | 7.810 | 2 | .001 |
| Splenius capitis (N) | ||||||
| Pre-work | 26.53 ± 5.89a | 27.80 ± 8.00a | Group | 5.406 | 1 | .024 |
| Post-work | 21.31 ± 5.62b | 18.94 ± 5.80b | Time | 57.678 | 2 | <.001 |
| Post-intervention | 29.29 ± 5.36a | 19.51 ± 6.63b | G*T | 36.286 | 2 | <.001 |
Note: P by repeated-measures ANOVA.
*indicates a significant difference between the two groups determined by t-test.
a-cby Tukey analysis. Different superscripts indicate statistically significant differences at P < .05.
Shoulder
In the shoulder muscles, the change in PPT over time differed significantly between the two groups (P < .001). After all day work, the PPT of the shoulder-related muscles decreased (P < .05). In the stretching group, the PPT significantly increased in all muscles (P < .05), and in the control group, they increased only in the upper trapezius muscle (P < .05), showing differences according to the intervention method (P < .05). The PPT of the supraspinatus, which showed the greatest change after stretching, increased by approximately 24.1% in the PPT compared to post-stretching (P < .05). (Table 2).
Changes in the PPT of the examined shoulder muscle trigger points on the right side (Mean ± SD).
| Stretching Group (N = 27) | Control Group (N = 25) | Source | F | df | P | |
|---|---|---|---|---|---|---|
| Upper trapezius (N) | ||||||
| Pre-work | 43.67 ± 11.94a | 44.86 ± 11.73a | Group | 0.663 | 1 | .419 |
| Post-work | 34.05 ± 10.65b | 32.816 ± 10.97b | Time | 70.824 | 1.404 | .001 |
| Post intervention* | 41.56 ± 9.88a | 34.56 ± 11.07c | G*T | 10.577 | 1.404 | <.001 |
| Supraspinatus (N) | ||||||
| Pre-work | 42.06 ± 13.42a | 41.69 ± 15.46a | Group | 3.067 | 1 | .086 |
| Post-work | 33.48 ± 10.88b | 29.33 ± 14.80b | Time | 49.636 | 1.566 | <.001 |
| Post intervention* | 44.13 ± 10.50a | 30.36 ± 14.20b | G*T | 21.524 | 1.566 | <.001 |
| Anterior deltoid (N) | ||||||
| Pre-work | 26.94 ± 10.16a | 26.02 ± 8.31a | Group | 2.596 | 1 | .113 |
| Post-work | 19.99 ± 7.00b | 19.23 ± 6.25b | Time | 27.494 | 2 | <.001 |
| Post-intervention* | 29.10 ± 12.63a | 20.37 ± 5.54b | G*T | 11.190 | 2 | <.001 |
Note: P by repeated-measures ANOVA.
*indicates a significant difference between the two groups determined by t-test.
a-cdetermined by Tukey analysis. Different superscripts indicate statistically significant differences at P < .05.
Trunk
The PPT change in the rhomboid, pectoralis major, and pectoralis minor muscles over time differed significantly between the two groups (P < .001). After work, the PPT of all trunk muscles decreased (P < .05). The group that stretched after work showed a significant increase in PPT in all muscles (P < .05), while the control group exhibited no significant difference (P > .05), confirming that there was a significant difference depending on the intervention method (P < .05). In particular, the PPT of the rhomboid increased by approximately 34.7% after applying stretching, which was the greatest change (P < .05). (Table 3).
Changes in the PPT of the examined trunk muscle trigger points on the right side (Mean ± SD).
| Stretching Group (N = 27) | Control Group (N = 25) | Source | F | df | P | |
|---|---|---|---|---|---|---|
| Rhomboid (N) | ||||||
| Pre-work | 46.74 ± 13.85a | 44.50 ± 16.71a | Group | 3.505 | 1 | .067 |
| Post-work | 35.95 ± 13.55b | 31.50 ± 16.45b | Time | 51.512 | 2 | <.001 |
| Post intervention* | 48.44 ± 15.00a | 32.59 ± 16.03b | G*T | 19.283 | 2 | <.001 |
| Pectoralis major-upper fibers (N) | ||||||
| Pre-work | 30.15 ± 16.93a | 22.81 ± 5.69a | Group | 6.382 | 1 | .015 |
| Post-work | 22.57 ± 13.53b | 17.67 ± 5.21b | Time | 34.315 | 2 | <.001 |
| Post intervention* | 30.00 ± 17.54a | 17.70 ± 4.82b | G*T | 11.936 | 2 | <.001 |
| Pectoralis minor (N) | ||||||
| Pre-work | 31.02 ± 12.08a | 28.50 ± 7.64a | Group | 1.556 | 1 | .218 |
| Post-work | 21.16 ± 8.07b | 22.16 ± 7.69b | Time | 45.903 | 1.790 | <.001 |
| Post intervention* | 30.10 ± 11.68a | 22.62 ± 7.33b | G*T | 12.585 | 1.790 | <.001 |
Note: P by repeated-measures ANOVA.
*indicates a significant difference between the two groups determined by t-test.
a–cdetermined by Tukey analysis. Different superscripts indicate statistically significant differences at P < .05.
Lower back
In the lower back, the PPT change over time differed significantly between the two groups (P < .05). After work, the PPT of the iliocostalis lumborum greatly decreased (P < .05). After stretching, the PPT increased significantly (P < .05) compared to before, but there was no statistically significant difference in the control group (P > .05). (Table 4).
Changes in the PPT of the examined lower back muscle trigger points on the right side (Mean ± SD).
| Stretching Group (N = 27) | Control Group (N = 25) | Source | F | df | P | |
|---|---|---|---|---|---|---|
| Iliocostalis lumborum (N) | ||||||
| Pre-work | 66.17 ± 17.64a | 66.04 ± 15.39a | Group | 0.130 | 1 | .720 |
| Post-work | 51.53 ± 17.11b | 52.48 ± 16.15b | Time | 66.898 | 2 | <.001 |
| Post intervention | 59.74 ± 17.73c | 54.13 ± 16.06b | G*T | 4.051 | 2 | .020 |
Note: P by repeated-measures ANOVA.
a-cdetermined by Tukey analysis. Different superscripts indicate statistically significant differences at P < .05.
Hand & Arm
In the wrist flexor_forearm, wrist extensor, and transverse carpal ligament groups, the PPT change over time differed significantly between the two groups (P < .01). In both groups, the PPT of the hand and arm muscles decreased significantly after all day work (P < .05). After stretching, the PPT significantly increased in all muscles (P < .05), and the greatest change was observed in the transverse carpal ligament (27.4%, P < .05). After rest, it increased only in the wrist flexor_forearm (P < .05).(Table 5).
Changes in the PPT of the examined hand and arm muscle trigger points on the right side (Mean ± SD).
| Stretching Group (N = 27) | Control Group (N = 25) | Source | F | df | P | |
|---|---|---|---|---|---|---|
| Wrist flexor_forearm (N) | ||||||
| Pre-work | 34.90 ± 12.74a | 28.65 ± 9.61a | Group | 6.746 | 1 | .012 |
| Post-work | 26.05 ± 12.21b | 20.80 ± 8.91b | Time | 55.559 | 2 | <.001 |
| Post intervention* | 34.06 ± 12.53a | 22.84 ± 8.91c | G*T | 8.009 | 2 | .001 |
| Wrist extensor (N) | ||||||
| Pre-work | 27.93 ± 9.12a | 24.23 ± 7.23a | Group | 3.295 | 1 | .076 |
| Post-work | 19.80 ± 7.05b | 19.25 ± 7.20b | Time | 26.036 | 2 | <.001 |
| Post intervention* | 27.39 ± 11.81a | 20.22 ± 6.98b | G*T | 6.454 | 2 | .002 |
| Transverse carpal ligament (N) | ||||||
| Pre-work | 47.27 ± 14.10a | 45.00 ± 7.69a | Group | 2.062 | 1 | .157 |
| Post-work | 35.95 ± 15.32b | 34.60 ± 7.65b | Time | 50.072 | 2 | <.001 |
| Post intervention* | 45.80 ± 16.45a | 35.78 ± 7.62b | G*T | 9.636 | 2 | <.001 |
| Adductor policis (N) | ||||||
| Pre-work | 34.84 ± 11.79a | 37.48 ± 9.48a | Group | 0.361 | 1 | .551 |
| Post-work | 24.89 ± 7.56b | 27.77 ± 9.21b | Time | 53.015 | 2 | <.001 |
| Post intervention | 31.24 ± 10.36c | 30.15 ± 9.21b | G*T | 2.709 | 2 | .071 |
Note: P by repeated-measures ANOVA.
*indicates a significant difference between the two groups determined by t-test.
a–cdetermined by Tukey analysis. Different superscripts indicate statistically significant differences at P < .05.
DISCUSSION
In this study, PPT was evaluated using pressure algometry before and after the dental professionals’ work. After the experimental group stretched and the control group rested, the PPT changes of the two groups were objectively confirmed.
The dental specialist’s PPT was significantly reduced in all muscles after work. Among the 15 muscles, the iliocostalis lumborum (lower back) showed the greatest change, and the rhomboid (trunk), transverse carpal ligament (hand/arm), levator scapulae-superior angle (neck), and upper Trapezius (shoulder) were in the top 30% in terms of the change in PPT. Previous studies have also identified the neck, shoulder, back, and hand/arm as the most common sites for WMSD among dental professionals.7–9,18 This is because dental treatments involve maintaining the same working posture for long periods of time, repetitive motions, improper working posture, and excessive force.19 Dental professionals spend 66% of their working time sitting, and 40% of their work is done with the upper body bent forward.20 Prolonged sitting can cause contraction and tension to accumulate in muscles, and muscle stiffness can increase due to the generation of residual strain (i.e., creep) in viscoelastic tissues.21 Since the Iliocostalis lumborum (lower back) supports the upper body in a sitting position, it is judged that the PPT decreased the most in dentists who work in a sitting position for a long time. Furthermore, bending the upper body stimulates the rhomboid (trunk), and since the levator scapulae–superior angle (neck) and upper trapezius (shoulder) are muscle that supports the head, maintaining the same posture for a long time is closely related to reducing PPT. In addition, the transverse carpal ligament of the hand and wrist was in the top 30%, with the most decreased PPT. The transverse carpal ligament is a site where carpal tunnel syndrome occurs, and when the pressure in the carpal tunnel increases due to various factors, numbness or decreased sensation in the hand appears. Dental specialists are vulnerable to carpal tunnel syndrome because they apply excessive force with their hands in the process of repeating elaborate treatments using small instruments.22,23 Consequently, the PPT of the hand/arm significantly decreased after work; in particular, it was identified as the cause of the significantly decreased PPT of the transverse carpal ligament. The neck, shoulder, trunk, lower back, and hand/arm muscles were among the top 30% with the greatest reduction in PPT, suggesting that dental professionals’ work negatively impacts the entire upper body. Therefore, WMSD prevention and management programs aimed at dental professionals should involve overall upper-body interventions.
In the stretching group, PPT increased significantly in all muscles after stretching was applied. Compared with the measured values before the work, at least 90% or more of the recovered values were observed in all areas to which stretching was applied. In particular, it was found that PPT increased the most after the stretching intervention in the top 30% of the muscles, where the PPT decreased the most. Physiological effects of stretching include increased range of motion (ROM), short-term relief of discomfort/pain, and changes in the viscoelasticity of the muscle–tendon unit.24,25 It is thought that stretching may affect PPT increases because it relaxes shortened muscles and changes the viscoelasticity of the muscle-tendon unit, making the tissue less stiff. A study by Geri T et al.26 reports that an intervention such as physical therapy increases the trigger point PPT, supporting this finding. The clear mechanism of the stretching effect is still controversial, and the effect may differ depending on the nature of the operator’s work. Nevertheless, since stretching has a positive effect on workers performing typical tasks in which continuous contraction occurs,25 it is judged to be suitable as an intervention method for dental specialists.
The control group, who rested at the same time, showed no significant difference in 12 out of 15 muscles. It has been reported that stretching is more effective than simple rest for musculoskeletal pain in computer workers27 and truck drivers28 who sit for long periods of time. This is consistent with the results of this study, and it can be confirmed that active recovery after work is more effective than passive recovery in decreasing musculoskeletal pain. As an active recovery method for managing musculoskeletal disorders, various methods such as expert massage/physical therapy, aerobic exercise, and strength exercise have been proposed.29 Workers have a break time according to the labor law. Instead of setting aside time for individuals, we should make good use of this time. Therefore, stretching is considered the most appropriate way to practice at work during this time. This is because stretching can be done by oneself and there are relatively few restrictions of time and space. Although stretching is not an absolute cure for musculoskeletal disorders, it can be effectively managed by stretching during scheduled breaks.
A limitation of this study is that the intervention program was applied for a short period of time. Therefore, since the results of this study have limited generalizability, the effect of repeated application of stretching for a specific periods must be analyzed. Nevertheless, the significance of this study is that the regions for PPT measurement was subdivided and objectively measured, and the change in muscle pain was quantified according to the time point. This may be help develop guidelines for the management of WMSDs for dental professionals. Furthermore, the following items should be included before developing a stretching program and applying it to the workplace. (1) Providing an environment for periodic stretching, (2) Continuous education and publicity on musculoskeletal disorders and management using rest area posters and Medias, (3) Designation of a person in charge of program implementation management and supervision.
CONCLUSION
Stretching significantly increases the decreased PPT after all day work. Stretching during breaks can help dental professionals obtain immediate relief from musculoskeletal pain and may prevent and manage occupational musculoskeletal disorders.
AUTHOR CONTRIBUTIONS
Eun-Sol Kim: Conceptualization, Methodology, Software, Validation, Formal analysis, Investigation, Writing—original draft preparation, review, and editing, Visualization. Eun-Deok Jo: Conceptualization, Methodology, Software, Validation, Formal analysis, Investigation, Writing—original draft preparation, review, and editing, Visualization. Gyeong-Soon Han*: Conceptualization, Methodology, Software, Validation, Formal analysis, Investigation, Writing—original draft preparation, review, and editing, Visualization, Supervision.
FUNDING INFORMATION
This research received no external funding.
CONFLICT OF INTEREST STATEMENT
The authors declare no conflict of interests for this article.
DATA AVAILABILITY STATEMENT
The data are not publicly available due to privacy or ethical restrictions.
DISCLOSURE
This study was approved by the Institutional Review Board committee of Gachon University (IRB No. 1044396–201 511-HR-056-03). All participants provided informed consent after completing a form on the survey website.
APPENDIX 1 Demographic characteristics of the study group (Mean ± SD)
| Characteristics | Stretching Group (N = 27) | Control Group (N = 25) | P-value |
|---|---|---|---|
| Age | 38.96 ± 8.12 | 39.80 ± 8.64 | .619 |
| Career | 5.59 ± 5.69 | 6.92 ± 5.71 | .405 |
| Hours/d | 8.89 ± 0.97 | 9.16 ± 1.07 | .343 |
| Day/week | 5.37 ± 0.69 | 5.08 ± 0.81 | .169 |
| Height | 162.96 ± 6.05 | 162.20 ± 5.93 | .648 |
| Weight | 53.89 ± 8.86 | 54.44 ± 8.75 | .823 |
p determined by t-test.
| Characteristics | Stretching Group (N = 27) | Control Group (N = 25) | P-value |
|---|---|---|---|
| Age | 38.96 ± 8.12 | 39.80 ± 8.64 | .619 |
| Career | 5.59 ± 5.69 | 6.92 ± 5.71 | .405 |
| Hours/d | 8.89 ± 0.97 | 9.16 ± 1.07 | .343 |
| Day/week | 5.37 ± 0.69 | 5.08 ± 0.81 | .169 |
| Height | 162.96 ± 6.05 | 162.20 ± 5.93 | .648 |
| Weight | 53.89 ± 8.86 | 54.44 ± 8.75 | .823 |
p determined by t-test.
