


Abstract
Spinocerebellar ataxia type 2 (SCA2) is caused by mutations in the ATXN2 gene in which toxic effects are triggered by expanded polyglutamine repeats within ataxin-2. SCA2 is accompanied by motor neuron degeneration as occurs in amyotrophic lateral sclerosis (ALS). We investigated the distribution patterns of ataxin-2 and transactivation-responsive DNA-binding protein 43 (TDP-43), a major disease-related protein in ALS, in the CNS of 3 SCA2 patients. Phosphorylated TDP-43 (pTDP-43)-positive lesions were widely distributed throughout the CNS and generally overlapped with 1C2 (expanded polyglutamine)-immunoreactive lesions. This distribution pattern is different from the pattern in limbic-predominant age-related TDP-43 encephalopathy. In SCA2, double immunostaining of TDP-43 and 1C2 in motor neurons revealed 3 staining patterns: cytoplasmic 1C2 and nuclear TDP-43, nucleocytoplasmic 1C2 and nuclear TDP-43, and nuclear 1C2 and cytoplasmic TDP-43, which reflect the early, active, and final stages of pathological change, respectively. The translocation of TDP-43 from the nucleus to the cytoplasm along with the translocation of 1C2 in the opposite direction indicates that nuclear accumulation of the disease-specific protein ataxin-2 affects the intracellular dynamics of TDP-43. Such a close interrelationship between mutant ataxin-2 and TDP-43 in the cell might account for the similarity of their distribution in the CNS of patients with SCA2.
INTRODUCTION
Spinocerebellar ataxia type 2 (SCA2) is a polyglutamine disease caused by the toxic effects triggered by expanded polyglutamine repeats within ataxin-2 resulting in neurodegeneration in the cerebellum, brainstem, and spinal cord (1–3). SCA2 is clinically characterized by cerebellar gait and limb ataxia, slow saccadic eye movements, and hyporeflexia (4, 5). Motor neuron manifestations mimicking amyotrophic lateral sclerosis (ALS) in SCA2 have attracted increasing attention (6, 7), especially after intermediate-length ataxin-2 polyglutamine expansions were found to be a risk factor for ALS (8).
On the other hand, transactivation-responsive DNA-binding protein 43 (TDP-43) is a transcription-related protein that is physiologically localized in the cell nucleus. TDP-43 is known to be a major component of ubiquitin-positive cytoplasmic inclusions in frontotemporal lobar degeneration (FTLD) and sporadic ALS (9, 10). Since intermediate-length polyglutamine expansions of ataxin-2 influence the morphology of pathological inclusions in ALS motor neurons, the molecular interaction between TDP-43 and disease-specific proteins in neurodegenerative diseases has become the focus of extensive investigation. Indeed, TDP-43 pathology, or more strictly, its pathological cytoplasmic localization, has been reported to be associated with polyglutamine diseases and various neurodegenerative diseases such as Alzheimer disease (AD), dementia with Lewy bodies (DLB), and progressive supranuclear palsy (PSP) (11–13). This suggests that TDP-43 pathology is part of a process that might be common among neurodegenerative disorders. However, the mechanisms underlying TDP-43-induced neurodegeneration are poorly understood. It is also unknown whether they are the same in conditions with a primary TDP-43 pathogenesis, such as FTLD-TDP and ALS, and neurodegenerative diseases with secondary TDP-43 accumulation potentially triggered by other pathologies, such as in SCA2. The objective of this study was to investigate the association between expanded polyglutamine stretches of ataxin-2 and TDP-43 by evaluating the subcellular distribution of these pathologically altered proteins in the central nervous system (CNS) during various stages of SCA2.
MATERIALS AND METHODS
This study included autopsies of 3 patients with SCA2 from unrelated families. Their clinical features and the numbers of CAG repeats in ATXN2 are summarized in Table 1. Each brain was fixed in 10% formalin for 3–4 weeks; samples were embedded in paraffin and then sectioned at a thickness of 4 µm. Representative sections were stained with hematoxylin and eosin to assess the extent and severity of neuronal loss graded independently as follows: −, <10% (none); +, 10%–30% (mild); ++, 31%–60% (moderate); and +++, >60%, (severe). The extent and severity of neuronal loss were evaluated as the fraction of cell loss relative to numbers of age-matched control neurons.
Clinical Features of 3 SCA2 Patients
| Patient | 1 | 2 | 3 |
|---|---|---|---|
| CAG repeat size | 41 | 41 | 43 |
| Sex | Male | Female | Male |
| Age at onset (years) | 47 | 27 | 30 |
| Disease duration (years) | 10 | 21 | 20 |
| Dementia | + | + | + |
| Cerebellar ataxia | + | + | + |
| Ophthalmoplegia | + | − | + |
| Slow eye movement | + | + | + |
| Amyotrophy | + | + | + |
| Tendon reflex | Hyporeflexia | Areflexia | Areflexia |
| Involuntary movement | − | + | + |
| Deep sensory disturbance | Not examined | + | + |
+, clinical sign present; −, clinical sign absent.
Other sections were autoclaved at 121°C for 20 minutes, incubated in 100% formic acid for 5 minutes, and then incubated in 1% H2O2 for 10 minutes. Sections were then immunostained with an antipolyglutamine antibody (1C2, monoclonal, 1:9000; Chemicon, Temecula, CA) and an anti-TDP-43 antibody (polyclonal, 1:1000; Proteintech, Chicago, IL) or antiphosphorylated TDP-43 (pTDP-43, monoclonal, pS409/410, 1:1000; Cosmo Bio, Tokyo, Japan) using the avidin-biotin-peroxidase complex method (ABC Elite; Vector, Burlingame, CA). In immunohistochemical studies, the anti-TDP-43 antibody labeled both abnormal structures and normal TDP-43 in nuclei. The pTDP-43-specific antibody recognized only abnormal structures, including neuronal cytoplasmic inclusions (NCIs), neuronal intranuclear inclusions (NIIs), and dystrophic neurites (14). Immunostained preparations were used to evaluate the subcellular distribution of pathologically altered proteins such as pTDP-43 and expanded polyglutamine stretches in ataxin-2. The overall frequency of 1C2-positive lesions in each area was evaluated as the proportion relative to surviving neurons as follows: −, <1% (none); +, 1%–20% (low); ++, 21%–40% (intermediate); +++, 41%–60% (intermediate to high); ++++, 61%–80% (high); +++++, >80% (extremely high). The presence of neurons containing pTDP-43-positive inclusions was graded as follows: −, <1% (none); +, 1%–5% (low); ++, 6%–10% (intermediate); +++, >10% (high).
The potential interaction between TDP-43 and expanded polyglutamine stretches in ataxin-2 was further examined using spinal cord sections double-labeled for TDP-43 (polyclonal) and 1C2 (monoclonal) and visualized with secondary antibodies conjugated to Alexa Fluor 546 and Alexa Fluor 488 (1:200; Molecular Probes, Eugene, OR), respectively. The entire area of the anterior horn was imaged with a virtual slide system (Olympus VS120, Tokyo, Japan) at a resolution of 0.16 µm/pixel so that the relationship between the 2 epitopes could be quantified in each neuron.
RESULTS
Immunohistochemistry of TDP-43 and pTDP-43 in the CNS in SCA2
We examined the CNS distribution of pTDP-43-positive lesions and their subcellular distribution and morphology in 3 patients with SCA2. pTDP-43-positive lesions were widely distributed in the CNS. They were present in fewer than 10% of remaining neurons in most areas. In areas with relatively more intermediately or highly pTDP-43-positive lesions such as the cerebral cortex, thalamus, red nucleus, and anterior horn of the spinal cord, 1C2 immunoreactivity was intermediate to extremely high (Table 2). Furthermore, in the 3 SCA2 patients, the total number of regions showing intermediate or high pTDP-43 is 19, of which 15 is the total number of regions showing intermediate to extremely high 1C2, and the ratio is 15/19 (78.9%).
Neuropathological Features in SCA2
| Patient 1 | Patient 2 | Patient 3 | |||||||
|---|---|---|---|---|---|---|---|---|---|
| Neuronal Loss* | 1C2-IR† | pTDP-43-IR‡ | Neuronal Loss* | 1C2-IR† | pTDP-43-IR‡ | Neuronal Loss* | 1C2-IR† | pTDP-43-IR‡ | |
| Cerebral cortex (frontal) | − | ++ | ++ | − | ++ | ++ | ++ | ++ | ++ |
| Cerebral cortex (occipital) | − | ++ | + | − | ++ | + | ++ | ++ | + |
| Hippocampus | − | + | − | − | +++ | − | − | ++ | − |
| Dentate gyrus | − | − | − | − | − | − | − | − | − |
| Amygdala | − | − | − | − | − | − | − | − | − |
| Cerebral white matter | − | + | ++ | − | − | + | − | + | +++ |
| Caudate nucleus | − | + | + | − | − | + | + | ++ | ++ |
| Putamen | − | + | + | − | − | + | + | ++ | ++ |
| Pallidum | + | ++ | + | − | − | + | + | + | ++ |
| Thalamus | ++ | ++ | +++ | ++ | + | ++ | ++ | ++ | +++ |
| Oculomotor nucleus | − | +++ | − | + | ++ | − | + | +++ | − |
| Red nucleus | + | ++++ | +++ | ++ | ++ | ++ | ++ | ++++ | ++ |
| Substantia nigra | ++ | ++++ | ++ | +++ | ++++ | + | +++ | ++++ | + |
| Pontine nucleus | +++ | +++++ | + | +++ | +++ | + | +++ | ++++ | − |
| Locus coeruleus | − | ++ | ++ | − | ++ | − | + | + | − |
| Hypoglossal nucleus | − | + | − | + | ++ | − | + | ++ | − |
| Vestibular nucleus | − | + | − | + | + | − | + | + | − |
| Inferior olivary nucleus | +++ | ++ | + | +++ | +++++ | + | +++ | +++++ | + |
| Anterior horn | ++ | +++ | ++ | +++ | +++++ | + | +++ | +++++ | ++ |
| Cerebellar cortex | +++ | ++++ | ++ | +++ | +++++ | + | +++ | +++++ | + |
| Dentate nucleus | − | + | + | − | ++ | + | − | +++ | + |
Neuronal loss; −: <10% (none), +: 10%–30% (mild), ++: 31%–60% (moderate), +++:>60% (severe).
1C2, frequency of 1C2 immunoreactivity; ‘−‘:*<1% (none), +:1%–20% (low), ++: 21%–40% (intermediate), +++: 41%–60% (intermediate to high), ++++: 61%–80% (high), +++++: >80%(extremely high).
Phosphorylated transactivation-responsive DNA-binding protein 43 immunoreactive frequency; −: 1% (none), +: 1%–5% (low), ++: 6%–10% (intermediate), +++: >10% (high).
Regarding subcellular distribution, pTDP-43 was almost exclusively expressed in the cytoplasm of neurons and 1C2 was expressed in the nucleus, cytoplasm, or both. pTDP-43-positive neuronal lesions were morphologically quite variable, presenting as linear wisp-like (Fig. 1A, B), skein-like (Fig. 1C), rod-like (Fig. 1D), or round NCIs (Fig. 1E), or as NIIs shaped like cat’s eyes (Fig. 1F). Neuronal cytoplasmic (and/or intranuclear) pTDP-43-positive inclusions were found most frequently in the thalamus (Table 2). Dystrophic neurites (Fig. 1G) and pTDP-43-positive glial cytoplasmic inclusions resembling coiled bodies (Fig. 1H) were also observed. These pTDP-43-positive NCIs were morphologically indistinguishable from those found in ALS, though NCIs appeared much less frequently than in ALS.

Phosphorylated transactivation-responsive DNA-binding protein 43-positive neuronal inclusions and glial inclusions in the brain in Spinocerebellar ataxia type 2. Wisp-like cytoplasmic inclusions in the inferior olivary nucleus (A) and pallidum (B). Skein-like inclusion in the red nucleus (C). Rod-like inclusion in the red nucleus (D). Round inclusion in the reticular formation of the pons (E). Intranuclear inclusion shaped like cat’s eyes in the thalamus (F). Dystrophic neurites in the thalamus (G). Glial cytoplasmic inclusion shaped like a coiled body in the thalamus (H). Scale bar: 10 µm.
Next, we investigated differences in subcellular patterns between TDP-43 and pTDP-43 immunoreactivity in the motor neurons of the anterior horn of the spinal cord. TDP-43 (non-pTDP-43) was clearly visualized as a diffuse pattern in the nucleus but was barely visible in the cytoplasm (Figs. 2A and 3K, L).
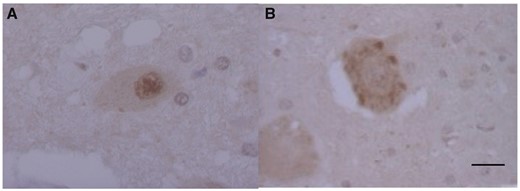
Phosphorylated transactivation-responsive DNA-binding protein 43-positive neuronal cytoplasmic inclusions (NCIs) in the lower motor neurons in Spinocerebellar ataxia type 2. Subcellular TDP-43 and pTDP-43 immunoreactivity: TDP-43-ir (A) and pTDP-43-ir (B) in the motor neurons of the anterior horn. Scale bars: 10 µm.

Nuclear accumulation of polyglutamine (1C2) is linked to nuclear clearing of transactivation-responsive DNA-binding protein 43 in the lower motor neurons in Spinocerebellar ataxia type 2. Double immunofluorescence labeling of expanded polyglutamine (1C2) in green (A, C, D, F, G, I, J, L) and TDP-43 in red (B, C, E, F, H, I, K, L). Pattern A: cytoplasmic 1C2 (A, C) with nuclear TDP-43 (B, C). Pattern B: cytoplasmic 1C2 (D, F) and nuclear colocalization of 1C2 and TDP-43 (F, arrowhead). Pattern B+: cytoplasmic (G) and aggregated nuclear 1C2 (I, arrow) with nuclear TDP-43 (H, I). Pattern C: nuclear aggregates of 1C2 (J, L) and cytoplasmic TDP-43 (K, L). Scale bars: 10 µm.
On the other hand, pTDP-43 staining was present in the cytoplasm and pTDP-43-immunoreactive NCIs varied in shape, with a granular or linear wisp-like appearance (Fig. 2B) that was distinct from the skein-like or round inclusions characteristically observed in other lesions and was often observed in the spinal anterior horn cells in ALS.
Double-Labeled Immunofluorescence of the Anterior Horn of the Spinal Cord
According to our previous study on SCA2 brains (15), evolution of 1C2 cytopathology begins with cytoplasmic granular staining (type A), followed by cytoplasmic and nuclear staining (type B), and nuclear staining with NIIs (type C). To see how TDP-43 is involved in this 1C2 cytopathological evolution, the spinal cords of patients with SCA2 were double fluorolabeled for 1C2 and TDP-43.
The subcellular localization of 1C2 and TDP-43 immunoreactivity was classified as either cytoplasmic or nuclear, based on their relative intensity. Abnormal cytopathological patterns (1C2 and TDP-43 labeling patterns) were classified as follows: pattern A, cytoplasmic 1C2 and nuclear TDP-43 (Fig. 3A–C); pattern B, nucleocytoplasmic 1C2 and nuclear TDP-43 (Fig. 3D–F); pattern C, nuclear 1C2 and cytoplasmic TDP-43 (Fig. 3J–L); and pattern D, cytoplasmic 1C2 and TDP-43. Among cells with pattern B, some NIIs were colocalized with TDP-43 (1C2 and TDP-43 in NIIs, Fig. 3G–I).
The relative frequency of these cytopathological patterns was quite similar in the 3 patients, which was calculated based on 100 cells randomly chosen in each region (Fig. 4). Pattern A was most frequent, followed by patterns B and C. Pattern D was absent.
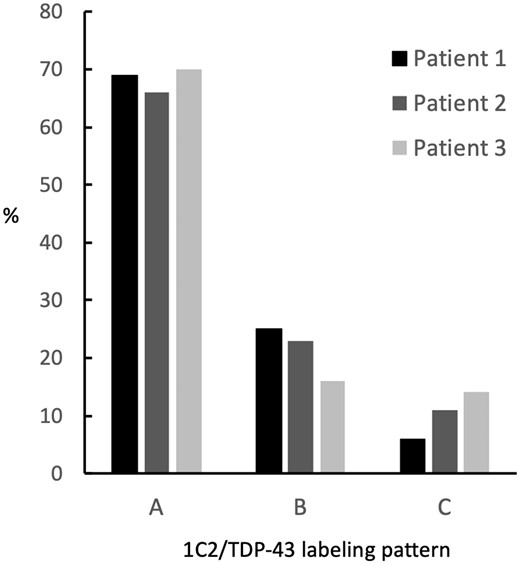
Staining patterns obtained by superimposing transactivation-responsive DNA-binding protein 43 pathology on 1C2-positive neurons in 3 patients with Spinocerebellar ataxia type 2. Cytopathological patterns of 1C2 and TDP-43 labeling were classified as follows: pattern A, cytoplasmic 1C2 and nuclear TDP-43; pattern B, nucleocytoplasmic 1C2 and nuclear TDP-43; pattern C, nuclear 1C2 and cytoplasmic TDP-43. The frequencies of patterns A and B were similar between patients. The frequency of pattern C was lowest in Patient 1, intermediate in Patient 2, and highest in Patient 3.
DISCUSSION
The detailed pathological analysis in this study investigated the implications of TDP-43 in SCA2. The subcellular distribution and morphology of TDP-43 have long been characterized as hallmarks of ALS and FTLD-TDP. One of the most striking pathological features of these TDP-43 proteinopathies is the cytoplasmic deposition of phosphorylated, ubiquitinated, and C-terminally cleaved TDP-43 aggregates, which are associated with loss of nuclear non-pTDP-43 (16). Our patients with SCA2 had findings similar to those observed in ALS and FTLD-TDP; pTDP-43 was expressed only in neuronal cytoplasm except in a very small number of NIIs shaped like cat’s eyes (Fig. 1) whereas 1C2 was expressed in the nucleus, cytoplasm, or both. The pTDP-43-positive lesions were widely distributed throughout the CNS of the patients with SCA2 (Table 2), as was also seen in a previous autopsy study (14). In that report, Toyoshima et al described 1 patient with SCA2 in whom pTDP-43-immunoreactive NCIs were distributed in areas with 1C2 immunoreactivity, such as the frontal motor cortex, white matter, red nucleus, and thalamus. In the 3 patients with SCA2 examined in the present study, the CNS distribution of pTDP-43-positive lesions and its overlap with 1C2-immunoreactive lesions (Table 2) were largely similar to those reported by Toyoshima et al except in the cerebellar cortex and anterior horn of the spinal cord (14).
Interestingly, in these 3 SCA2 patients, 78.9% (15/19) of regions with intermediate or high pTDP-43 immunoreactivity showed intermediate to extremely high 1C2 immunoreactivity; in contrast, only 42.9% (9/21) of regions with no pTDP-43 immunoreactivity had these degrees of 1C2 immunoreactivity (Table 2). These results indicate a relationship between cytoplasmic pTDP-43 accumulation and 1C2 expression in the CNS of patients with SCA2.
Previous studies have reported that pTDP-43 is expressed in several neurodegenerative diseases, specifically, AD, Parkinson disease (PD), DLB, Guam Parkinson dementia complex (Guam PDC), PSP, corticobasal degeneration (CBD), multiple system atrophy (MSA), argyrophilic grain disease, and polyglutamine diseases (11–14, 17–41). In Table 3, we summarize the reported features of pTDP-43 pathology in terms of the number of patients analyzed, proportion, brain distribution, morphology, and structural relationship with disease-specific proteins in a series of clinically well-characterized tauopathies, α-synucleinopathies, and polyglutamine diseases. We classified the brain distribution of pTDP-43 in the brain into 2 types. In the aging type, which is associated with old age and dementia, pTDP-43 pathology is found in structures such as the amygdala, hippocampus, and the entorhinal cortex (Table 3). This type is associated with AD, and some α-synucleinopathies such as PD, DLB, Guam PDC, and MSA (11, 17–25, 34–37). It also corresponds to a recently recognized disease entity called limbic-predominant age-related TDP-43 encephalopathy (LATE), which is characterized by a stereotypical TDP-43 proteinopathy in older adults (42, 43).
Characteristics of pTDP-43 Expression in Neurodegenerative Diseases
| Disease (Protein) | Author (References) | Number of Patients | Proportion of Patients With pTDP-43 Expression (%) | Brain Distribution of pTDP-43 | Morphology of pTDP-43 | Association With Disease Protein | pTDP-43 Expression Type |
|---|---|---|---|---|---|---|---|
| PD, DLB (α-synuclein) | Yasuda et al (17) | 10 | 10 | Hippocampus, entorhinal | NCI | Colocalizaion(+) | Aging type |
| Higashi et al (18) | 11 | 45 | Amygdala, hippocampus, entorhinal | NCI, DN | Aging type | ||
| Arai et al (19) | 15 | 53 | Amygdala, hippocampus, entorhinal | NCI, DN | Colocalization(+) | Aging type | |
| Uchino et al (20) | 11 | 72.7 | Hippocampus, amygdala, medulla | DN, NCI, GCI | Aging type | ||
| McAleese et al (21) | 15 | 33.3 | Amygdala, hippocampus | NCI | Aging type | ||
| Buciuc et al (22) | 395 | 37 | Hippocampus | not examined | |||
| Uemura et al (23) | 313 | 21 | Amygdala, hippocampus, entorhinal (LATE) | NCI | Aging type | ||
| Guam PDC (tau) | Hasegawa et al (24) | 6 | 100 | Hippocampus | NCI, DN | Aging type | |
| Geser et al (25) | 26 | 46.2 | Amygdala, hippocampus, entorhinal | NCI, GCI | Aging type | ||
| Miklossy et al (26) | 35 | 100 | Amygdala, hippocampus, entorhinal | NCI | Aging type | ||
| PSP (tau) | King et al (27) | 5 | 20 | Neocortex | NCI | Aging type | |
| Yokota et al (12) | 19 | 26 | Amygdala, hippocampus, entorhinal | NCI | Colocalization(+) | Aging type | |
| Kertesz et al (28) | 1 | 0 | None | ||||
| Koga et al (29) | 945 | 6 | Amygdala, hippocampus, PSP lesions (substantia nigra, subthalamic nucleus, globus pallidus) | NCI, DN, NII | Neurodegenerative type | ||
| CBD (tau) | Uryu et al (30) | 39 | 15.4 | Hippocampus, entorhinal, temporal-frontal cortex | DN | Aging type | |
| Yokota et al (12) | 12 | 17 | Amygdala, hippocampus, entorhinal | NCI | Colocalization(−) | Aging type | |
| Kouri et al (31) | 1 | 100 | Olivary nucleus | NCI | |||
| Yamashita et al (32) | 1 | 100 | CBD lesions (cerebral cortex, pons, medulla oblongata) | NCI | Colocalization(+) | Neurodegenerative type | |
| Koga et al (33) | 187 | 45 | CBD lesions (midbrain tegmentum, subthalamic nucleus, pontine tegmentum, substantia nigra) | NCI | Neurodegenerative type | ||
| Sainouchi et al (34) | 10 | 90 | CBD lesions (putamen, globus pallidus, thalamus, subthalamic nucleus, pontine tegmentum) | NCI, GCI, DN | Colocalization(+) | Neurodegenerative type | |
| MSA (α-synuclein) | Geser et al (35) | 29 | rare | Amygdala, hippocampus, entorhinal | DN, GCI, NCI | Aging type | |
| Sousa et al (36) | 1 | 0 | None | ||||
| Koga et al (37) | 186 | 7 | Amygdala, hippocampus | GCI | Colocalization(+) | Aging type | |
| Nwabuobi et al (38) | 1 | 100 | Lenticular nucleus, paracentral cortex | NCI, GCI | Colocalization(+) | Aging type | |
| AGD (tau) | Fujishiro et al (39) | 15 | 60 | Amygdala, hippocampus, entorhinal | NCI, GCI | Aging type | |
| Uchino et al (20) | 11 | 54.5 | Hippocampus, amygdala | DN, NCI, GCI | Aging type | ||
| SCA2 | Toyoshima et al (14) | 1 | 100 | SCA2 lesions (motor cortex, thalamus, red nucleus, pons, inferior olive) | NCI | Neurodegenerative type | |
| SCA3 | Tan et al (40) | 10 | 100 | Cranial nucleus, spinal cord | NCI | Neurodegenerative type | |
| Huntington (polyglutamine) | Schwab et al (41) | 10 | 100 | Huntington lesions (frontal and temporal cortex) | NCI, DN | Colocalization(+) | Neurodegenerative type |
| Tada et al (42) | 4 | 100 | Huntington lesions (cerebral cortex, thalamus, hypoglossal nucleus, anterior horn) | NCI, DN | Colocalization(−) | Neurodegenerative type |
PD, Parkinson disease; DLB, Dementia with Lewy bodies; Guam PDC, Guam parkinsonism-dementia complex; PSP, progressive supranuclear palsy; CBD, cortico-basal degeneration; MSA, multiple system atrophy; AGD, argyrophilic grain disease; SCA2, spinocerebellar ataxia type 2; SCA3, spinocerebellar ataxia type 3; NCI, neuronal cytoplasmic inclusion; GCI, oligodendroglial cytoplasmic inclusion; DN, dystrophic neurite.
If the expression of TDP-43 is not in a site that is impaired by age, it is commonly expressed at the site where the disease-specific protein is expressed in neurodegenerative disease, although the sites are not completely identical. Therefore, it is part of a group of other types with neurodegenerative disease-specific lesions. The other type is related to neurodegeneration (neurodegenerative type), in which pTDP-43 is generally expressed in the lesions of the underlying disease. This type is seen in some tauopathies, such as PSP and CBD, as well as in polyglutamine diseases (14, 28, 31–33, 39–41). However, the distribution pattern of TDP-43 in PSP is not purely the neurodegenerative type as it seems to be mixed with the aging type. Considering the distribution of neuronal loss and pTDP-43 immunoreactivity shown in Table 2, our current study indicates that pTDP-43-positive lesions in SCA2 can be classified as the neurodegenerative type rather than aging type, even though some brain regions do not exhibit neurodegeneration despite the presence of pTDP-43 immunoreactivity. In the present situation where no assumptions are made about the pathogenicity of TDP-43, the expression of TDP-43 may be considered as either primary or secondary.
Regarding the subcellular morphology of pTDP-43 aggregates, pTDP-43 staining in the CNS in SCA2 appeared as skein-like (Fig. 1C), rod-like (Fig. 1D), round NCIs (Fig. 1E), linear wisp-like (Fig. 1A, B), and granular NCIs (Fig. 2B). The granular NCIs were generally indistinguishable from those in sporadic ALS. The frequency of these abnormal NCIs in the CNS was far lower in SCA2 (1%–2%) than in ALS cases (30%–90%) (44).
In our previous study on SCA2 (15), 1C2 immunoreactivity in neurons was classified into 3 patterns: granular cytoplasmic, cytoplasmic and nuclear, and nuclear with inclusions, which corresponded to the early, active, and final stages of SCA2 pathology, respectively (15). It is plausible that these different patterns might represent a chronological transition of 1C2 cytopathology from the cytoplasm to the nucleus. Conversely, under pathophysiological conditions in patients with TDP-43 pathology, TDP-43 is cleared from the nucleus and accumulates in the cytoplasm of affected neurons (45, 46), probably after phosphorylation (44).
In view of some concordance in the CNS distributions of pTDP-43 and 1C2 (Table 2) and translocation of these 2 proteins in the reverse direction, it is worth examining how translocation of 1C2 into the nucleus is related to the translocation of pTDP-43 into the cytoplasm in the same cell. A double-labeling study of 1C2 (green) and TDP-43 (red) demonstrated 3 distinct patterns: pattern A, nuclear TDP-43 and cytoplasmic 1C2 (Fig. 3A–C); pattern B, nuclear TDP-43 and nucleocytoplasmic 1C2 (Fig. 3D–F) with occasional 1C2-positive NIIs (Fig. 3G–I); and pattern C, barely visible cytoplasmic TDP-43 and nuclear 1C2 (Fig. 3J–L). We previously reported that distributions of single labeled 1C2 were granular cytoplasmic, cytoplasmic and nuclear, and nuclear with inclusions, corresponding to patterns A, B, and C in this study, respectively. Therefore, these double-labeling patterns also distinguish between early, active, and final stages of SCA2 (Fig. 5). We examined the frequency of each pattern, as shown in Figure 4. Patient 3 had the greatest degree of pathological progression (Table 2) and the most neurons with pattern C. These findings also suggest that the frequency of neurons with pattern C increases with time and progression of pathological severity. Pattern C reflects the final stage of the disease. Importantly, because no instances of cytoplasmic TDP-43 and cytoplasmic 1C2 were detected, it is likely that translocation of pTDP-43 into the cytoplasm may be complementary to translocation of 1C2 into the nucleus (5). Nuclear TDP-43-positive and 1C2-negative cells existed, but were not counted because they were not pathological.
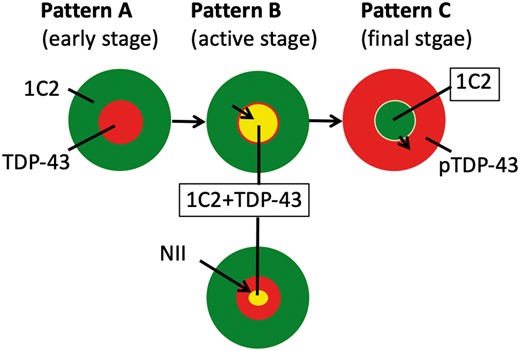
Nuclear clearing of transactivation-responsive DNA-binding protein 43 may be complementary to nuclear accumulation of expanded polyglutamine. The figure shows the schema of 3 patterns of 1C2 and TDP-43 pathology in SCA2. 1C2-positive expanded polyglutamine (green) is initially present only in the cytoplasm (pattern A) and extends into the nucleus (pattern B), occasionally accompanied by nuclear inclusions (pattern B+). Next, 1C2 accumulates only in the nucleus (pattern C), as we have already reported (15). By contrast, normal nuclear TDP-43 (red, patterns A and B) is cleared when 1C2-positive expanded polyglutamine accumulates in nucleus (pattern C). Patterns A, B, and C represent the early, active, and final stages of the disease, respectively.
Ataxin-2 knock-in mouse mutants have a higher diffuse cytoplasmic distribution of pTDP-43 and a lower nuclear distribution of RNA-binding proteins including TDP-43 (47). These findings suggest that mutant ataxin-2 might increase the disturbance of the RNA quality control system via aberrant distribution of RNA-binding proteins, which could contribute to the pathogenesis of SCA2. This hypothesis might be also compatible with our results in patients with SCA2 in that the CNS distribution of pTDP-43-positive lesions was likely to be of the neurodegenerative type, which overlapped with the distribution of lesions with 1C2 immunoreactivity. In polyglutamine diseases, a close relationship has also been reported between pTDP-43 and the Huntington disease-specific protein huntingtin (Htt). In human cell cultures, the expression of mutant Htt, which has 80–97 polyglutamine tracts, induces Htt aggregation along with phosphorylation and cytoplasmic translocation of endogenous TDP-43, whereas nonpathological Htt, with 25 polyglutamine tracts, has no effect on TDP-43 (48).
Although some studies of tauopathies such as PSP and CBD suggest that the distribution of pTDP-43 in the CNS corresponds to the aging type, the neurodegenerative type is likely to be predominant according to one large-scale study (28) (Table 3), indicating that these diseases are characterized by the mixed types. In addition, pTDP-43 is concomitantly expressed with and occasionally colocalizes with the disease-specific protein tau, as shown in Table 3 (18, 31, 33). The accumulation of certain misfolded proteins can affect cellular processes and ultimately trigger misfolding of other proteins in the same cells, a process termed pathologic synergy (49). Both tau and TDP-43 appear to have the potential for pathologic synergy, like mutant polyglutamine and TDP-43.
The relationship between pTDP-43 and α-synuclein has not been well characterized. Colocalization of the 2 proteins has rarely been reported (11, 16). Among α-synucleinopathies, however, TDP-43 pathology is clearly more common in Lewy body disorders (∼20%), and less frequent in MSA (4%–7%). One study indicated that pTDP-43 deposition is less common in DLB (33.3%) than in mixed AD/DLB (52.6%) or AD (73.9%) (18). The reason for these differential contributions of TDP-43 pathology in α-synucleinopathies might be attributed to the degree of concomitant tau pathology. There is concomitant tau pathology, in increasing order, in MSA, pure DLB, AD/DLB, and AD. These findings strongly indicate that some disease-specific proteins such as polyglutamine and tau affect the intracellular dynamics of TDP-43, which in turn might contribute to underlying disease processes.
In conclusion, unlike the age-related distribution of pTDP-43 lesions in LATE, the similar pattern of pTDP-43 and mutant ataxin-2 distribution in SCA2 might be partly related to the finding that nuclear accumulation of mutant ataxin-2 affects the intracellular dynamics of TDP-43, thereby inducing its translocation into the cytoplasm. This might be analogous to the changes in intracellular TDP-43 dynamics induced by phosphorylated tau accumulation in tauopathies.
This work was supported by a Grant-in-Aid for Scientific Research (C) (23591279) from the Japan Society for Promotion of the Sciences.
The authors have no duality or conflicts of interest to declare.
ACKNOWLEDGMENTS
We thank all patients and their families, and clinicians who referred patients to our institute. We also thank K. Yamaoka for providing technical support with pathological examinations.
