


Abstract
Ecological factors associated with the narrow coastal distribution of Anopheles farauti Laveran s.s. were investigated using decision tree software and a recently developed software tool that permits analysis of environmental gradients across distributional boundaries. Significant variables identified by these procedures were then used to develop ecological niche models that permitted detailed—and improved—predictions of the species' overall distribution. These methods identified seven climatic factors (four of temperature factors and three atmospheric moisture factors) from among 40 environmental variables related to the range of this species. In addition, the gradient-analysis tool identified elevation as being particularly important. The distributional hypothesis predicted using ecological niche modeling of these factors included all of the record sites from which An. farauti s.s. was collected in northern Australia and successfully reconstructed its narrow limitation to coastal areas. Omission of elevation from analyses resulted in unrealistic predictions of potential distributional areas >100 km inland, where the species has not been found.
The distribution of Anopheles farauti Laveran s.s., an important vector of malaria in the Southwest Pacific Region, includes New Guinea, the Solomon Islands, Vanuatu, and northern Australia. Systematic surveys have indicated that its distribution is almost exclusively coastal, e.g., in Australia's Northern Territory and Queensland, >80% of collections were <5 km of the coast (Cooper et al. 1996). This species uses brackish water sites for larval development, but larvae have also been found in freshwater environments (Sweeney 1987), suggesting that its coastal distribution is determined by environmental factors other than simply proximity to the sea.
Our initial studies (previous to this effort) involved analyses of environmental factors affecting anopheline mosquito distributions in northern Australia by using ecological niche modeling (ENM) with GARP (Stockwell and Peters 1999) and data mining methods (A.W.S., N.W.B., and R.D.C., unpublished data). We selected decision tree methods by using two software packages, classification and regression tree analysis (CART) Breiman et al. 1984) and KnowledgeSeeker (Biggs et al. 1991), to search for significant environmental factors associated with species' presences. GARP models were generated using the combinations of environmental layers highlighted by these data mining techniques to determine whether the model outputs corresponded to high-quality distributional predictions. By this means, we hoped to identify key environmental factors responsible for defining the geographic ranges of the different vector species, as such factors are of major epidemiological significance and of direct relevance for malaria control strategies.
By using these methods, we were able to identify environmental variables associated with presence of An. farauti s.s. (A.W.S., N.W.B., and R.D.C., unpublished data). Although this first effort produced models that were highly predictive of core areas of the species' distribution, we were nonetheless unable to identify combinations of environmental parameters that successfully delimited its coastal distribution. Consequently, we consider that further exploration and analysis by using additional tools would be fruitful in understanding the large-scale ecology of this species.
In this contribution, we further refine our approach and achieve better results. A complementary approach to understanding ecological factors defining species' distributional areas is to focus on discontinuities and gradients associated with species' range limits (Cadenasso et al. 2003). A novel exploratory tool has been developed that permits visualization and comparative analysis of gradients in environmental dimensions across range boundaries (Bauer and Peterson 2005). Hence, to refine our estimate of An. farauti s.s. ecology and distribution, we combined the range boundary tool with further ENM analyses and compared the results with those obtained by data mining using KnowledgeSeeker, to clarify the suite of environmental factors associated with the strictly coastal distribution of An. farauti s.s. in Australia.
Materials and Methods
Mosquito Surveys
Adult and larval Anopheles were collected along the coast of Queensland and the Northern Territory, and up to 300 km inland between latitudes 10 and 19° S and longitudes 128–146° E. Different sectors of this region were covered progressively yearly from 1985 to 1991 by using four-wheel-drive vehicles and Australian Army helicopters at the end of the wet season, as described previously (Cooper et al. 1995). Specimens were identified morphologically to species in the field, and transported to the laboratory in liquid N2 for determination of isomorphic species by using either allozyme electrophoresis (Mahon 1984) or DNA-based probes (Cooper et al. 1991). All collection localities were recorded on 1:100,000 topographic maps at a ground resolution of 100 m2 (Fig. 1).
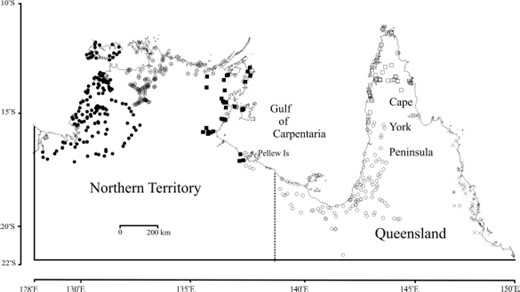
Anopheles collection sites in northern Australia showing sampling localities by year. Sampling localities: +, 1985; □, 1986; ○, 1987; ■, 1988; ⊗, 1989; ●, 1990; and x, 1991.
Environmental Layers
Environmental information used in this study included ASCII raster grids covering northern Australia at a spatial resolution of 0.01° (≈1 by 1 km). The geographical extent was 10–22° S latitude and 128–150° E longitude, for 40 climatic and nonclimatic data layers (Table 1). These layers included 27 "bioclimatic" parameters of temperature, rainfall, and solar radiation generated with ANUCLIM (Houlder et al. 1999). This involved the use of monthly mean climate surface coefficients, generated by the thin plate smoothing spline technique ANUSPLIN (Hutchinson 2003) from Australian Bureau of Meteorology climate data, for the period January 1921 and December 1995 (Hutchinson and Kesteven 1998). Latitude and longitude of the meteorological stations were used as independent spline variables, together with a 0.01° digital elevation model (DEM) for northern Australia generated with ANUDEM (Hutchinson 1997), which acted as a third independent variable. Because atmospheric moisture is known to be a key factor influencing survival and longevity of adult mosquitoes, we included four layers describing dew point (January and July at 0900 and 1500 hours) generated with ESOCLIM (a component of ANUCLIM), and six layers for relative humidity (January, July, and annual mean at 0900 and 1500 hours), generated with ANUSPLIN (Hutchinson 2003) from long-term climate data from the Australian Bureau of Meteorology. We also included three nonclimatic layers: elevation (a DEM of 1 km ground resolution), slope, and aspect (both generated from the elevation DEM with the geographical information system [GIS] program TNTmips (MicroImages Inc., Lincoln, NE).
Environmental layers of northern Australia subjected to boundary U-test at 25 points along the boundary line 5 km inland from the coast
Environmental layers of northern Australia subjected to boundary U-test at 25 points along the boundary line 5 km inland from the coast
Boundary U-Test.
This software tool permits exploratory analyses of species' range limits based on simple, univariate comparisons of conditions inside and outside of a user-specified range limit using Mann–Whitney U-tests to measure strength of association (Bauer and Peterson 2005). The application, recently presented as an ArcView GIS 3.3 extension (Bauer and Peterson 2005), first requires the user to specify a border that putatively corresponds to the range limit as well as points for analysis along that border. At each point, a rectangular transect of user-defined dimensions is drawn by the program perpendicular to the boundary. For each transect, grid cells inside (i.e., species present) and outside (i.e., species absent) are contrasted independently along each environmental dimension via a Mann–Whitney U-test. For the current study, we used a parallel implementation of the boundary U-test developed as a toolscript for TNTmips GIS by MicroImages Inc. technical support staff.
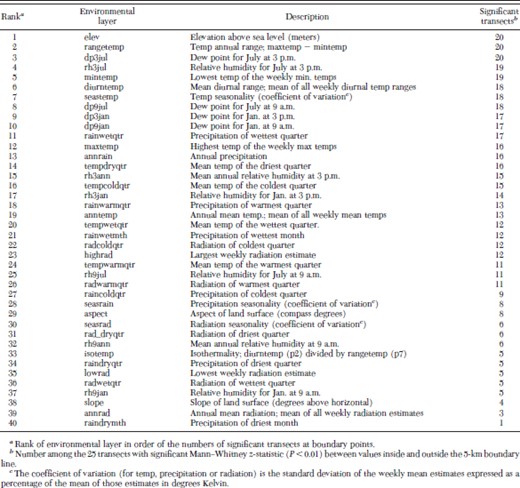
A boundary line 5 km from the coastline of northern Australia was generated using the buffer zone function of TNTmips. This line was selected because it encompassed the majority (89%) of record sites of An. farauti s.s. in northern Australia. Then, 25 points along this line adjacent to known occurrences for An. farauti s.s. were specified as locations for transects. Near each point selected, one or more record sites of An. farauti s.s. was inside the 5 km boundary line, and several no-record sites were outside the line. Transects were specified as 8 km in length (i.e., 4 km on each side crossing the range boundary) and 20 km in width, centered on the designated points (Fig. 2). Along each transect, in the software extension, grid cells inside and outside of the range limit were compared using a Mann–Whitney U-test. Using this procedure, the z-parameter values from the normal distribution approximation (P < 0.01) were tabulated for each of the 40 environmental layers at each of the 25 points. The z-values were displayed as bar charts at each point location and saved as an attribute table for use in other applications.
Bar charts showing associations for five environmental layers across 25 transects along a line 5 km from the coast of northern Australia. Bars (representing z-statistic values) for different selected layers are shown in the following order (left to right): elevation, anntemp, diurntemp, isotemp, and rangetemp. Inset shows transect (8 km in length × 20 km in width) with bar chart at a selected point on the 5-km boundary line overlaid on the elevation layer.
Data Mining
The survey records for the A. farauti group in northern Australia include the geographic coordinates of localities at which particular mosquito species were either found (record sites) or not found (no-record sites). The values for the 40 environmental layers at grid cells corresponding to points representing >600 localities of record sites and no-record sites for An. farauti s.s. in northern Australia were generated with TNTmips. This information was then incorporated into database tables that contained a record/no-record field for each species as well as separate fields containing the values for each of the environmental layers. The record/no-record field was assigned as the dependent variable for tree-structured data mining analysis to explore relationships among the environmental layers that constitute the independent variables.
For the current study, we used KnowledgeSeeker, which builds decision trees by recursive partitioning of the data set. This algorithm examines the data in each of the independent variables and searches for relationships with the dependent variable. Variables are categorized using chi-square analysis, and those of most importance can be presented in order of statistical significance. We used this ranking procedure to highlight environmental variables associated with presence or absence of the target species.
The numbers of mosquitoes obtained from individual sites ranged from 1 to 3500. To reduce sampling bias, no-record sites with small collections of anophelines (<10 specimens) were excluded from analysis with KnowledgeSeeker. The rationale for this decision was based on our observations in the malaria-receptive area of northern Australia, which indicate that other north Australian Anopheles species are usually found in collections of An. farauti s.l. We judged that a collection of 10 or more anophelines that did not include An. farauti s.s. was a reasonable lower limit for inclusion as a no-record site in data mining procedures. Thus, the dependent variable for our KnowledgeSeeker iterations included all of the record sites for this species together with the no-record sites from collections of 10 or more specimens.
Ecological Niche Modeling
DesktopGarp version 1.1.6 (Scachetti-Pereira 2003) was used for ecological niche modeling in this study. Models were generated using known occurrences of An. farauti s.s. in northern Australia, together with various combinations of the environmental layers ranked by exploratory analyses by using the range boundary tool, as described above. GARP is an evolutionary-computing algorithm that has seen extensive testing for modeling ecological requirements and predicting potential geographic distributions (Soberón and Peterson 2004). Relevant examples are recent applications to predicting distributions of malaria vectors in the United States (Levine et al. 2004a) and Africa (Levine et al. 2004b). In general, GARP focuses on modeling ecological niches, the conjunction of ecological conditions wherein a species can maintain populations without immigration (Grinnell 1917). Specifically, GARP relates ecological characteristics of occurrence points to those of points sampled randomly from the rest of the study region, developing a series of decision rules that best summarize factors associated with presence.
Within the GARP program's processing, occurrence points were divided evenly with 50% used for training data sets (for model-building) and the other 50% used for testing data sets (for model evaluation). GARP works in an iterative process of rule selection, evaluation, testing, and incorporation or rejection: a method is chosen from a set of possibilities (e.g., logistic regression, bioclimatic rules) and applied to the training data set to develop or evolve a rule. Predictive accuracy is based on the test data set. Rules may evolve in ways that mimic DNA evolution (e.g., point mutations, deletions). Change in predictive accuracy between iterations is used to evaluate whether particular rules should be incorporated into the model. Chosen configuration parameters included development of 100 models, with 1000 iterations per model and 0.01 convergence limits. The "best-subsets" procedure (Anderson et al. 2003) was used to select five of the 100 models with highest predictive values. These were added together using TNTmips to produce final range predictions based on the environmental layers selected as inputs.
Results
The boundary U-test showed significant Mann–Whitney z-values (P < 0.01) for several environmental layers at points along the 5-km inland boundary chosen for analysis—an example using five environmental layers is shown in Fig. 2. Outputs were ranked by tabulating the 40 environmental variables in ascending order of numbers of significant z-values scored among the 25 transects (Table 1). The eight variables with strongest associations across the boundary each had significant differences among 18–20 transects. These environmental dimensions included four parameters related to temperature (rangetemp, mintemp, diurntemp, and seastemp), three parameters describing aspects of atmospheric moisture (dp3jul, rh3jul, and dp9jul), and elevation.
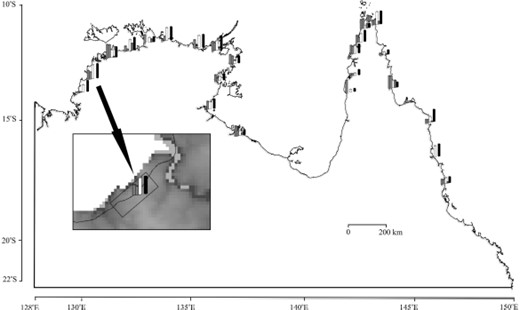
We based ecological niche models in GARP on the survey record sites of An. farauti s.s. and the eight most significant variables identified by the boundary U-test. The range map representing the sum of the best-subset models included all record sites from which this species was collected during mosquito surveys in northern Australia (Fig. 3). Although the predicted map extended inland into some low-lying valleys in Northern Territory and along the west side of the Cape York Peninsula in Queensland, it generally followed the coast quite closely around the north end of the continent.
GARP predicted range of An. farauti s.s. in northern Australia based on eight significant layers (elevation, diurntemp, mintemp, rangetemp, seastemp, dp9jul, dp3jul, and rh3jul) identified by boundary U-test.
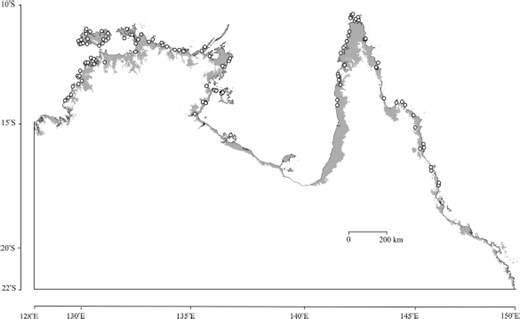
Seven of the 10 most significant environmental variables identified by KnowledgeSeeker were among the eight significant environmental coverages identified by the boundary U-test (Table 2). GARP runs based on these seven variables (which did not include elevation) resulted in best-subset models in which the species was predicted to range up to 100 km inland in the Northern Territory and to extend across the northern part of Cape York Peninsula of Queensland, areas where An. farauti s.s. has not been found (Fig. 4). Elevation was ranked equal first with the U-test method, with 20 significant z-values among the 25 transects, but only 17th among the 40 environmental layers by KnowledgeSeeker, so it was not included in this GARP series.
Environmental variables ranked by Knowledge Seeker as being associated with presence of An. farauti s.s. and ranked by the boundary U-test in order of significant Mann–Whitney z-statistic (P<0.01) between values inside and outside the 5-km boundary line
Environmental variables ranked by Knowledge Seeker as being associated with presence of An. farauti s.s. and ranked by the boundary U-test in order of significant Mann–Whitney z-statistic (P<0.01) between values inside and outside the 5-km boundary line
GARP predicted range of An. farauti s.s. in northern Australia based on seven significant layers (diurntemp, mintemp, rangetemp, seastemp, dp9jul, dp3jul, and rh3jul) identified by range boundary U-test but omitting elevation. Note the broad inland predictions in spite of no records so far from the coast.
To investigate the relative contributions of the eight environmental layers identified in the boundary U-test still further, separate sets of 100 GARP runs were made, in which a different layer was removed each time using the jackknifing procedure (Peterson and Cohoon 1999). We found that omission of the elevation layer consistently produced poor-quality models. One-at-a-time omission of the seven common layers produced lower quality models than those based on all eight layers, but the resulting predictions did not extend as far inland as that omitting elevation.
Discussion
It could be argued that the mosquito surveys involving a different sector of northern Australia each year may provide a less reliable indication of realized species distributions than collections based on multiyear observations. This is an important consideration, because the occurrence records from survey collections were used to assess the quality of GARP range predictions. However, even though it would be logistically impossible to cover the whole survey area of 500,000 km2 in a single field season, some areas were revisited in different years by using the same survey methods. For example, the survey of the east coast of Queensland and Cape York Peninsula in 1991 was undertaken to seek additional localities not visited during the 1985 and 1986 surveys (Fig. 1). The combined collection data of An. farauti s.s. for the 1985 and 1986 surveys showed that there were 27 of 32 record sites and 12 of 42 no-record sites within 5 km of the coast. The equivalent data for the 1991 survey showed that there were 22 of 23 record sites and nine of 36 no-record sites for this species within 5 km of the coast. Thus, the survey results over these two different periods are consistent in that >85% of record sites, and <30% of no-record sites were in proximity to the coast. Moreover, the areas over which this species was found or not found were broadly similar between the two survey periods. Also, the survey data collected from inland areas of the Northern Territory in the 1989 survey were later supplemented by additional collections in this region in 1992 and 1994. These later collections were not included in the data set for the current study, but the results showed that the same species were found to be present or absent at the same localities in different years. (A.W.S., N.W.B., and R.D.C., unpublished data). Furthermore, the absence of An. farauti s.s. from >100 localities along the southeastern coast of the Gulf of Carpentaria in 1987 (Fig. 1) was in accordance with the results of extensive collections made in this area in April 2000 during investigations of arboviruses (van den Hurk et al. 2002). More than 20,000 Anopheles were processed in the arboviral study but none were identified as An. farauti s.s. We contend that this additional sampling information supports the view that the survey data set used for this study provides a reasonably accurate estimate of the realized distribution of An. farauti s.s. in northern Australia.
Selection of appropriate scales of sampling units and sampling strategies is important for detecting ecological boundaries (Fagan et al. 2003). Scale is particularly important in species such as An. farauti s.s. that present narrow and restricted distributions. The 1-km resolution of the northern Australian environmental layers used for these investigations seems suitable for this purpose. Our preliminary work with data mining tools to search for links between environmental variables and presence or absence of the target mosquito species identified important ecological factors associated with distributions of two members of the An. farauti group in northern Australia (An. farauti 2 and An. farauti 3), but it was less satisfactory for An. farauti s.s. (A.W.S, N.W.B., and R.D.C., unpublished data).
Although data mining was able to detect significant differences between the record and no-record data sets, this procedure was unable to identify the variable(s) associated with the limited coastal distribution of this species. Indeed, 117 of 131 record sites of An. farauti s.s. fell ≤5 km from the coast and only nine were >10 km from the coast. In contrast, 90 of 150 no-record sites were >50 km inland, and only three were ≤10 km from the coast. Thus, the majority of no-record sites were far inland from the range boundary of this species. Methods that characterize boundary edges, such as transect analysis, are considered to be particularly appropriate for modeling these kinds of data (Fagan et al. 2003). The boundary U-test meets this criterion. The Mann–Whitney U-test of transects at selected points along a boundary line drawn 5 km inland from the coast identified elevation among the most significant variables for the boundary transects, even though it was not among the key variables ranked by data mining. Further GARP modeling confirmed the importance of elevation in delineating the coastal range of this species.
It would seem that our earlier study using sampling and statistical methodology (data mining) was able to detect environmental variables with gradual spatial gradients across the study area but unable to deal with variables presenting steep and narrow gradients across range boundaries. This limitation was exemplified by An. farauti s.s., in which data mining approaches were unable to identify factors linked with coastal distribution, presumably because data points on either side of the sharply defined range boundary may have been insufficient. The boundary U-test, however, focused on contiguous values across the boundary to highlight the importance of elevation. These results underscore the value of tools such as the boundary U-test for exploring environmental properties of species range limits. It is an ideal complement to other modeling tools and analytical approaches to detecting ecological factors associated with species occurrences.
The physical geography of the northern coastline of Australia is characterized by low-to-moderate relief with elevations of <150 m. The elevational gradient is steepest along the eastern side of the Cape York Peninsula, where the Great Dividing Range approaches the coast. The gradient is generally moderate from the inland plateau to the coast of the Northern Territory. In contrast, the entire southern coast of the Gulf of Carpentaria has a low gradient, because it is flanked by plains with elevations of <10 m extending 10 km or more inland from the sea. This latter stretch of coastline is of interest, because An. farauti s.s. mosquitoes were not found there except for one site in the Pellew Islands (Fig. 1). This site and the surrounding coastal area were included in best subset range models based on the eight variables ranked by the U-test (Fig. 3). The models derived from the seven common variables (Fig. 4) were similar for this region and did not extend far inland from the coast as they did in the Northern Territory and the Cape York Peninsula. Thus, the removal of elevation from the significant variables did not markedly alter the predicted range along the southern coast of the Gulf of Carpentaria. These results imply that elevation is not a factor associated with absence of An. farauti s.s. in this area due to the flat terrain. It would seem that the temperature and atmospheric moisture factors highlighted by both exploratory methods are adequate to define the range of the species in this part of northern Australia.
It is likely that some degree of intercorrelation exists among variables in the environmental data set. For example, temperature is inversely related to relative humidity and elevation may be spatially correlated with temperature and atmospheric moisture. The three environmental layers concerned with atmospheric moisture in July are clearly related among themselves. Nevertheless, the removal of any of these layers in GARP experiments led to range models of inferior quality, which suggests that the significant parameters identified in this study may contribute to understanding the biological requirements of this species and help explain its realized distribution in Australia. The values of the four significant temperature variables, relating to diurnal, seasonal, and annual temperature ranges as well as lowest weekly minimum temperature, are higher in the arid inland areas of northern Australia and more moderate near the coast, so it is reasonable to postulate that they may be among the environmental factors that define the range of this species. Parameters associated with precipitation were not among the environmental factors ranked as significant by data mining or the boundary U-test. It is possible that the propensity of An. farauti s.s. to breed in brackish water might obviate the need for freshwater larval sites replenished by rainfall.
Recognition of atmospheric moisture as a critical variable associated with good-quality models accords with many field and laboratory observations on the biology of mosquitoes which have shown that adult survival is influenced by humidity (Clements 1963). Both data mining and boundary U-test methods indicated that long-term mean values for dew point and relative humidity in July were strongly associated with the range of this species. This time of year coincides with the middle of the northern Australian dry season, when aerial moisture is generally near annual minimum levels. The actual values of these indices in coastal areas are higher, owing to the moderating influence of the sea, than in neighboring inland areas. This association implies that the ecological niche of this species is influenced by higher atmospheric moisture near the sea as well as by steep elevation gradients immediately inland from the coast.
Acknowledgements
This work was funded by National Health and Medical Research Council of Australia Grant 211608.
References Cited
