


Abstract
The role of natural killer group 2D (NKG2D) in peripheral T cells as a costimulatory receptor is well established. However, its contribution to T cell thymic education and functional imprint is unknown. Here, we report significant changes in development, receptor signaling, transcriptional program, and function in T cells from mice lacking NKG2D signaling. In C57BL/6 (B6) and OT-I mice, we found that NKG2D deficiency results in Vβ chain usage changes and stagnation of the double-positive stage in thymic T cell development. We found that the expression of CD5 and CD45 in thymocytes from NKG2D deficient mice were reduced, indicating a direct influence of NKG2D on the strength of T cell receptor (TCR) signaling during the developmental stage of T cells. Depicting the functional consequences of NKG2D, peripheral OT-I NKG2D-deficient cells were unresponsive to ovalbumin peptide stimulation. Paradoxically, while αCD3/CD28 agonist antibodies led to phenotypic T cell activation, their ability to produce cytokines remained severely compromised. We found that OT-I NKG2D-deficient cells activate STAT5 in response to interleukin-15 but were unable to phosphorylate ERK or S6 upon TCR engagement, underpinning a defect in TCR signaling. Finally, we showed that NKG2D is expressed in mouse and human thymic T cells at the double-negative stage, suggesting an evolutionarily conserved function during T cell development. The data presented in this study indicate that NKG2D impacts thymic T cell development at a fundamental level by reducing the TCR threshold and affecting the functional imprint of the thymic progeny. In summary, understanding the impact of NKG2D on thymic T cell development and TCR signaling contributes to our knowledge of immune system regulation, immune dysregulation, and the design of immunotherapies.
1. Introduction
The process of T cell development, which takes place in the thymus, is a highly complex and well-timed choreography in which bone marrow–derived T cell precursors develop into mature T cells. This process occurs in a timely fashion and is mainly driven by the T cell receptor (TCR) and cytokines. Thymocytes progress through several stages of maturation: double negative (DN) → double positive (DP) → single positive (SP).1 DN cells are the most immature and are characterized by a lack of CD4 and CD8 expression. DP cells express both CD4 and CD8 and have a fully assembled TCR. Upon interaction with cortical thymic epithelial cells, DP thymocytes that are signaled with low-affinity TCR engagement, thereby being positively selected, differentiate into SP CD4 or CD8 cells. The SP cells then migrate toward the thymic medulla, where they interact with medullary dendritic cells and medullary thymic epithelial cells, leading to negative selection.2,3
Natural killer group 2D (NKG2D) has been well described as a CD8 T cell costimulatory receptor.4,5 In the periphery, NKG2D is expressed by NK, γδ-T, NKT, and CD8 T cells. While NKG2D signaling directly triggers cytolytic responses in NK cells, NKG2D acts as a costimulatory receptor in CD8 T cells.4,5 Devoid of any signaling, NKG2D pairs with the adaptor protein DAP10 in CD8 T cells and increases TCR signaling and effector functions.4,6–10 In mouse CD8 T cells, NKG2D expression is upregulated within 2 to 3 d of activation11 and weakly induces mTOR pathways, which results in the expression of memory-associated proteins such as T-bet, Eomes, CD62L, or CD127, thus favoring long-lived memory precursor differentiation. In addition, our group has shown that NKG2D signaling plays a significant role in the transcriptional certification of effector CD8 T cells in memory formation associated with activation of the ribosomal S6 protein.12 Cumulatively, these studies clearly portray the impact of NKG2D on peripheral T cells. However, there is a void in our understanding of the role of NKG2D in T cell development.
To determine the role of NKG2D in T cell development, we used a classical T cell mouse model, TCR transgenic OT-I mice.13 CD8 T cells from these mice express a single high-affinity TCR recognizing the chicken ovalbumin (OVA)-derived peptide SIINFEKL. OT-I CD8 T cells have been extensively used as a tool to dissect almost every aspect of CD8 T cell biology, including T cell thymic selection,14 effector and memory antiviral or antitumor responses,15 and as surrogates of endogenous T cell responses,16 and auto-immunity and graft-vs-host disease.17,18 Moreover, this model has been used to study T cell migration,19 immune synapse (IS),20 and the impact of peptide affinity on T cell function.21 To determine the importance of NKG2D signaling, we crossed OT-I mice with B6 NKG2D knockout (KO) mice22 to create OT-I NKG2D KO mice and studied T cell development and T cell functional properties.
The data presented in this study describe a previously unreported role for NKG2D and establish the mechanical framework of this receptor in the development and maturation of T cells in the thymus. We found that NKG2D is expressed in mouse and human thymi and that T cell development in NKG2D KO mice was significantly altered compared with wild-type (WT) mice. We also found that in T cells from OT-I mice, the lack of NKG2D signaling resulted in significant alterations of their thymic education and the selection of dysfunctional mature CD8 T cells.
2. Methods
2.1 Mice and cells
All cells were cultured in RPMI supplemented with 10% heat-inactivated fetal bovine serum (Seradigm), 2 mM L-glutamine (Corning), and 1% penicillin/streptomycin (Corning). All mice (male and female) were housed at Loyola University Chicago in a pathogen-free facility. OT-I (C57BL/6-Tg [TcraTcrb]1100Mjb/J)xThy1.1+ TCR transgenic mice were bred in house and were crossed to NKG2D KO (B6.Cg-Klrk1tm1Dhr/J) mice to generate NKG2D KO OT-I mice. Animal experiments were conducted in accordance with Loyola University Chicago (205488) and H Lee Moffitt Cancer Center Institutional Animal Care and Use Committee guidelines (IS00009215).
2.2 Human thymocytes
Thymic tissues were obtained from patients <1 year of age undergoing median sternotomy and corrective cardiovascular surgery. Material was collected in accordance with Loyola University Chicago Institutional Review Board Committee guidelines.
2.3 In vitro T cell activation
Splenocytes were isolated from WT and NKG2D KO OT-I mice by passing the spleen through a cell strainer. Red blood cells were lysed using 1 ml ACK lysing buffer for 1 min at room temperature. Splenocytes (2 × 10⁶/well) were activated with 0.1 μg/mL OVA peptide (SIINFEKL) (New England Peptide) or with 1 μg/mL anti-CD3 (BioXcell) and 0.1 μg/mL anti-28 monoclonal antibody (mAb) (BioLegend) in tissue-treated 24-well plates for 4 d in medium containing 10 U/mL interleukin (IL)-2 (NCI) and 50 ng/mL IL-15 (PeproTech).
2.4 CD8 T cell restimulation
RMAS cells were adjusted at 10 × 106 cells/mL and pulsed for 2 h at room temperature with 1 μg/mL OVA peptide. To induce cytokine production, RMAS cells were then cultured at a ratio of 1:2 with activated WT or NKG2D KO OT-I T cells and incubated overnight at 37 °C in presence of Brefeldin A. To induce TCR signaling and cleaved caspase-3, OVA-pulsed RMAS cells were added to activated WT or NKG2D KO OT-I T cells and cultured for the indicated time at 37 °C.
Unpulsed RMAS cells were used as control. To induce phospho-STAT5 (pSTAT5), activated WT and NKG2D KO OT-I T cells were stimulated with 5 ng/mL recombinant murine IL-15 (PeproTech) for 30 min at 37 °C. Unstimulated cells were used as a control. Induction of TCR signaling, pSTAT5 and cleaved caspase-3 were performed on activated WT and NKG2D KO OT-I T cells after O/N culture 5 × 10⁵ cells/well in 96-well plate, in the absence of cytokine. The stimulation was stopped by direct addition of fixation buffer (BioLegend), followed by methanol fixation and permeabilization.
2.5 Flow cytometry
Fluorochrome-conjugated antibodies against CD3, CD4, CD8, CD44, CD62L, Tim-3, PD-1, Lag-3, CD45.1, interferon γ (IFN-γ), IL-2 (BioLegend), NKG2D, CD25, tumor necrosis factor α (TNF-α), phosopho-ERK (pERK) (all eBioscience), pSTAT5 (Invitrogen), and cleaved caspase-3 and ribosomal protein S6 (pS6) (Cell Signaling Technologies) were used (Supplementary Table 1). Zombie Aqua exclusion dye (BioLegend) was used to gate for live cells. After collection from mouse, cells were washed with PBS and stained a fixable viability dye at room temperature for 30 min. Cell surface staining was performed at 4 °C with Fc block and antibody mix in magnetic-activated cell sorting buffer with 0.5% bovine serum albumin. Staining of phosphorylated proteins was performed following the eBioscience protocol with methanol fixation and permeabilization. When methanol was used, live cells were defined based on size.
2.6 Dulling assay
Single-cell suspension of harvested thymi were plated in a 96-well plate at 5 × 10⁵ cells/well in 100 μL RPMI containing 0.1 μg/mL of OVA peptide at final concentration. Cells were incubated for 16 h at 37 °C. Staining for CD3, CD4, and CD8 were conducted following Fc receptor blockade.
2.7 Western blot
WT and KO thymi were harvested and manually dissociated. Cells were lysed using RIPA buffer. Equivalent amounts of protein, determined by Bradford assay (10 μg total protein), were separated by sodium dodecyl sulfate–polyacrylamide gel electrophoresis and transferred to nitrocellulose membrane. Blots were blocked with 5% bovine serum albumin in TBS-T20. Naïve and 5-d activated T cells were used a negative and positive expression controls. Western blots were conducted with mouse NKG2D/CD314 antibody (clone: 191004; R&D Systems) and developed with the appropriate horseradish peroxidase–conjugated secondary antibodies (Sigma-Aldrich) and the chemiluminescence detection system (Bio-Rad).
2.8 DNA preparation and TCRB analysis
DNA was extracted from magnetically purified CD8 T cells from B6 and NKG2D-ko spleenocytes by using Qiagen DNeasy Blood and Tissue Kit (Mini Spin Columns). ImmunoSEQ Assay (deep) was conducted by Adaptive Biotech.
2.9 Statistics
Statistical significance using a two-tailed Student t test to obtain a 5% significance level with a 95% confidence interval. *P < 0.05; **P < 0.01; ***P < 0.001; ****P < 0.0001. The number of mice used per experiment (5 per group) was validated using StatMate2 (GraphPad Software).
Percentages are expressed as mean with SD.
3. Results
3.1 NKG2D is expressed by DN thymocytes and its deficiency influences the usage of Vβ chains during thymic selection
In the thymus, developing T cells undergo positive and negative selection dictated by the strength of the TCR signaling.23 Thus, modulating TCR signaling could impact the outcoming TCR repertoire. Consistent with a previous study showing that a low level of NKG2D expression can be detected in human thymocytes,24 we confirmed the expression of NKG2D in thymic mouse T cells by flow cytometry and Western blot. We found that B6 mouse thymi showed a low level of expression of NKG2D in ∼1% of thymic T cells (Fig. 1A). We also detected a protein with a molecular weight of ∼35 kDa, which corresponds to the size of NKG2D. In contrast, this band was not detectable in thymic T cells from B6 NKG2D KO mice (Supplementary Fig. 1). Further validating the identity of NKG2D, the corresponding band was detected in effector but not naïve splenic T cells (Supplementary Fig. 1). Next, we looked for the thymic T cell population that predominantly expressed NKG2D, and found that NKG2D is expressed in DN, DP, and SP CD4 T cells (Fig. 1A). We identified the DN population by gating out cells expressing CD3, CD8, CD11b, CD49b, CD19, and TERT19 (Lin−), and we found that NKG2D was expressed preferentially (93.3%) on DN1 T cells, defined as CD44 + CD25− (Fig. 1B). Having demonstrated the expression of NKG2D in the thymus, we sought to test the hypothesis that NKG2D plays a role in T cell development in the thymus.
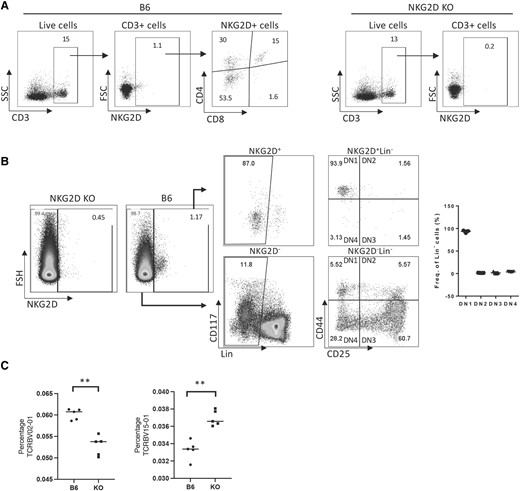
NKG2D is expressed in the thymus and influences the usage of Vβ chains. (A) Thymic expression of NKG2D in B6 and NKG2D KO mice. (B) NKG2D expression is primarily found on DN1 cells in the thymus. (C) Graphs show the percentage of TCRBV15-01 and TCRBV02-01 on CD8 purified peripheral T cells (spleen), obtained from deep ImmunoSEQ. **P < 0.001. Representative data are shown: 5 mice per group were used and assays were repeated at least 3 times. FSC = forward scatter; SSC = side scatter.
By analyzing the thymus of B6 and NKG2D-deficient B6 mice through flow cytometry, we determined that the proportions of DN, DP, and SP appeared unchanged (not shown). Given the known T cell costimulatory properties of NKG2D,4,6–8,10–12,22,25 we investigated possibility that NKG2D signaling could shape the TCR-Vβ gene usage during thymic selection. The in-depth ImmunoSEQ analysis of spleen T cells from WT and B6 NKG2D KO mice shows that while the usage of majority of TCRBV chains remain unchanged, the percentage of TCRBV02-01 and TCRBV15-01usage in B6 NKG2D KO spleen T cells differed from the B6 counterpart: 0.06017% to 0.05285% (P < 0.001) and 0.03330% to 0.03695% (P < 0.001), respectively (Fig. 1C). These differences in TCR-Vβ chain usage between B6 and B6 NKG2D KO mice suggests that NKG2D may affect the usage of Vβ and the TCR repertoire.
3.2 NKG2D deficiency distorts T cell thymic selection
Considering that alternative TCR Vβ chains probably compensate for the lack of NKG2D, we separated the inputs of TCR diversity and NKG2D signaling by restricting TCR usage. To do this, we generated OT-I mice that are NKG2D deficient (KO). We then analyzed the CD4 and CD8 expression patterns in isolated thymocytes of OT-I WT vs NKG2D KO mice (littermates) and found that the proportions of DN, DP, and SP cells differed significantly. The percentage of DP cells was higher in OT-I NKG2D KO mice (76.8% vs 51.7% in OT-I WT mice), with a corresponding decrease in the percentage of SP cells (14.4% OT-I NKG2D WT vs 5.3% KO in SP CD8 and 24.7% OT-I NKG2D WT vs 10.8% KO in SP CD4; P < 0.0001) (Fig. 2A, B). The apparent low percentage of DP cells found in OT-I WT mice is in line with what others already reported and probably results from the constitutive expression of the transgenic TCR.25
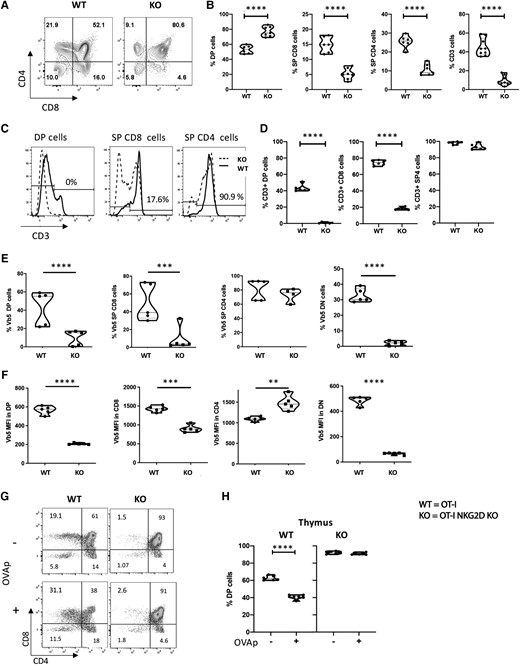
WT and NKG2D KO OT-I mice have different thymic selection. (A) Representative flow plots showing CD4 and CD8 staining on live cells. (B) Percentage of live DP, SP CD8, and CD4 cells present in the thymus of WT and NKG2D KO OT-I mice. (C) Percentage of live CD3+ T cells present in the DP, SP CD4, and SP CD8 of WT and NKG2D KO OT-I mice. (D) Histograms showing CD3 expression on DP, SP CD8, and SP CD4 thymocytes. Cells are gated on the live thymocytes identified by side scatter (SSC) vs forward scatter (FSC). Values on histograms denote the percentage of CD3+ on NKG2D KO thymocytes. (E) Percentage of live thymocytes expressing the TCR Vβ5 chain on the surface. (F) Vβ5 expression per cell basis on live thymic T cells. (G) Representative plots and (H) summarizing graph of dulling assay. The P value was calculated using the Student t test. **P < 0.01; ***P < 0.001; ****P < 0.0001. Five mice per group were used and assays were repeated at least 3 times. MFI = mean fluorescence intensity.
The total number of thymocytes was similar in OT-I NKG2D WT and KO mice (data not shown). Next, we examined the levels of CD3 expression, as it is necessary for T cell signaling and function. We found that the percentage of thymocytes expressing CD3 was drastically reduced in OT-I NKG2D KO mice (Fig. 2C). While 43.6% of OT-I WT DP cells upregulated CD3 expression, OT-I NKG2D KO DP thymocytes failed to upregulate CD3 (P < 0.0001). Notably, 90.9% of OT-I NKG2D KO SP CD4 thymocytes were able to upregulate CD3.
However, 17.6% of OT-I NKG2D KO SP CD8 cells expressed CD3 compared with 75.7% in OT-I WT (P < 0.0001) (Fig. 2C, D; Supplementary Fig. 2). Similar to the expression of CD3, we also found that the percentage of cells positive for surface expression of Vβ5 (a constitutive chain of the OT-I TCR) was significantly reduced in DP, SP CD8, and DN cells from OT-I NKG2D KO mice (P < 0.0001) (Fig. 2E;Supplementary Fig. 2). In addition, the level of Vβ5 expression at the cell surface was also strongly reduced in DN, DP, and SP CD8 (Fig. 2F;Supplementary Fig. 2).
OT-I thymocytes express a transgenic TCR specific for OVA peptide in the context of the H2Kb major histocompatibility complex [MHC] class I molecule).13 In vivo, OT-I thymocytes are positively selected in the presence of H-2Kb and self-peptides and negatively selected in the presence of H-2Kb and OVA peptide. Using an in vitro dulling assay,26–30 we tested whether the absence of NKG2D alters OVA-mediated DP T cell deletion. We cultured thymocytes from OT-I NKG2D WT and KO mice with OVA peptide for 16 h before flow cytometry analysis. We found that the percentage of DP cells in OT-I WT mice significantly changed from 61% to 38% (P < 0.0001) (Fig. 2G, H). These data confirm that OT-I thymocytes cells undergo negative selection in the presence of OVA peptide. Juxtaposing these results, we found that in NKG2D KO OT-I mice, the percentage of DP was unchanged (93% vs 91%; P > 0.05) (Fig. 2G, H).
Together, the data strongly support the hypothesis that NKG2D modulates negative selection of T cells during T cell development.
To test if NKG2D causes changes in the magnitude of TCR signaling in thymic T cells, we analyzed their expression of 2 proteins that are directly controlled by the strength of the TCR signaling, CD5 and CD45.1.31–35 In OT-I NKG2D KO mice, we found a reduction in the percentage of thymic CD3+ CD5+ CD45.1+ cells compared with OT-I WT cells (82.2% to 22.4%) (P < 0.0001) (Fig. 3A, B: Supplementary Fig. 3). Moreover, the per-cell basis expression levels of CD5 (Fig. 3C) and CD45.1 (Fig. 3D) were also reduced in DP, SP CD8, SP CD4, and DN cells from OT-I NKG2D KO mice compared with OT-I WT mice. Next, we sought to determine if these changes are also observed in peripheral T cells. We noticed that the percentage of CD8 splenic T cells was reduced in OT-I NKG2D KO mice (from 91.5% to 56.7%; P < 0.0001) (Fig. 3E). Splenic CD8 T cells from OT-I NKG2D KO mice had a significant reduction in CD5 and Vβ5 mean fluorescence intensity compared with OT-I WT while the level of CD45.1 expression was comparable to that of WT OT-I CD8 splenocytes (Fig. 3G).
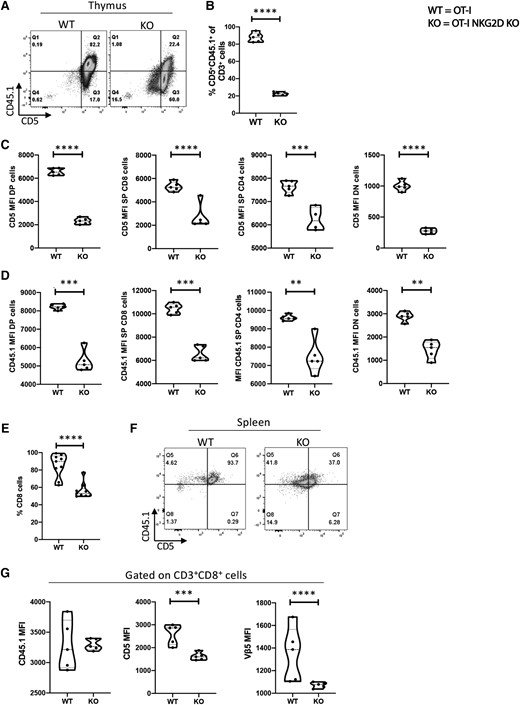
The magnitude of TCR signaling is reduced in NKG2D KO thymocytes. (A) Representative dot plot staining of OT-I NKG2D WT vs KO thymus stained for CD5 vs CD45.1. (B) Percentage of live CD5 + CD45.1+ cells shown in panel A. (C, D) CD5 (C) and CD45.1 (D) expression per cell basis on WT NKG2D OT-I and KO thymocytes. (E) Percentage of live CD8 T cells in the spleen of OT-I NKG2D WT and KO mice. (F) Dot plot examples of OT-I NKG2D WT and KO spleens stained for CD5 and CD45.1. (G) MFI of CD45.1 (left), CD5 (center) and Vβ5 (right) on live CD3+ CD8 T cells. Five mice per group were used and assays were repeated at least 3 times. The P value was calculated using the Student t test. **P < 0.01; ***P < 0.001; ****P < 0.0001.
Altogether, these data show a significant alteration in the development of T cells in NKG2D KO OT-I mice when compared with WT OT-I mice, implying a novel role for NKG2D in the thymus, and specifically, in the T cell–negative selection step. Based on these findings, we next sought to determine if CD8 T cells generated in the absence of NKG2D have altered functions.
3.3 The OVA peptide–MHC complex failed to activate mature OT-I NKG2D KO CD8 T cells
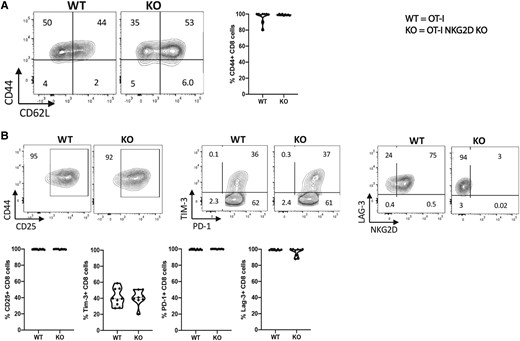
To determine the impact of NKG2D signaling on the function of CD8 T cells, OT-I NKG2D WT and KO splenocytes were activated in vitro for 4 days using OVA peptide in the presence of IL-2 and IL-15. We found that antigen naïve OT-I WT CD8 T cells were highly responsive when cultured with OVA peptide and rapidly proliferated, as suggested by the formation of classical proliferating cell clusters (Fig. 4A). However, the OT-I NKG2D KO CD8 T cells did not expand under the same conditions (from 78% to 61%; P < 0.001) (Fig. 4B). The majority of these CD8 T cells kept a naïve phenotype (Fig. 4C), as CD44 expression was upregulated in only 40% of OT-I NKG2D KO CD8 T cells vs 100% in OT-I WT CD8 T cells (P < 0.0001) (Fig. 4C). CD25 was expressed in 100% of OT-I NKG2D WT cells and only 12.5% of KO CD8 T cells (P < 0.0001) (Fig. 4C). Moreover, after gating on phenotypically activated T cells (CD44+), which correspond to antigen-experienced T cells,36 we found that OT-I NKG2D KO CD8 T cells did not upregulate any of the common activation-dependent markers (PD-1, Tim-3, and Lag-3).37 Tim-3 was expressed on 42% of OT-I NKG2D WT cells and 2.5% KO CD8 T cells (P < 0.0001) (Fig. 4D). PD-1 was expressed on 100% of OT-I NKG2D WT CD8 T cells and 8.5% of KO CD8 T cells (P < 0.0001) (Fig. 4D). Similarly, Lag-3 was expressed on 100% of OT-I NKG2D WT CD8 T cells and on 11% of KO CD8 T cells (P < 0.0001) (Fig. 4D). As expected, NKG2D was found to be upregulated after activation in the OT-I NKG2D WT CD8 T cells but not in the KO (Fig. 4D). We also found that Vb5.1/5.2 expression was similar on WT OT-I and NKG2D KO OT-I CD8 T cells (Supplementary Fig. 4).
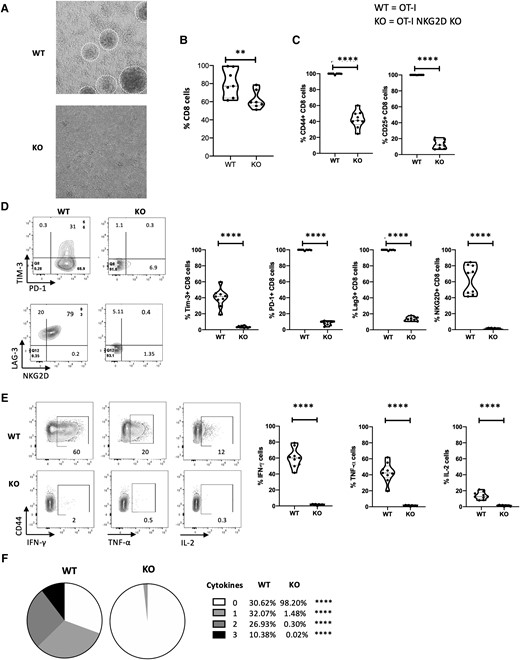
Naïve NKG2D KO OT-I CD8 T cells are unresponsive to OVA peptide. NKG2D WT and KO OT-I splenocytes were cultured in vitro for 4 d with soluble OVA peptide. (A) Pictures of the culture wells, with proliferating clusters visible in NKG2D WT OT-I culture. (B) The graph summarizes the percentage of live CD8 cells from panel A. (C) Representative flow plots show CD44 and CD25 staining (top), and graphs summarize the percentage of live CD8 T cells expressing CD44 and CD25 (bottom). (D) Representative flow plots show Tim-3, PD-1, LAG-3, and NKG2D staining gated on live CD44+ CD8 cells (left). Graphs summarize the percentage of live CD44+ CD8 T cells expressing Tim-3, PD-1, LAG-3, and NKG2D (right). (E) Representative flow plots show IFN-γ, TNF-α, and IL-2 staining (left), and graphs summarize the percentage of live CD44+ CD8 T cells producing IFN-γ, TNF-α, and IL-2 after overnight coculture with OVA-pulsed RMAS cells (right). Unpulsed RMAS cells were used as control (not shown). (F) Pie charts summarize the percentage of spleen live CD44+ CD8 T cells from panel E producing 0, 1, 2, or 3 cytokines. Five mice per group were used and assays were repeated at least 3 times. The P value was calculated using the Student t test. **P < 0.01; ***P < 0.001; ****P < 0.0001.
Next, we examined the ability of CD8 T cells from OT-I NKG2D KO and WT mice to produce cytokines in response to peptide stimulation from OVA-pulsed RMAS cells. While OT-I WT CD8 T cells produced IFN-γ, TNF-α and IL-2 (61%, 42.6% and 16.8%, respectively), the production of these cytokines was negligible (<4%) in OT-I NKG2D KO CD8 T cells (P < 0.0001) (Fig. 4E). A total of 70.4% of OT-I WT CD44+ CD8 T cells produced 1 or more cytokines, while <2% of OT-I NKG2D KO cells produced 1 or more cytokine (Fig. 4F). Altogether, these data indicate that the majority of OT-I NKG2D KO CD8 T cells failed to achieve priming status exposed to OVA peptide and those that achieved antigen-experienced status (CD44+) were functionally unresponsive.
3.4 Mature OT-I NKG2D KO CD8 T cells can be phenotypically activated by αCD3/CD28 agonist mAbs but remain dysfunctional
We found that OVA peptide failed to induce in vitro activation and proliferation of antigen-naïve OT-I NKG2D KO CD8 T cells. We interpreted this observation as the failure of stimulation to reach the TCR activation threshold. Therefore, we tested if bypassing the TCR engagement by directly engaging CD3 and CD28 could overcome this activation defect. OT-I NKG2D WT and KO splenocytes were cultured in vitro using αCD3/CD28 agonist mAbs.38–40 After 4 days, the activation phenotype was analyzed by flow cytometry. Both groups, OT-I NKG2D WT and KO, equally upregulated CD44, indicating that OT-I NKG2D KO CD8 T cells can achieve activation, despite lacking NKG2D signaling (Fig. 5A). In CD44+ cells, we found that the percentage of cells expressing the activation markers CD25, PD-1, Tim-3, or Lag-3 was also similar in OT-I NKG2D KO and WT cells (Fig. 5B). In conclusion, bypassing TCR engagement via αCD3/CD28 agonist mAbs, which is a form of general T cell activation, led to the generation of phenotypically activated CD8 T cells from both OT-I NKG2D WT and KO mice that were indistinguishable from each other. These data suggest that activation of OT-I NKG2D KO CD8 T cells is limited by the strength of the TCR signaling.
NKG2D KO OT-I CD8 T cells can be phenotypically activated by CD3 signaling. NKG2D WT and KO OT-I splenocytes were activated in vitro for 4 d with soluble anti-CD3/CD28 mAbs. (A) Representative flow plots showing the percentage of live CD8 T cells expressing CD44, CD62L, CD25, Tim-3, PD-1, and NKG2D. (B) The graphs summarize the percentage of live CD44+ CD8 T cells expressing markers defined in panel A. Five mice per group were used and assays were repeated at least 3 times.
Given the previous results, we examined the effector function of CD8 T cells lacking NKG2D. To do this we measured cytokine production and target cell killing of αCD3/CD28 mAb activated OTI NKG2D WT and KO CD8 T cells in response to target cells, OVA-pulsed RMAS cells. Paradoxically, despite having an activated phenotype, only 6.6% of OT-I NKG2D KO CD8 T cells produced IFN-γ, TNF-α, or IL-2, with the majority producing only 1 of these cytokines (Figs. 6A-C). This is in contrast to OT-I NKG2D WT cells, in which 50% produce any of these 3 cytokines, with a third of them producing more than 1 cytokine (P < 0.0001) (Fig. 6A-C). To compare the capacity of OT-I NKG2D KO and WT cells to induce apoptosis in target cells, we measured the percentage of target cells (peptide-pulsed RMAS cells) expressing cleaved caspase-3.41 There was no difference in apoptosis after 1 h; however, at 3 and 6 h of coculture with activated OT-I WT CD8 T cells, 80% of OVA-pulsed RMAS cells were apoptotic (Fig. 6D, E). In contrast, OT-I NKG2D KO CD8 T cells were unable to induce apoptosis of OVA-pulsed RMAS cells, as the percentage of cells expressing cleaved caspase-3 remained low, ∼10% (P < 0.0001) (Fig. 6D, E). These data demonstrate that effector OT-I cells developed in the absence of NKG2D signaling are functionally defective as they are unable to mediate cytokine production and induce apoptosis in target cells, showing a key costimulatory role for NKG2D during T cell development.
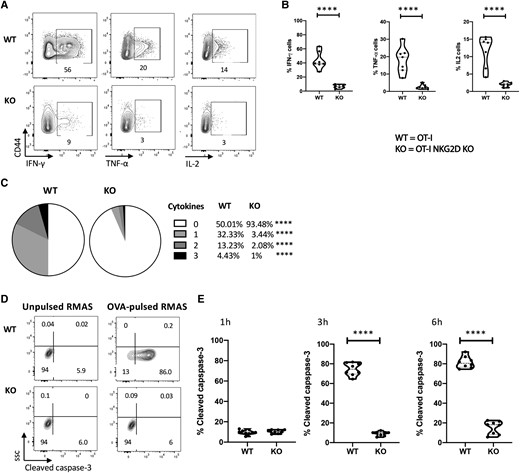
Phenotypically activated OT-I NKG2D KO cells are unresponsive to peptide reactivation. In vitro activated NKG2D WT and KO OT-I CD8 T cells from Fig. 5 were cultured with OVA-pulsed RMAS cells. (A) Representative plots show the cytokine production after overnight stimulation measured by flow cytometry. Unpulsed RMAS cells were used as control (not shown). (B) Percentage of live CD44+ CD8 T cells producing IFN-γ, TNF-α and IL- 2. (C) Pie charts show the percentage of live CD44+ CD8 T cells producing 0, 1, 2, or 3 cytokines. (D) Representative flow plots show the expression of cleaved caspase-3 after 4 h of coculture. (E) Kinetics of cleaved caspase-3 expression by OVA-pulsed RMAS cells after culture with in vitro activated NKG2D WT or KO OT-I CD8 T cells for 1, 3, and 6 h. Representative data are shown; 5 mice per group were used and assays were repeated at least 3 times. The P value was calculated using the Student t test. **P < 0.01; ***P < 0.001; ****P < 0.0001.
3.5 TCR signaling, but not IL-15 responsiveness, is impaired in activated OT-I NKG2D KO CD8 T cells
Modulatory signals provided by cytokines can influence the effector responses of activated CD8 T cells. For example, IL-15 was shown to favor the survival of CD8 T cells and reduce the threshold for TCR signaling in OT-I NKG2D WT CD8 T cells.42–44 In addition, the adaptor protein DAP10, through which NKG2D signals, was reported to coprecipitate with the IL-15 receptor, suggesting a potential link between NKG2D and IL-15 receptor signaling.45 Therefore, we examined the responsiveness of anti-CD3/CD28–activated OT-I NKG2D WT and KO CD8 T cells to exogenous IL-15 by measuring their ability to phosphorylate STAT5. The percentage of pSTAT5+ OT-I NKG2D KO CD8 T cells was slightly lower than their WT counterparts (42% vs 52.5%); however, this difference was not statistically significant (P > 0.05) (Fig. 7A, B). These data indicate that the ability to respond to IL-15 was not altered in OT-I NKG2D KO CD8 T cells.
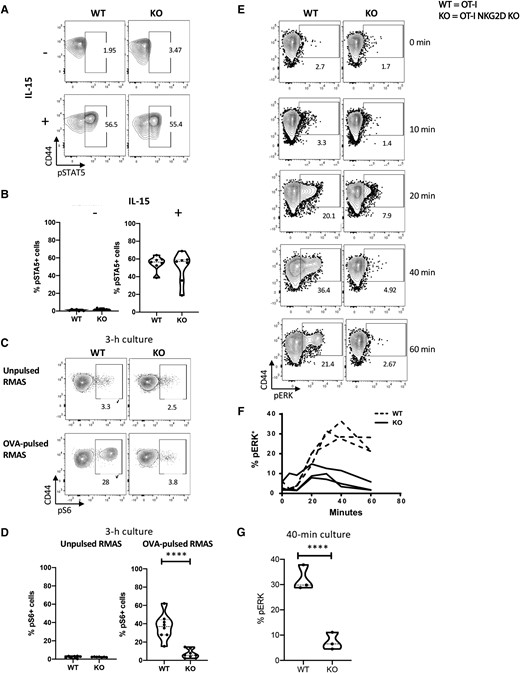
TCR signaling but not IL-15 is impaired in NKG2D KO CD8 T cells. NKG2D WT and KO OT-I splenocytes were activated in vitro for 4 d with aCD3/CD28 mAbs and exposed to IL-15. (A) Representative flow plots show pSTAT5 staining. (B) Percentage of live CD8 T cells expressing pSTAT5 after 30 min of stimulation with IL-15. Nonstimulated cells were used as control. (C) Representative flow plots show pS6 staining. (D) Percentage of live CD8 T cells expressing pS6 after 3 h of stimulation with OVA-pulsed RMAS cells. Unpulsed RMAS cells were used as control. Nonstimulated cells were used as control. (E) Representative flow plots show the staining of pERK after coculture with OVA-pulsed RMAS for 0, 10, 20, 40, and 60 min. (F) The graph summarizes the kinetics of pERK shown in panel E. Baseline pERK was measured by culturing unpulsed RMAS cells for 1 h and is depicted as 0 h in the plot and graph. (G) Percentage of pERK at 40 min after reactivation, corresponding to the peak of ERK phosphorylation in NKG2D WT T cells. Data shown are the results of at least 3 independent experiments. The P value was calculated using the Student t test. **P < 0.01; ***P < 0.001; ****P < 0.0001.
As the canonical function of NKG2D is to enhance TCR signaling, we examined downstream events of TCR signaling. We measured the level of phosphorylated pS6 upon TCR engagement with OVA-pulsed target cells. S6 is a component of the 40S ribosomal subunit that can be targeted through multiple pathways, such as TCR and costimulatory signaling.46,47 TCR engagement of CD44+ OT-I NKG2D WT by OVA-pulsed RMAS cells induced robust phosphorylation of S6 in CD8 T cells, as 28% of them expressed pS6 after 3 h of coculture (Fig. 7C, D). In contrast, CD44+ OT-I NKG2D KO CD8 T cells failed to induce pS6 (only 3.8% pS6+ cells) under the same conditions (P < 0.0001), suggesting an impaired TCR signaling cascade.
We then measured and compared the ability of both OT-I NKG2D WT and KO T cells to phosphorylate ERK, one of the earliest proteins directly induced upon contact with OVA-pulsed RMAS.48 pERK was detectable within 10 min of TCR engagement in OT-I WT CD8 T cells, peaked at 40 min (36.4%), and remained constant for at least 1 h. In contrast, OT-I NKG2D KO CD8 T cells reached 7.9% pERK (OT-I NKG2D WT vs KO; P < 0.0001) and were unable to maintain pERK in the same period (Fig. 7E-G).
Altogether, these data suggest that the loss of effector functions observed in ex vivo activated OTI NKG2D KO CD8 T cells results from their inability to trigger the TCR signaling cascade effectively.
3.7 NKG2D is expressed by human thymic T cells
Using 2 different mouse models, we showed that the lack of NKG2D altered T cell development in the thymus, with profound consequences in T cell thymic development, peripheral T cell pool, and effector responses. We then sought to investigate the presence of NKG2D in the human thymus, which would suggest a similar function in human T cell development. In human thymic T cells from three donors, we found that NKG2D is not expressed in proT cells (T cell progenitors that are CD34 + CD7 + CD3−CD4−CD8−) (Fig. 8B, E, and H).49,50 However, the more differentiated CD7+ CD34− population (also negative for CD3, CD4, and CD8) (Fig. 8C, F, and I) express NKG2D. This population is equivalent to the mouse DN2 stage. We also found expression of NKG2D in the mature thymocyte population, which includes CD7+ CD3+ CD8 cells (Fig. 8C, F, and I); only a small percent of mature CD3+ CD4+ cells express NKG2D. The expression of NKG2D in a subset of T cells in the human thymus further emphasizes the contribution of NKG2D in TCR signaling in the natural development of T cells.
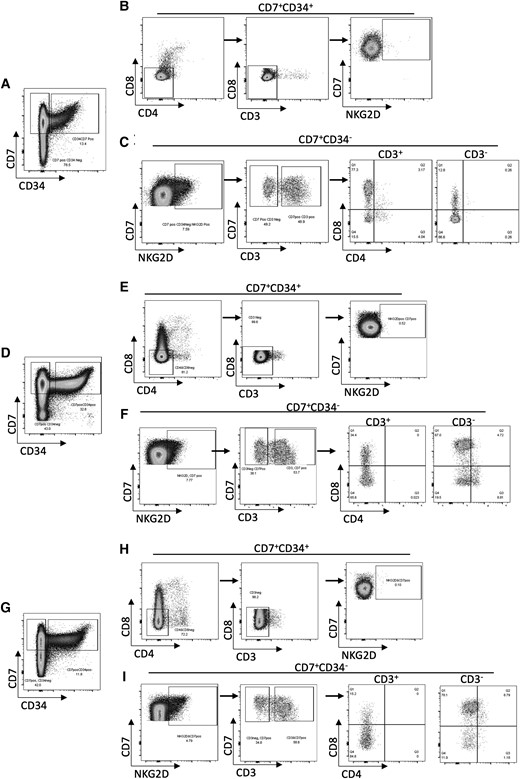
NKG2D is expressed in human thymus. Flow cytometry analysis of 3 healthy human thymus samples. (A, D, G) Cells gated on live CD7+ were divided into CD34+ and CD34−. (B, E, H) CD7 + CD34+ cells were further gated on CD8−CD4− (left), and then into CD3− (middle) to show the NKG2D+ population within CD7 + CD34 + CD3−CD4−CD8− thymocytes (right). (C, F, I) NKG2D+ cells were gated from CD7 + CD34− cells (left), then divided into CD3+ and CD3− (middle). These cells were then separated based on their expression of CD4 and CD8, showing the NKG2D+ population within CD7 + CD34+ thymocytes (right).
4. Discussion
In mature CD8 T cells, NKG2D acts as a TCR costimulatory receptor. However, the role of NKG2D in the selection of T cells during their development in the thymus remains to be defined. In this study, we examined CD8 T cells from B6 and OT-I mice that lacked NKG2D. We report noticeable differences in thymic T cell development, TCR signaling, and function of T cells developed in NKG2D-deficient mice.
We first confirmed the expression of NKG2D in thymocytes of B6 mice.24 Moreover, our flow cytometry analysis of mouse thymocytes further determined the expression of NKG2D (87%) on DN1 T cells (CD44 + CD25−). After demonstrating the expression of NKG2D in the thymocytes, we sought to determine if NKG2D plays a role in T cell development in OT-I mice lacking NKG2D. Thymocytes in these mice showed noticeable alterations in their development. The distribution of DP and SP thymocytes was distorted in the thymus of NKG2D KO mice compared with WT mice. We observed an increase in the DP population and a corresponding decrease in SP cells, suggesting that NKG2D influences positive selection of OT-I cells. Our data indicate that NKG2D is expressed mainly on DN1 T cells. It is plausible that the transition from DN to DP is mostly unaffected. However, if the generated DP cells have a defective imprint, that may affect negative selection. This notion was further supported by the results from the dulling assay, in which DP NKG2D KO T cells did not undergo negative selection compared with WT cells. We found that NKG2D is seemingly not expressed by the SP8 compartment. However, this population is mostly impacted in NKG2D deficient mice. It is important to note that SP cells develop chronologically at the end of T cell thymic education (DN) → DP → SP(1), and that the initial sin appears to have occurred at the DN stage. Thus, SP cells are not affected by changes that occur during their thymic education process at the DN stage.
The altered T cell education in the thymus in the absence of NKG2D profoundly affected peripheral T cells. Using mice with a broad TCR repertoire (B6 mice), we found that NKG2D influences TCRVβ usage compared with B6 mice. In OT-I mice, this altered thymic education resulted in the selection of dysfunctional mature OT-I NKG2D KO CD8 T cells.
NKG2D is mainly expressed by mature CD8 T cells, γδ T cells, and NK cells and is normally absent on CD4 T cells. This observation is consistent with our human thymic T cell analysis.
Notably, our data indicate that in mouse thymic T cells, NKG2D is expressed in DN and SP CD4 T cells. At the moment, we cannot explain the reason for this discrepancy. It has been reported that DAP10 promoter is active in NK and CD8 T cells, but not in CD4 T cells,51 explaining the absence of NKG2D surface expression. However, a few studies have described a subset of CD4 T cells that express NKG2D in some autoimmune diseases.52–55 The general thought is that NKG2D+ CD4 T cells participate in the imbalance of such conditions. Given the common ancestry of CD4 and CD8 T cells, it would not be surprising if CD4 T cells could regain NKG2D expression. This is a new area of interest (i.e. believed to be important in the biology of NKG2D and its functional implication in other immune cells). While it is possible that γδ T cells may account for the differences we observe in the WT and NKG2D KO, the vast majority of T cells are αβ, making it unlikely for γδ T cells alone to account for the changes in T cell development and function that we observe.
We also found that CD5 and CD45, whose expression occurs in response to TCR signaling,31,35 were also reduced in NKG2D KO thymocytes further suggesting that the lack of NKG2D causes changes in the magnitude of TCR signaling. CD5 surface expression is tightly regulated throughout T cell development and depends on the magnitude of the TCR signaling, increasing at both the DP and SP stages, and is maintained on circulating mature SP cells.31 If NKG2D signaling enhances TCR signaling in the thymus, then, in the absence of NKG2D, the magnitude of the TCR signaling in thymocytes would be reduced. Consistent with this notion, our data showed that CD5 is reduced in thymocytes and peripheral T cells from OT-I mice. This observation is further substantiated by the reduced levels of CD3 and CD45 which are inhibitors of TCR signaling and are controlled during T cell development, in response to the strength of the TCR signaling.32,35 Based on the reduced expression of CD5 and CD45 in thymocytes and mature T cells in NKG2D KO mice, we postulate that NKG2D signaling lowers the TCR activation threshold. Supporting this notion, peripheral T cells from NKG2D KO mice failed at achieving an antigen-experienced phenotype (CD44+), proliferating, and producing IFN-γ, TNFα, or IL-2 upon antigen encounter. While our results suggest that the functional impotence of OT-I NKG2D KO cells is due to the absence of TCR costimulation by NKG2D, our data show a decrease in the expression of CD3, CD5, CD45, and Vβ5-1. This implies the lack of OT-I T cell functionality is that NKG2D may be involved in tuning these proteins that are key to TCR signaling.
Our data show that NKG2D is expressed in CD4 SP but not in CD8 SP. However, the functional consequences are more obvious in the CD8 compartment. It is possible that NKG2D plays a role in CD4 T cells selection. Recent data by Karimi et al.56 show that during the transition between DP to SP cells, CD4+ CD8− co-receptor expression precedes CD4− CD8+.
These data may explain the overabundance of NKG2D in the CD4 compartment. The expression of NKG2D in the DP SP transition might be a temporal event (i.e. used to tune CD3, CD5, and Vβ expression). We found no published data showing that DAP10, DAP12, and NKG2D are expressed in early T cell progenitors. However, a critical role for TCF-1 in T-lineage specification and differentiation has been shown.57 Moreover, a more recent study showed a crosstalk between TCF1 and NKG2D.58 This study suggested that the interaction between key developmental transcription factors that play a role in T cell thymic development like TCF1 and NKG2D receptor may occur in early T cell progenitors.
CD28 is considered the archetype of TCR costimulation.59–62 Remarkably, studies using CD28-deficient animals demonstrated no apparent changes in either positive or negative selection of developing thymocytes.63 However, later studies showed that the absence of CD28 in H-Y TCR transgenic female mice resulted in increased numbers of CD8 SP thymocytes.64,65 The study by Walunas et al63 with CD28-deficient T cells shows that CD28 expression is not essential for positive and negative selection of thymocytes or peripheral T cell tolerance. They also found that CD28-deficient T cells achieve activation status and proliferate and produce cytokines but undergo apoptosis.63 These results emphasize the differences between CD28 and NKG2D signaling. Based on these studies and our data, we proposed that if the defects in NKG2D KO T cells were due to inefficient TCR signaling bypassing the TCR would rescue their function. This assumption was partially correct, as our experiments using anti-CD3/CD28 mAbs indicate that OT-I NKG2D KO CD8 T cells can be fully activated (CD44+) and achieve proliferation and are indistinguishable from activated WT T cells. Paradoxically, activated OT-I NKG2D KO cells were catastrophically defective at responding to target cells, as shown by the absence of polycytokine production and the lack of cytolytic activity. Given that anti-CD3/CD28 mAb activation can be considered a strong TCR-independent stimulus, we concluded that in OT-I NKG2D KO CD8 T cells, the observed defects are not due to the simple defect of the TCR/CD3 signaling complex. Given that, the IS is not exclusively mediated by the TCR/MHC complex. For example, other protein-ligand interactions (CD4, CD8, CD28) are known to be part of the IS.66 There is the possibility that NKG2D signaling affects the IS between the T cells and APC or target cells. This IS is a functional structure that has been found to be important in regulating T cell responses.66–70 This hypothesis is strengthened by the study from Markiewicz et al. showing that NKG2D participates in IS formation and might be responsible for TCR recruitment in the synapse.25
To directly assess the impact of NKG2D on TCR signaling without influence from exogenous factors, such as helper cells or additional cytokines, which could affect the TCR threshold, we used an in vitro reductionist approach consisting of only T cells and an activation mediator (peptide or antibodies). It is likely, however, that during in vivo immune responses, other immune cells, like CD4 T cells or dendritic cells, might be able to overcome the defects observed upon in vitro activation with the cognate OVA peptide of anti-CD3/CD28 mAbs. Indeed, in vivo primed NKG2D KO T cells can mount effector antiviral responses. However, these activated NKG2D KO CD8 T cells failed to form a protective memory response against viral infection.71 In a different study, Groh et al7 showed that adoptively transferred OT-I CD8 T cells into a transgenic mouse ubiquitously expressing the human NKG2D ligand MICA rendered these T cells unresponsive to NKG2D due to constant downregulation of the receptor. While the authors did not assess the effector responses of these T cells activated in the absence of NKG2D signaling, they showed that the memory OT-I CD8 T cells were not protective against tumor challenge. Furthermore, in a previous study, we showed in vivo that transient NKG2D blockade with a monoclonal antibody during WT T cell effector responses resulted in the formation of highly defective memory cells.12 More importantly, the WT T cell response during the effector phase were not affected by the temporary blockade. These in vivo results are different from our in vitro results obtained with NK2GD KO CD8 T cells activated with anti-CD3/CD28 mAbs. We found significant functional defects in effector NKG2D KO CD8 T cells. This discrepancy suggests that the imprint acquired during thymic education, rather than the absence of NKG2D during T cell responses, is responsible for the observed deficiency in in vitro activated OT-I NKG2D KO CD8 T cells.
To establish at what level NKG2D deficiency affects TCR signaling, we investigated the activation of S6 and ERK. S6 is an essential component of the ribosome and is phosphorylated upon TCR activation.72 The role of S6 in T cells is ample, encompassing T cell development, growth, proliferation, and differentiation.73–76 Studies have shown that complete deletion of S6 in CD4 T cells abrogated T cell development. However, the hemizygous expression does not affect thymic T cell education but impacted cell cycle progression.76 Given these studies and our data showing that S6 is inefficiently phosphorylated in OT-I NKG2D KO cells, it would be logical to consider that the short- and long-term alterations seen in OT-I NKG2D KO T cells are also attributable to reduced S6 activation. ERK is one of the earliest effectors directly induced by TCR signaling and is indispensable for producing multiple cytokines upon TCR stimulation.77,78 Consistent with a defect in TCR signaling and the lack of cytokine production, we found that, in contrast to WT cells, antigen experienced (CD44+) NKG2D KO cells fail at phosphorylating ERK or producing cytokines upon TCR engagement.79 Interestingly, our analysis shows that in contrast to peptide, anti-CD3/CD28 agonistic mAbs are sufficient to mediate the expression of CD25 on NKG2D KO T cells. These data indicate CD25 expression upon anti-CD3/CD28 mAbs activation occurs independently of ERK. Indeed, CD25 transcription is driven by NFAT.80 Our data also indicate that the TCR strength requirement for CD25 expression is lower than those for cytokine production.
Cytokines are an essential driver of T cell function. IL-15 can directly modulate TCR signaling by decreasing its activation threshold.42 Our analysis indicates that NKG2D KO cells maintain their capacity to respond to IL-15, similar to WT cells, suggesting that the functional defects seen in NKG2D KO T cells are not attributable to the lack of response to IL-15. Another possible explanation for the defect observed in NKG2D KO CD8 T cells is that in the absence of NKG2D, CD8 T cells express more inhibitory receptors, which can interfere with TCR signaling and T cell functions. However, the cell surface expression of the activation-dependent markers PD-1, Tim-3, and Lag-3 were not increased in the absence of NKG2D. While not typically associated with CD8 T cell development, studies have shown that IL-17 can play a role in T cell differentiation, so it is possible that IL-17 may have a role in the responses that we observed.81
T cell development occurring in the thymus is an exceedingly complex process in which their developmental signals are well choreographed during the transition from the T cell precursor stage into mature T cells. In this study, we present data depicting a novel and fundamental role for NKG2D and establish the functional importance of this receptor in the education of T cells. Our study indicates that NKG2D participates in thymic education by reducing the TCR threshold and impacting the functional imprint of the generated T cells that populate the periphery. These findings have a direct impact on our understanding of the developmental processes that are necessary for the proper education of T cells occurring in physiological conditions.
Author contribution
C.P. and J.A.G. designed experiments. C.P., L.P.-R., K.P., E.K., B.B., A.K., A.U., M.Z.N., S.Z., A.A., and M.D.R. conducted experiments. C.P., L.P.-R., P.L., and J.A.G. interpreted the experiments. C.P., L.P.-R., J.C.B., P.L., and J.A.G. wrote the manuscript. All authors contributed to editing the manuscript.
Supplementary material
Supplementary materials are available at Journal of Leukocyte Biology online.
Funding
This study was supported by R01CA188395, R01CA250514, and the VoLo Foundation.
References
Author notes
Cynthia Perez and José A Guevara-Patino contributed equally to this work.
Conflict of interest statement. None declared.
