


Abstract
Asthma is a chronic inflammatory disease of the airways that afflicts over 30 million individuals in the United States and over 300 million individuals worldwide. The inflammatory response in the airways is often characterized by the analysis of sputum, which contains multiple types of cells including neutrophils, macrophages, lymphocytes, and rare bronchial epithelial cells. Subtyping patients using microscopy of the sputum has identified both neutrophilic and eosinophilic infiltrates in airway inflammation. However, with the extensive heterogeneity among these cell types, a higher resolution understanding of the inflammatory cell types present in the sputum is needed to dissect the heterogeneity of disease. Improved recognition of the distinct phenotypes and sources of inflammation in asthmatic granulocytes may identify relevant pathways for clinical management or investigation of novel therapeutic mediators. Here, we employed mass cytometry or cytometry by time-of-flight to quantify frequency and define functional status of sputum derived airway cells in asthmatic patients and healthy controls. This in-depth single cell analysis method identified multiple distinct subtypes of airway immune cells, especially in neutrophils. Significance was discovered by statistical analysis as well as a data-driven unbiased clustering approach. Our multidimensional assessment method identifies differences in cellular function and supports identification of cellular status that may contribute to diverse clinical responses. This technical advance is relevant for studies of pathogenesis and may provide meaningful insights to advance our knowledge of asthmatic inflammation.
1 Introduction
Asthma is a chronic inflammatory disease of the airways that afflicts over 30 million individuals in the United States and over 300 million individuals worldwide.1 It is characterized by bronchial hyperreactivity and variable chronic respiratory symptoms that are nonspecific in the clinic—asthma is now recognized to be clinically and biologically heterogeneous.2 While a majority of individuals have mild disease and mild symptoms that are easily controlled, 10–15% of individuals have severe asthma and require higher doses of inhaled corticosteroids (ICS), are more likely to require hospitalization or oral corticosteroids, and have worse lung function.3 Biologically, most patients have airway inflammation that is characterized by T2 inflammation, a specific IgE production, mucus production, and infiltration of eosinophils, T cells, and monocytes.4 A minority of patients have what is termed non-T2 disease and lack allergies. The inflammatory response in these patients is poorly understood but is typically associated with neutrophilic inflammation and no specific IgE response.5,6
Heterogeneity is a hallmark of asthma symptomatology and response to therapy.7 There is increasing appreciation that asthma is driven by both adaptive and innate immune responses to varying degrees in every individual. This underscores the need for a higher resolution understanding of the inflammatory responses associated with the disease. Neutrophils are generally the most abundant immune cells recovered from sputum; however, the heterogeneity of these cells and their function in the airway in asthma remains incompletely understood.8 While the cytokines and effector cells associated with a T2 inflammatory response have been extensively studied, our understanding of granulocyte populations including eosinophils and neutrophils remains limited. A more in-depth understanding of granulocyte subsets present in the airway and their function in both T2 and non-T2 disease will improve our understanding of asthma heterogeneity and move us toward more precise approaches to treating asthmatic (AS) patients.9
Powerful technical advances now allow phenotypic profiling of protein and gene expression from primary airway cells with only a few thousand cells. These single cell technologies have provided techniques that can resolve disease in humans at an unprecedented level of detail, capturing the clinical and biological heterogeneity of disease. In addition, definition of the microbiome—from airway and gut—may provide a mechanistic link to disease severity.10 Thus, we now have the potential to identify inflammatory pathways within a single patient, paving the way for more targeted therapies to treat asthmatics who remain refractory to medication even with current biologics.11
We have previously taken advantage of the novel cell profiling platform, cytometry by time-of-flight (CyTOF), to detect cells in induced sputum and numerous studies have validated this platform for multiparameter profiling of single cells from heterogeneous populations.12–16 Here, we describe the methods that are currently in use to noninvasively collect and analyze cells from sputum samples from patients enrolled in the Yale Center for Asthma and Airway Diseases (YCAAD) asthma phenotyping protocol.17,18 We focus on the profiling of granulocytes, monocytes, and macrophages using standard gating approaches, computational profiling, and a hybrid of both approaches. This in-depth profiling can define functional cell subsets relevant both for investigation of disease mechanisms and for the potential integration of single-cell technology into clinical trial research.
2 Methods
2.1 Human subjects
AS and healthy control (HC) participants were enrolled with written informed consent under the guidelines of the Institutional Ethics Committee of Yale University, which approved this study. Samples were obtained as part of the YCAAD phenotyping protocol, which collects clinical characteristics and induced sputum samples according to established protocols.19–21 Asthma diagnosis was adopted from the Global Initiative for Asthma guidelines: historic evidence of variable airflow obstruction determined by: a) an improvement in Forced expiratory volume (FEV)1 > 12% and 200 ml compared to baseline after a short-acting bronchodilator, or treatment with corticosteroids; b) 20% diurnal variation of peak expiratory flow rates; c) airway hyperreactivity assessed using methacholine of <8 mg/ml to cause a 20% decrease in FEV1 (PC20).19,22 HCs were nonsmokers (former smokers who had not smoked in 1 yr or more and smoked ≤10 pack years) without fever or antibiotics at the time of sputum induction and confirmed to have no history of lung disease per patient report and/or medical record review.
2.2 Sample collection and processing
Airway cell samples were acquired by sputum induction with hypertonic saline as described previously with minimal processing and gentle treatment of cells to optimize viability.7,12 Noninvasive induction of sputum offers some benefits for investigations of airway cells as it is cost effective and subject friendly, compared to endoscopically acquired bronchoalveolar lavage (BAL) cells. It is also the site of inflammation in most airway diseases (i.e., asthma), so preferred for some studies, and abnormalities detected in the sputum may be reflective of processes occurring in the alveolar compartment.18 Differences between lavage and induced sputum cell populations center on neutrophils that are found in the sputum in normal individuals, but rare in normal BAL.23 Mucus plugs were isolated from sputum sample on the day of collection, washed, dissolved in DTT (Calbiochem/EMD Millipore, Billerica, MA, USA), and centrifuged to generate cell pellet and supernatant as described. Cell viability was assessed microscopically using trypan blue staining. Airway cells were resuspended in RPMI-1640 (0.5–2.0 × 10⁶ cells/ml) and treated with 25 U/ml DNAse (Sigma-Aldrich, St. Louis, MO, USA) and 150 U/ml collagenase IV (Worthington Chemical, Lakewood, NJ, USA) for 15 min at 37°C as described previously.7,12,19-21
2.3 Sample labeling and mass cytometry acquisition
Surface markers on fresh airway cells were labeled prior to fixation for optimal labeling of certain cell lineage markers as described previously in detailed staining protocols.12,16,24 Metal-conjugated antibodies (Supplemental Table 1) for labeling cells were purchased (Fluidigm, Markham, ON, USA), or carrier-free antibodies were conjugated in house using MaxPar X8 labeling kits according to manufacturer’s instructions (Fluidigm). Eosinophil peroxidase marker (EPX) antibody was the generous gift of Elizabeth Jacobsen, Ph.D., from the Mayo Clinic (Scottsdale, AZ, USA).25 Briefly, each sample was processed within 1 h of collection and labeling was conducted immediately on freshly isolated samples on the day of collection. Sputum cells were washed with CyFACS buffer (PBS with 0.1% BSA, 2 nM EDTA, 0.05% Na azide; Maxpar Cell Staining Buffer; Fluidigm, South San Francisco, CA, USA). To detect viability, cells were resuspended in 5 μM cisplatin (Sigma-Aldrich, St. Louis, MO) for 5 min and quenched with 100% FBS. Samples were incubated with 11% Fc blocking buffer (Biolegend, Dedham, MA, USA), surface labeled with the antibody cocktail for 30 min on ice, and then fixed (BD FACS Lyse) and frozen at −80°C. To reduce variation, intracellular labeling was conducted on batches of samples (10–20/d). Fixed cells were permeabilized (BD FACS Perm II, Farmingdale, NY) for labeling with intracellular antibodies for 45 min on ice. Cells were suspended overnight in iridium interchelator (125 nM; Fluidigm) in 2% paraformaldehyde in PBS and washed 1× in PBS and 2× in H2O immediately before acquisition. Samples were run on Helios 2 CyTOF instrument at a flow rate of 30 μl/min and a minimum of 100,000 events was collected. Numerous measures were adopted to reduce variation in the study including uniform protocols for sample collection and processing, a single lot of antibody reagents, and use of EQ Calibration beads (Fluidigm) for normalization in every run.
2.4 CyTOF data processing and analysis
Raw FCS files were bead normalized26 and imported to Cytobank for gating (accession #88361). Live cells were determined following exclusion of debris (DNAlo), dead cells (cisplatinhi), and doublets (event count >40) using the default data transformation of a hyperbolic arcsine with cofactor 5 (Supplemental Fig. 1). Statistical analysis of population frequency data is shown as relative abundance (Fig. 1B) in consideration of the small cohort size and was performed using GraphPad Prism 8. Frequency data were further assessed with log ratio transformation to control for dependency intrinsic to compositional data using , and to perform Sidak’s multiple comparison testing. Individual subsets from the data were furthered compared using CyTOFKit, an R package for analyzing mass cytometry data (github.com/JinmiaoChenLab/cytofkit). We used the FlowSOM algorithm27 to define nine clusters each for granulocytes (markers: HLA-DR, IL-5, CD69, IL-5R, MIP-1β, IL-6, eotaxin, CD62L, IL-8, CCR3, CD16, and Siglec-8) and monocyte/macrophages (markers: CD16, HLA-DR, CD80, IL-4, IL-6, CD14, CD11b, IL-5, CD69, Eotaxin, TNF-α, IL-13, IL-17, IL-8, and CD62L). To prevent larger samples having an outsize effect, a maximum of 5000 cells/sample was randomly selected for clustering. Cells were visualized using a T-distributed Stochastic Neighbor Embedding (t-SNE) plot with granulocyte clusters using perplexity =173, iterations =1500, and random seed = 42 and monocyte/macrophage/monocyte clusters with perplexity =206, iterations =1500, and random seed = 42.
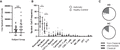
Frequency of cells from sputum. Induced sputum samples from asthmatic (AS, n = 18) and healthy control (HC, n = 9) subjects were labeled fresh on the day of collection with metal-conjugated antibodies and analyzed by mass cytometry. (A) Live cell yields median ± interquartile range, Mann-Whitney test, NS (P-value = 0.1633). (B) Frequency of cell subsets, individual samples with median ± interquartile range; Wilcoxon’s signed rank test, *P < 0.01. (C) Relative frequency of macrophage subsets. Data shown are median frequency of all samples; Wilcoxon’s signed rank test, *P < 0.01
3 Results
3.1 Profile of airway cell phenotypes
To provide more in-depth definition of sputum cells in asthma and heterogeneity of functional status that may be relevant clinically or therapeutically, we quantified immune cell subsets of untreated sputum samples in a cohort of well-characterized adult AS patients compared to healthy volunteers (Table 1). We employ noninvasively collected sputum as it reflects an important site of inflammation in airway diseases and, in contrast to BAL, offers benefits of being cost effective, noninvasive, and subject friendly. In addition, induced sputum samples allow evaluation of neutrophils from healthy subjects, which is unusual from the alveolar compartment.28,29 We employed a 42-marker antibody panel focused on defining neutrophil phenotypes and functional status (Supplemental Table 1). Cell counts and frequencies of immune cell subsets were determined after manual gating according to a standard strategy (Supplemental Fig. 1), with exclusion of debris (DNAlo), doublets (event count >40), and dead cells (cisplatinhi). When we compared samples of sputum from AS subjects and HCs, we found that the total number of live cells recovered from a sputum sample was not different between AS and HC subjects (Fig. 1A; AS 29,217 ± 5108 vs. HC 62,144 ± 17,509, mean ± sem; Mann-Whitney NS). The viability of cells from both groups was high (71.4%) and was not different between AS patients and HCs (AS 70.6 ± 2.7%; HC 73.3 ± 6.2%, NS). Similarly, the percentage of live singlet cells detected was equal for both groups (28% of total events). Cytokeratin+ squamous epithelial cells were present at ≤5% of total and were not different between groups (AS 4.1 ± 1.3; HC 2.0 ± 0.6; NS). This demonstrates that the total yield of viable cells is sufficient for in-depth characterization of sputum as we have previously shown that as few as 10,000 cells can provide statistically equivalent detection of major cell subjects in peripheral blood mononuclear cells.30
Study subject demographics and clinical status
| Severe asthmatics | Moderate/mild asthmatics | Healthy controls | |
|---|---|---|---|
| (n = 7) | (n = 11) | (n = 9) | |
| Demographics | |||
| Age mean ± sd, | 48.14 ± 14.22 | 50.36 ± 15.70 | 43.89 ± 16.82 |
| Sex female, (n), % | (5/7) 71.43% | (7/11) 63.64% | (8/9) 88.89% |
| Race/ethnicity (n) | |||
| Caucasian | 3 | 6 | 5 |
| African American/Black | 4 | 5 | 1 |
| Asian | 0 | 0 | 2 |
| Other | 0 | 0 | 1 |
| Hispanic/Latino | 1 | 1 | 0 |
| BMI mean ± sd | 38.38 ± 5.31 | 28.44 ± 6.33 | 25.39 ± 7.10 |
| Clinical characteristics | |||
| FEV1% (mean ± sd) | 65.5 ± 18.22 | 74.36 ± 16.43 | |
| L (mean ± sd) | 1.98 ± 1.09 | 2.11 ± 0.68 | |
| BD reversibility % (mean ± sd) | 4.5 ± 6.3 | 8.2 ± 5.5 | |
| ICS total/day mcg (mean ± sd) | 934 ± 206 | 268 ± 203 | |
| Biologic use | (2/7) 29% | (1/11) 9% | |
3.2 Altered frequency of immune cell subsets in asthmatic patients
To provide in-depth profiles of airway cells in asthma, sputum samples were labeled with antibodies for cell lineage specific surface markers (n = 28). We quantified differences in 13 distinct cell subsets simultaneously using a manual gating strategy to define airway cell types (Supplemental Fig. 1). As expected, the most abundant live cell population in sputum in both asthmatics and HCs was neutrophils, which were higher in frequency in AS patients consistent with increased inflammation in asthma (Fig. 1B; AS 48.2; HC 40.9; P < 0.01). Monocytes and macrophages, the second-most abundant cell type in sputum, were lower in AS patients compared to HCs (Fig. 1B; AS 16.8%; HC 35.6%; P < 0.01). While monocytes and macrophages in sputum have historically been defined morphologically, here we used expression levels of CD14 and CD16 to define distinct subsets of “classical” CD14++CD16−, “intermediate” CD14++CD16+, and “nonclassical” CD14+/lowCD16+ macrophages in the sputum,31 which have been shown to have distinct functions.32,33 Monocytes and macrophages from sputum were predominantly CD16+ (nonclassical; Fig. 1C) and were lower in AS patients (AS 12.2% vs. HC 25.8%). Nonclassical CD16+ cells have been reported to be lower in the blood in patients with severe asthma,34 but this is the first demonstration of this in the sputum, which may contribute to an impaired ability to handle debris in the airway and promote damage and inflammation.35,36 Eosinophil frequency in this small cohort trended toward an increase in asthmatics (Fig. 1B; AS 0.92% vs. HC 0.64%), and for some samples included labeling with the specific marker EPX (Supplemental Fig. 2), which will be especially valuable in future studies.37 Additional cell types present in lower frequencies are readily detected by CyTOF (Fig. 1B) and defined by expression of surface markers as T lymphocytes (CD4+ and CD8+), B lymphocytes, NK cells, dendritic cells, and cytokine-producing innate lymphoid cells (ILCs).38 Notably, ILC2s in the T-cell population were identified following a multistep gating strategy through negative expression of lineage markers, levels of T-cell markers CD4 and CD8, and positive expression of IL-7Ra (Supplemental Fig. 2C).39 No significant differences in frequencies between AS patients and HCs were detected for these less abundant cell types.
3.3 Heterogeneity and functional status of sputum immune cells in asthmatic patients
Sputum cell composition across AS patients was strikingly heterogeneous, which is a known characteristic of asthma.40 While overall the AS patients had more neutrophils compared to the HCs, individual asthmatics showed dramatic differences from one another in the proportion of neutrophils (Fig. 2A). Indeed, the proportion of neutrophils ranges widely from 6.7% to 83.3% and differs between individuals within each severity group. Other cells types were also highly variable including macrophages (1.5–53.9%) and eosinophils (range 0.1–25.9% of total). Lower levels of eosinophils may also be due to being well controlled with medication (i.e., ICS or mepolizumab) at the time of the visit.41 Differences detected in the frequencies of 13 distinct immune cell subsets highlight significant differences expected between patients and controls (Fig. 2B) and may have implications for pathogenesis and subtyping of asthma.3,40,42
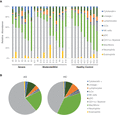
Frequencies of sputum cell subpopulations in asthmatics (AS) and healthy controls (HCs). Induced sputum samples from asthmatic AS (n = 18) and HC (n = 9) subjects were labeled fresh on the day of collection with metal-conjugated antibodies and analyzed by mass cytometry. Frequency of immune cell subsets among individuals displayed using Boolean analysis (A) and median values in each population by group (B)
To assess the implications of these differences in cell frequencies for pathogenesis, we assessed the functional status of the airway cells. Differences in cellular activation status between AS patients and HCs can be readily detected ex vivo by quantifying levels of key immune markers in untreated sputum. CyTOF supports analysis of 18 functional markers (Supplemental Table 1) in each of the 13 distinct subsets simultaneously. While this in-depth multidimensional assessment provides valuable insights for cellular function, the scale and complexity of CyTOF data present challenges for routine analytic approaches.
3.4 Clustering of granulocytes in asthmatic and healthy control sputum samples
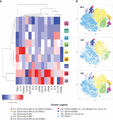
To accelerate analysis and identify additional structure in the CyTOF data, we focused on granulocyte subsets (CD66b+, CD15+; Supplemental Fig. 1) because these cells are the most abundant in the sputum and have a known role in asthma pathogenesis. To gain functional information about subpopulations, we employed a data-driven technique for clustering and dimensionality reduction, FlowSOM,27 to generate an unsupervised self-organizing map. The FlowSOM heatmap analysis revealed nine distinct clusters of granulocytes with different levels of expression of functional markers indicated by channel intensity for each marker within each cluster (Fig. 3A). Based on their marker expression, individual cells are clustered in phenotypic groups with shared expression levels, which can be interpreted to define functional cell subsets. IL-8, a key marker and an important neutrophil chemotactic factor, is present at very high levels in clusters 1 and 9 and very low levels in clusters 3, 6, and 8. Similarly, proinflammatory cytokines IL-6 and MIP-1β, which identify more activated phenotypes, are very highly expressed in cluster 3 and absent in clusters 5 and 6.

Functional clustering analysis of asthmatic (AS) and healthy control (HC) granulocyte populations. Induced sputum samples for AS (n = 4) and HC (n = 3) were labeled fresh on the day of collection with metal-conjugated antibodies and analyzed by mass cytometry. Granulocytes identified through manual gating were analyzed using FlowSOM to identify nine distinct clusters with Z scored median expression level of channel intensity for each marker in each cluster (A). Visualization using tSNE (B) for all samples (ALL; top), AS patients (middle), and HCs (bottom)
The functional differences in the clusters were more readily visualized in a two-dimensional tSNE plot of all samples with the FlowSOM clusters overlaid (Fig. 3B). The largest number of cells is found in clusters 1 and 4 and the fewest in clusters 6 and 8. The majority of the neutrophils were in cluster 1, which includes expressions of IL-17A and IL-8, both proinflammatory cytokines associated with neutrophil recruitment and activation. Further, striking differences in neutrophil status are apparent when the clusters (Fig. 3B, ALL; top panel) are separated between the HCs (Fig. 3B, AS; middle panel) and AS patients (Fig. 3B, HC; bottom panel). In-depth examination of clusters being expressed in one but not the other group shows clusters 2, 3, and 4 were highly expressed in asthmatics and absent in the HCs. Markers in these clusters reflect high expression of IL-6, MIP-1β, CCR3, Siglec-8, IL-13, and IL-17, which are characteristic of an inflammatory activity associated with cell activation.43 In contrast, clusters 5 and 6 are largely present only in HCs and express little to no cytokines, and are negative for CD69, a marker of cell activation, and would be expected to contribute less to inflammatory processes. Both clusters 5 and 6 contain cells expressing HLA-DR, whereas cluster 5 was positive for the IL-4Rα and cluster 6 had increased IL-5R and IL-13R1 expression. This clustering suggests two specialized subsets of neutrophils in the airway of healthy donors, which, in an individual with asthma, could become activated when there is T2 inflammation and increased levels of IL-4, -5, and -13 being generated by activated bronchial epithelial cells and T cells. Cluster 4, which is also highly expressed in asthma and largely absent in HCs, includes neutrophils that are positive for eotaxin expression, a recruitment factor for eosinophils, and IL-7R, which plays an important role in the activation of type 2 ILCs.44 Neutrophil subsets in cluster 4 also express low levels of CD62L (CD62Ldim), a marker of an activated neutrophil subset reported to play a role in inflammation and airway cell responses.45,46 Expression of CCR3 and Siglec-8 in clusters 2 and 3 suggest these clusters include eosinophils, which are critical mediators of allergic asthma. Indeed, detailed examination of cluster 3, with high expression of IL-3R, CD69, IL-5, combined with low levels of CD62L, suggests that this population may represent inflammatory eosinophils, a recently described subset in AS sputum.47
3.5 Clustering of monocyte and macrophage populations in asthmatic and healthy control sputum samples
To dissect the heterogeneity of sputum cells between asthmatics and HCs, we performed the same cluster analysis on monocyte/macrophages, the second-most abundant cell type in sputum. Using FlowSOM clustering for monocyte/macrophage populations (CD66b-, CD15-; Supplemental Fig. 1), individual cells are clustered in phenotypic groups with shared channel intensity expression levels resulting in nine distinct functional clusters (Fig. 4A). Subsets were defined using expression of canonical markers CD14 and CD16, and expression of HLA-DR and CD80, markers involved in antigen presentation and costimulation, which are up-regulated in an activated state.
Functional clustering analysis of asthmatic (AS) and healthy control (HC) macrophage/monocyte populations. Induced sputum samples for AS (n = 4) and HC (n = 3) were labeled fresh on the day of collection with metal-conjugated antibodies and analyzed by mass cytometry. Macrophages and monocytes identified through manual gating were analyzed using FlowSOM to identify nine distinct clusters with Z scored median expression level of channel intensity for each marker in each cluster (A). Visualization using tSNE (B) for all samples (ALL; top), AS patients (middle), and HCs (bottom)
The majority of cells expressed CD16, as seen in clusters 1, 2, 3, and 9 (Fig. 4A and Supplemental Fig. 5). HLA-DR, and MHC II molecule, was highly expressed among clusters 2 and 4, indicating enhanced antigen-presenting capabilities among these cells. CD80 was expressed in clusters 6 and 8.
Based on their marker expressions that were visualized using a tSNE plot (Fig. 4), HCs showed higher expression of clusters 1 and 2, including CD16, and very low expression of activation or proinflammatory cytokine markers. In contrast, AS subjects had higher expression of clusters 6, 7, and 8, including elevated expression of proinflammatory markers such as HLA-DR, IL-6, TNF-α, and CD69. Cluster 6, although a rare population, expressed the highest level of CD14 typical of “classical” monocytes, and many cytokines known to be involved in the pathogenesis of asthma, including IL-17A, IL-13, IL-5, and eotaxin (Fig. 4 and Supplemental Fig. 5).44 Eotaxin and IL-5 expression suggest that cells in this cluster may play a role in eosinophil recruitment and survival. Cluster 8 uniquely expresses high levels of the integrin CD11b as well as dim expression of CD62L, a selectin ligand, a pattern of adhesion markers which may reflect recent migration into the airway. Cluster 9 includes cells expressing IL-17 and IL-8 (Supplemental Fig. 5) without high expression of other markers. Such clustering can phenotype monocytes/macrophages subsets and distinguish functional subsets of cells, such as highly abundant alveolar macrophages implicated in the pathogenesis of asthma, and alternatively activated macrophages increased in AS BAL fluid.48–50
4 Discussion
Here, we have employed the high parameter cellular data obtained using CyTOF to identify cellular status of airway cells from a limited cohort of samples. This technical advance identified multiple subtypes of airway immune cells, which show distinct profiles both between HCs and AS patients, which are relevant for pathogenesis. This method development demonstrates the power that single cell profiling technologies bring to understanding phenotypes of asthma that have broad therapeutic and scientific implications especially when applied across a larger cohort of subjects. CyTOF can overcome the historic obstacles of tremendous heterogeneity in a relatively small cell sample size of sputum. The enhanced marker detection (>45 markers) combined with advanced clustering techniques dramatically improves our ability to analyze live heterogeneous cell subsets. Improved recognition of distinct cellular phenotypes and functions provide insights into cell functions such as the recently described low density neutrophils, which correlate with disease progression in lung cancer patients.51 In concert with single cell RNASeq, these advances have recently identified a new cell type, the ionophore, that contributes to the pathogenesis of cystic fibrosis,52 and changes in alveolar macrophages and epithelial cells during the progression of pulmonary fibrosis.53 These approaches may identify relevant pathways that significantly advance the personalization of clinical asthma management and identification of novel therapeutic mediators.
As these in-depth methods gain a foothold in translational studies, it is a natural progression to expand the use of CyTOF into clinical trials. Use of single-cell technologies in clinical trials can augment findings with important mechanistic insights derived from collected samples. High-dimensional datasets can give investigators a comprehensive view of disease pathogenesis within individual patients and across cohorts, shed light on heterogeneous cellular responses, and may help reveal mechanisms relevant to understanding responders and nonresponders. To this end, our group has established relevant parameters to support integrating single cell technology into a multisite clinical trial. In collaboration with the Inner-City Asthma Consortium (ICAC), we have introduced an immune substudy to the ongoing MUPPITS-2 trial, a phase III study evaluating the efficacy of mepolizumab in pediatric asthmatics (ClinicalTrials.gov Identifier: NCT03292588).54,55 We have adapted our methods to assess sputum samples collected as part of the trial and hope that the addition of CyTOF to this study will identify meaningful differences that contribute to diverse clinical responses and advance our knowledge of AS inflammation.
Acknowledgments
This work was developed with the CyTOF working group of the Inner-City Asthma Consortium (ICAC) with PI William W. Busse, University of Wisconsin School of Medicine, Madison (WI, USA). The authors gratefully acknowledge the valuable assistance of the Yale Center for Asthma and Airway Diseases, the Yale CyTOF facility, Ms. Shelly Ren, Ms. Nicole Grant, and Ms. Jean Estrom. This work was supported in part by the National Institutes of Health (ICAC-3; R01 HL118346, R01 HL-095390, 1K01HL125514-01).
Authorship
G.L.C. and R.R.M. contributed equally. G.L.C. and R.R.M. were responsible for the conceptualization and all authors were responsible for the investigation, data curation and analysis, and writing.
Disclosures
The authors declare no conflicts of interest.
References
