


Abstract
Visceral pleural invasion is an adverse prognostic factor in non-small-cell lung cancer, but its value in small-cell lung cancer remains unclear. Thus, we investigated the prognostic impact of visceral pleural invasion in patients with surgically resected small-cell lung cancer.
We queried the Surveillance, Epidemiology and End Results Program database for patients diagnosed with stages I–III (excluding N3 and nodal metastasis cannot be evaluated (NX)) small-cell lung cancer from 2004 to 2016, who underwent surgery. To minimize unbalanced baseline characteristics between the visceral pleural invasion and non-visceral pleural invasion groups, one-to-one propensity score matching was employed. A Kaplan-Meier curve was used to compare the overall survival of the two cohorts. A Cox proportional hazards model was adopted to determine the impact of visceral pleural invasion on survival.
Of the 1416 patients included, 372 (26.27%) presented with visceral pleural invasion. Patients with visceral pleural invasion showed significantly worse overall survival (P < 0.001) both before and after propensity score matching. Multivariable analysis indicated that visceral pleural invasion was an independent adverse factor affecting survival. Patients with visceral pleural invasion showed poorer overall survival (hazard ratio: 1.44; 95% confidence interval: 1.17–1.76; P < 0.001). Subgroup analyses revealed that the non-visceral pleural invasion group was associated with favourable overall survival in N0 patients (P = 0.003) but not in N1 or N2 patients (P = 0.774 and 0.248, respectively). Patients diagnosed at younger ages, females, lower N stage, resection with a lobectomy and adjuvant chemotherapy were associated with improved overall survival in the visceral pleural invasion group.
Visceral pleural invasion was an indicator of a poor prognosis for small-cell lung cancer, especially in those with N0 disease. Adjuvant chemotherapy significantly improves patient outcomes for patients with visceral pleural invasion.
Introduction
Small-cell lung cancer (SCLC) is an aggressive, high-grade neuroendocrine malignancy characterized by rapid tumour growth, early metastasis and poor prognoses (1–3). Combined chemotherapy and thoracic radiotherapy are the standard management for limited-stage SCLC, and surgical resection is allowed for stages I–IIA SCLC per National Comprehensive Cancer Network (NCCN) guidelines (4). However, an increasing number of studies has suggested that surgical resection can improve survival rates in limited-stage SCLC patients (5–8).
The Veterans Administration Lung Study Group’s two-stage system is the most widely used disease staging classification scheme for patients with SCLC, including limited and extensive stages (9,10). However, NCCN and the International Association for the Study of Lung Cancer have proposed that clinical researchers should use the Tumour-node-metastasis (TNM) staging system, which provides a more accurate evaluation of prognosis and potentially helps select the treatment modality in clinical practice (10,11). The staging criteria of SCLC were identical to those for non-small-cell lung cancer (NSCLC).
Visceral pleural invasion (VPI), defined as tumour extension into the elastic layer, has been recognized as an indicator of poor prognosis for NSCLC patients (12–22). In the seventh and eighth TNM staging systems, VPI has been noted as a size-independent T2 descriptor, upgrading tumours ≤3 cm from T1 to T2a (23). One plausible explanation is that VPI seems to be associated with severe lymphovascular invasion and propagation of cancer cells throughout the pleural cavity (16,20). In addition, some reports showed that VPI was closely related to mediastinal nodal metastasis and post-operative recurrence (12,17,23). However, the relationship between VPI and SCLC prognosis has not been clarified. Therefore, we aimed to assess whether VPI affects SCLC prognoses using a propensity score matching (PSM) analysis.
Patients and methods
Data sources
Data from the Surveillance, Epidemiology and End Results (SEER) Program database were extracted. The database includes information on cancer incidence, treatment and survival for ~28% of the US population (21). We extracted research data with the reference number 10281-Nov2019 using SEER*Stat 8.3.8. As individual patient data were de-identified in the SEER database, approval from an ethics committee or institutional review board was not required.
Study population
We identified all patients with histologically confirmed stages I–III SCLC (histology/behaviour codes 8041/3, 8042/3, 8043/3, 8044/3 and 8045/3) diagnosed between 2004 and 2016. Patients ≥18 years and those who underwent pneumonectomy, lobectomy and sublobar resection (segmentectomy and wedge resection) were included, whereas those with distant metastases, of unknown VPI status and number of lymph nodes (LNs) examined, and missing tumour size and stage information were excluded. Patients with N3 and NX disease and those without detailed data and follow-up information were excluded. Due to the likelihood of degradation, patients treated with preoperative radiotherapy were excluded. A flow diagram is presented in Fig. 1.
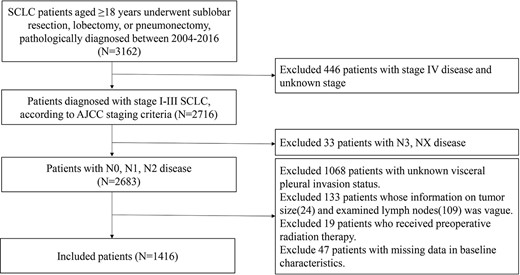
Flowchart of patient selection.
Baseline characteristics, therapeutic information and survival data were collected, including age at diagnosis, race, marital status, sex, number of LNs examined, histologic grade, primary tumour site, laterality, VPI status, tumour size, N stage, therapeutic method [including post-operative radiotherapy (PORT), type of surgery and chemotherapy], survival months and vital status. TNM staging was based on the criteria described in the eighth edition of the American Joint Committee on Cancer Staging Manual.
Statistical analysis
Patients were classified into two cohorts, VPI and non-VPI groups, based on the presence or absence of VPI. Categorical variables were described as frequencies (percentages). A Chi-square test or Fisher’s exact test was used to assess differences in variables between the two cohorts. PSM analysis was employed using 1:1 nearest-neighbour matching with a calliper of 0.03 to balance the effect of potential confounders in characteristics between groups (24). A logistic regression model including age, race, marital status, sex, number of LNs examined, histologic grade, primary tumour site, laterality, tumour size, N stage, PORT, surgery and chemotherapy was used to calculate the propensity scores for matches (25).
Overall survival (OS), defined as the survival time from lung cancer diagnosis to death from any cause, was the primary outcome variable. Kaplan-Meier curves and the log-rank test were completed to evaluate unadjusted OS between groups. Cox proportional hazards models were used to identify the factors associated with OS. P < 0.05 was considered statistically significant. Analyses were performed using SPSS version 26 (IBM Corp, Armonk, NY), GraphPad Prism 8.0.2 (GraphPad Prism Inc. La Jolla, CA) and R version 3.5.0 (https://www.r-project.org).
Results
Baseline characteristics
In all, 1416 patients were included according to the eligibility criteria; of these, 372 (26.27%) presented with VPI. The baseline characteristics are listed in Table 1. The median follow-up duration was 41 months. During the follow-up period, 424 patients died. The median OS of the whole cohort was 34 months; the 1-, 3- and 5-year OS were 82.85, 48.41 and 32.38%, respectively.
Baseline characteristics before and after PSM, n (%)
| Variables | Before PSM | After PSM | |||||
|---|---|---|---|---|---|---|---|
| Total | Non-VPI N = 1044 | VPI N = 372 | P | Non-VPI N = 339 | VPI N = 339 | P | |
| Age (years) | 0.090 | 0.864 | |||||
| <65 | 418 (29.52) | 321 (30.75) | 97 (26.08) | 93 (27.43) | 95 (28.02) | ||
| ≥65 | 998 (70.48) | 723 (69.25) | 275 (73.92) | 246 (72.57) | 244 (71.98) | ||
| Sex | 0.577 | 0.758 | |||||
| Female | 660 (46.61) | 482 (46.17) | 178 (47.85) | 154 (45.43) | 158 (46.61) | ||
| Male | 756 (53.39) | 562 (53.83) | 194 (52.15) | 185 (54.57) | 181 (53.39) | ||
| Race | 0.034 | 0.533 | |||||
| White | 1216 (85.88) | 883 (84.58) | 333 (89.52) | 296 (87.32) | 300 (88.50) | ||
| Black | 121 (8.55) | 94 (9.00) | 27 (7.26) | 34 (10.03) | 27 (7.96) | ||
| Others | 79 (5.58) | 67 (6.42) | 12 (3.23) | 9 (2.65) | 12 (3.54) | ||
| Marital status | 0.042 | 0.983 | |||||
| Married | 799 (56.43) | 601 (57.57) | 198 (53.23) | 179 (52.80) | 184 (54.28) | ||
| Single | 165 (11.65) | 129 (12.36) | 36 (9.68) | 36 (10.62) | 34 (10.03) | ||
| Separated | 401 (28.32) | 282 (27.01) | 119 (31.99) | 112 (33.04) | 109 (32.15) | ||
| Unknown | 51 (3.60) | 32 (3.07) | 19 (5.11) | 12 (3.54) | 12 (3.54) | ||
| Laterality | 0.554 | 0.588 | |||||
| Left | 602 (42.51) | 439 (42.05) | 163 (43.82) | 146 (43.07) | 153 (45.13) | ||
| Right | 814 (57.49) | 605 (57.95) | 209 (56.18) | 193 (56.93) | 186 (54.87) | ||
| Location | <0.001 | 0.473 | |||||
| Main bronchus | 30 (2.12) | 26 (2.49) | 4 (1.08) | 3 (0.88) | 4 (1.18) | ||
| Upper lobe, lung | 783 (55.30) | 583 (55.84) | 200 (53.76) | 206 (60.77) | 189 (55.75) | ||
| Middle lobe, lung | 54 (3.81) | 26 (2.49) | 28 (7.53) | 15 (4.42) | 17 (5.01) | ||
| Lower lobe, lung | 415 (29.31) | 298 (28.54) | 117 (31.45) | 98 (28.91) | 107 (31.56) | ||
| Overlapping lesion of lung | 23 (1.62) | 17 (1.63) | 6 (1.61) | 8 (2.36) | 5 (1.47) | ||
| Lung, NOS | 111 (7.84) | 94 (9.00) | 17 (4.57) | 9 (2.65) | 17 (5.01) | ||
| Grade | <0.001 | 0.406 | |||||
| I/II | 187 (13.21) | 158 (15.13) | 29 (7.80) | 33 (9.73) | 29 (8.55) | ||
| III | 360 (25.42) | 254 (24.33) | 106 (28.49) | 100 (29.50) | 97 (28.61) | ||
| IV | 246 (17.37) | 154 (14.75) | 92 (24.73) | 86 (25.37) | 73 (21.53) | ||
| Unknown | 623 (44.00) | 478 (45.79) | 145 (38.98) | 120 (35.40) | 140 (41.30) | ||
| Number of nodes involved | 0.016 | 0.346 | |||||
| ≤9 | 831 (58.69) | 593 (56.80) | 238 (63.98) | 198 (58.41) | 210 (61.95) | ||
| ≥10 | 585 (41.31) | 451 (43.20) | 134 (36.02) | 141 (41.59) | 129 (38.05) | ||
| Tumour size | 0.001 | 0.345 | |||||
| 0 ~ 3.0 cm | 1034 (73.02) | 788 (75.48) | 246 (66.13) | 241 (71.09) | 232 (68.44) | ||
| 3.1–5.0 cm | 277 (19.56) | 179 (17.15) | 98 (26.34) | 68 (20.06) | 85 (25.07) | ||
| 5.1–7.0 cm | 64 (4.52) | 49 (4.69) | 15 (4.03) | 17 (5.01) | 13 (3.83) | ||
| >7 cm | 41 (2.90) | 28 (2.68) | 13 (3.49) | 13 (3.83) | 9 (2.65) | ||
| Nodal stage | <0.001 | 0.879 | |||||
| N0 | 1109 (78.32) | 853 (81.70) | 256 (68.82) | 237 (69.91) | 243 (71.68) | ||
| N1 | 175 (12.36) | 112 (10.73) | 63 (16.94) | 54 (15.93) | 51 (15.04) | ||
| N2 | 132 (9.32) | 79 (7.57) | 53 (14.25) | 48 (14.16) | 45 (13.27) | ||
| Surgery | 0.012 | 0.952 | |||||
| Sublobar resection | 394 (27.82) | 270 (25.86) | 124 (33.33) | 110 (32.45) | 108 (31.86) | ||
| Lobectomy | 980 (69.21) | 739 (70.79) | 241 (64.78) | 223 (65.78) | 224 (66.08) | ||
| Pneumonectomy | 42 (2.97) | 35 (3.35) | 7 (1.88) | 6 (1.77) | 7 (2.06) | ||
| PORT | <0.001 | 1.000 | |||||
| No | 1159 (81.85) | 883 (84.58) | 276 (74.19) | 256 (75.52) | 256 (75.52) | ||
| Yes | 257 (18.15) | 161 (15.42) | 96 (25.81) | 83 (24.48) | 83 (24.48) | ||
| Adjuvant chemotherapy | <0.001 | 0.758 | |||||
| No | 824 (58.19) | 656 (62.84) | 168 (45.16) | 165 (48.67) | 161 (47.49) | ||
| Yes | 592 (41.81) | 388 (37.16) | 204 (54.84) | 174 (51.33) | 178 (52.51) | ||
PSM, propensity score matching; VPI, visceral pleural invasion; NOS, not otherwise specified; PORT, post-operative radiotherapy.
Significant differences in race distribution (P = 0.034), marital status (P = 0.042), primary tumour site (P < 0.001), histologic grade (P < 0.001), the number of LNs examined (P = 0.016), tumour size (P = 0.001), N stage (P < 0.001) and treatment modality were noted between the VPI and non-VPI groups. Specifically, patients with VPI were more likely to have larger tumours and more advanced N stages and more likely to receive chemotherapy, sublobar resection and PORT. Thus, we conducted PSM, and 678 patients were included in the final analysis with 339 pairs stratified by VPI status. In the final analysis, all candidate variables were well balanced between the groups.
Survival analysis
The Kaplan-Meier curve showed that patients with VPI had worse OS both before and after PSM [before PSM: 5-year OS = 23.48 versus 38.33%; hazard ratio (HR) = 1.65, 95% confidence interval (CI): 1.36–2.00; P < 0.001; Fig. 2A; after PSM: 5-year OS = 23.67 vs. 34.84%; HR = 1.45, 95% CI: 1.13–1.86; P = 0.004; Fig. 2B]. In a multivariate analysis of all populations, after adjusting for sex, age, the number of LNs examined, histologic grade, tumour size, nodal stage, adjuvant chemotherapy and the type of surgery, VPI confers a significant disadvantage to OS (HR = 1.44; 95% CI: 1.17–1.76; P < 0.001) (Table 2). We also analysed the prognostic impact of VPI in patients with or without adjuvant chemotherapy. Multivariate analysis indicated that VPI was also an independent factor indicating poor prognoses in patients with or without adjuvant chemotherapy (Supplementary Table 1).
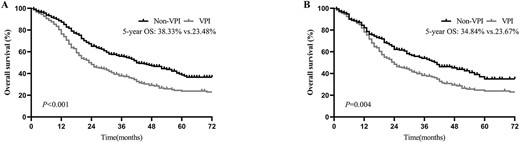
Overall survival (OS) of patients with and without visceral pleural invasion (VPI), (A) before and (B) after propensity score matching (PSM).
Univariable and multivariable analysis for OS in the whole cohort
| Variables | Univariable | Multivariable | ||
|---|---|---|---|---|
| HR (95% CI) | P | HR (95% CI) | P | |
| Age (years) | ||||
| <65 | Reference | Reference | ||
| ≥65 | 1.66 (1.33–2.07) | <0.001 | 1.67 (1.34–2.09) | <0.001 |
| Sex | ||||
| Female | Reference | Reference | ||
| Male | 1.52 (1.25–1.84) | <0.001 | 1.45 (1.20–1.76) | <0.001 |
| Race | ||||
| White | Reference | |||
| Black | 0.71 (0.45–1.11) | 0.132 | ||
| Others | 0.79 (0.42–1.49) | 0.470 | ||
| Marital status | ||||
| Married | Reference | |||
| Single | 1.02 (0.72–1.44) | 0.916 | ||
| Separated | 1.00 (0.81–1.24) | 0.990 | ||
| Unknown | 0.98 (0.59–1.64) | 0.944 | ||
| Laterality | ||||
| Left | Reference | |||
| Right | 1.00 (0.82–1.21) | 0.981 | ||
| Location | ||||
| Main bronchus | Reference | |||
| Upper lobe, lung | 0.96 (0.31–3.00) | 0.943 | ||
| Middle lobe, lung | 0.68 (0.20–2.27) | 0.532 | ||
| Lower lobe, lung | 0.99 (0.31–3.11) | 0.982 | ||
| Overlapping lesion of lung | 1.55 (0.37–6.48) | 0.551 | ||
| Lung, NOS | 0.73 (0.20–2.71) | 0.642 | ||
| Grade | ||||
| I/II | Reference | Reference | ||
| III | 1.67 (1.04–2.67) | 0.033 | 1.69 (1.05–2.72) | 0.031 |
| IV | 1.78 (1.11–2.86) | 0.017 | 1.90 (1.18–3.08) | 0.009 |
| Unknown | 1.59 (0.99–2.55) | 0.054 | 1.77 (1.10–2.85) | 0.020 |
| No. of nodes involved | ||||
| ≤9 | Reference | Reference | ||
| ≥10 | 0.77 (0.63–0.95) | 0.014 | 0.82 (0.65–1.04) | 0.101 |
| Tumour size | ||||
| 0~3.0 cm | Reference | Reference | ||
| 3.1–5.0 cm | 1.30 (1.03–1.63) | 0.027 | 1.38 (1.08–1.76) | 0.009 |
| 5.1–7.0 cm | 1.28 (0.78–2.08) | 0.326 | 1.67 (1.01–2.75) | 0.044 |
| >7 cm | 1.55 (0.85–2.83) | 0.155 | 1.61 (0.87–2.99) | 0.130 |
| Nodal stage | ||||
| N0 | Reference | Reference | ||
| N1 | 1.91 (1.50–2.42) | <0.001 | 2.38 (1.84–3.09) | <0.001 |
| N2 | 2.08 (1.61–2.67) | <0.001 | 2.25 (1.73–2.93) | <0.001 |
| Surgery | ||||
| Sublobar resection | Reference | Reference | ||
| Lobectomy | 0.65 (0.53–0.79) | <0.001 | 0.61 (0.48–0.76) | <0.001 |
| Pneumonectomy | 0.83 (0.49–1.41) | 0.490 | 0.72 (0.40–1.28) | 0.263 |
| PORT | ||||
| No | Reference | |||
| Yes | 0.98 (0.80–1.21) | 0.879 | ||
| Adjuvant chemotherapy | ||||
| No | Reference | Reference | ||
| Yes | 0.84 (0.68–1.02) | 0.080 | 0.59 (0.48–0.74) | <0.001 |
| VPI status | ||||
| Non-VPI | Reference | Reference | ||
| VPI | 1.65 (1.36–2.00) | <0.001 | 1.44 (1.17–1.76) | <0.001 |
OS, overall survival; HR, hazard ratio; CI, confidence interval.
Subgroup analysis by N stage and tumour size
In the subgroup analysis by N stage, before PSM, the 5-year OS for pathologic N0 (pN0) was 30.92% in the VPI group and 44.36% in the non-VPI group (P < 0.001; Fig. 3A). For pathologic N1 disease, the 5-year OS of the VPI and non-VPI groups were 10.12 and 14.76%, respectively (P = 0.261; Fig. 3B). For pathologic N2 disease, 5-year OS of 12.77 and 28.44% were found for the VPI and non-VPI groups, respectively (P = 0.193; Fig. 3C). Similar survival results were obtained after PSM: patients with VPI had significantly decreased OS but only in the N0 disease (5-year OS = 28.91 vs. 43.32%; P = 0.003; Fig. 4A) and not in the N1 (5-year OS = 13.73 vs. 11.96%; P = 0.774; Fig. 4B) or N2 (5-year OS = 12.22% vs. 25.51%; P = 0.248; Fig. 4C) disease.
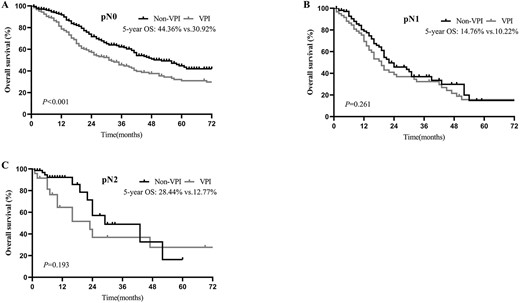
OS of patients with and without VPI, in pathologic N0 (pN0) (A), pathologic N1 (pN1) (B) and pathologic N2 (pN2) (C) disease before PSM.
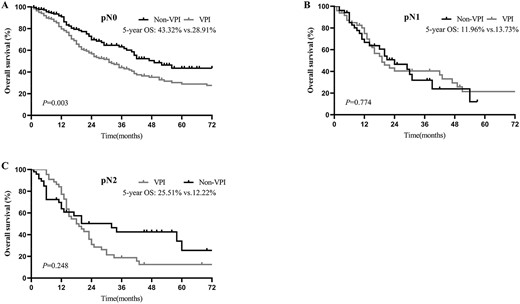
OS of patients with and without VPI in pN0 (A), pN1 (B) and pN2 (C) disease after PSM.
To further investigate the connection between VPI and tumour size in patients, we stratified the patients according to tumour size and VPI status in the N0 disease. For tumours ≤3 cm, patients without VPI had significantly more favourable OS than those with VPI (5-year OS = 43.69 vs. 27.37%, P = 0.011; Fig. 5A). However, OS was slightly but not significantly better in patients with tumours >3 cm without VPI than in those with VPI (5-year OS = 42.63 vs. 30.73%, P = 0.096; Fig. 5B).
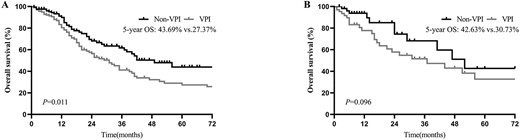
OS of patients with and without VPI in ≤3 cm (A) and >3 cm (B) tumours in pN0 disease after PSM.
Multivariable analysis for VPI and non-VPI groups
The univariate analysis of relevant variables affecting OS in the VPI and non-VPI groups is shown in Table 3. Multivariable analysis indicated that younger age at diagnosis, being female, lower N stage, resection with lobectomy and adjuvant chemotherapy were associated with improved OS in the VPI group. Similarly, younger age at diagnosis, being female, lower histologic grade and N stage and resection with a lobectomy were identified as potential predictors of better OS in the non-VPI group. Adjuvant chemotherapy was a potential predictor of better OS, but this was not supported by statistical significance (Table 4).
Univariable analysis for OS in the VPI and non-VPI group
| Characteristics | Non-VPI | VPI | ||
|---|---|---|---|---|
| HR (95% CI) | P | HR (95% CI) | P | |
| Age (years) | ||||
| <65 | Reference | Reference | ||
| ≥65 | 1.83 (1.36–2.48) | <0.001 | 1.45 (1.20–1.76) | <0.001 |
| Sex | ||||
| Female | Reference | Reference | ||
| Male | 1.46 (1.12–1.89) | 0.005 | 1.57 (1.18–2.08) | 0.002 |
| Race | ||||
| White | Reference | Reference | ||
| Black | 0.68 (0.38–1.22) | 0.201 | 0.81 (0.40–1.66) | 0.572 |
| Others | 0.67 (0.28–1.64) | 0.383 | 1.05 (0.43–2.57) | 0.910 |
| Marital status | ||||
| Married | Reference | Reference | ||
| Single | 0.96 (0.61–1.51) | 0.865 | 1.17 (0.68–2.02) | 0.564 |
| Separated | 0.88 (0.65–1.19) | 0.399 | 1.12 (0.83–1.52) | 0.459 |
| Unknown | 0.80 (0.29–2.15) | 0.652 | 0.94 (0.52–1.72) | 0.849 |
| Laterality | ||||
| Left | Reference | Reference | ||
| Right | 0.96 (0.74–1.25) | 0.753 | 1.07 (0.81–1.42) | 0.623 |
| Location | ||||
| Main bronchus | Reference | Reference | ||
| Upper lobe, lung | 0.79 (0.19–3.24) | 0.748 | 1.36 (0.19–9.75) | 0.761 |
| Middle lobe, lung | 0.59 (0.12–2.80) | 0.505 | 0.80 (0.11–6.08) | 0.833 |
| Lower lobe, lung | 0.75 (0.18–3.11) | 0.696 | 1.51 (0.21–10.87) | 0.685 |
| Overlapping lesion of lung | 0.35 (0.03–3.87) | 0.391 | 15.24 (1.67–139.36) | 0.016 |
| Lung, NOS | 0.82 (0.18–3.79) | 0.797 | NA | NA |
| Grade | ||||
| I/II | Reference | Reference | ||
| III | 2.16 (1.17–3.98) | 0.013 | 0.85 (0.40–1.78) | 0.667 |
| IV | 2.17 (1.17–4.01) | 0.014 | 0.97 (0.47–2.04) | 0.946 |
| Unknown | 1.54 (0.83–2.86) | 0.171 | 1.15 (0.55–2.39) | 0.714 |
| No. of nodes involved | ||||
| ≤9 | Reference | Reference | ||
| ≥10 | 0.84 (0.64–1.11) | 0.217 | 0.74 (0.54–1.02) | 0.067 |
| Tumour size | ||||
| 0 ~ 3.0 cm | Reference | Reference | ||
| 3.1–5.0 cm | 1.26 (0.89–1.77) | 0.189 | 1.17 (0.85–1.61) | 0.327 |
| 5.1–7.0 cm | 1.28 (0.67–2.42) | 0.452 | 1.36 (0.63–2.90) | 0.434 |
| >7 cm | 1.18 (0.38–3.71) | 0.775 | 1.45 (0.71–2.97) | 0.307 |
| Nodal stage | ||||
| N0 | Reference | Reference | ||
| N1 | 2.10 (1.51–2.91) | <0.001 | 1.58 (1.11–2.24) | 0.011 |
| N2 | 1.96 (1.35–2.84) | 0.000 | 1.87 (1.32–2.66) | <0.001 |
| Surgery | ||||
| Sublobar resection | Reference | Reference | ||
| Lobectomy | 0.79 (0.59–1.05) | 0.104 | 0.57 (0.43–0.76) | <0.001 |
| Pneumonectomy | 0.84 (0.42–1.69) | 0.630 | 1.36 (0.59–3.13) | 0.468 |
| PORT | ||||
| No | Reference | Reference | ||
| Yes | 1.05 (0.78–1.40) | 0.745 | 0.86 (0.64–1.16) | 0.317 |
| Adjuvant chemotherapy | ||||
| No | Reference | Reference | ||
| Yes | 1.04 (0.79–1.38) | 0.768 | 0.62 (0.46–0.82) | 0.001 |
NA, not available.
Multivariable analysis of clinicopathological factors affecting OS in the VPI and Non-VPI group
| Variables | Non-VPI | VPI | ||
| HR (95% CI) | P | HR (95% CI) | P | |
| Age (years) | ||||
| <65 | Reference | Reference | ||
| ≥65 | 1.94 (1.43–2.64) | <0.001 | 1.43 (1.18–1.74) | <0.001 |
| Sex | ||||
| Female | Reference | Reference | ||
| Male | 1.50 (1.15–1.96) | 0.003 | 1.43 (1.06–1.91) | 0.017 |
| Grade | ||||
| I/II | Reference | Reference | ||
| III | 2.23 (1.21–4.14) | 0.011 | 0.96 (0.45–2.04) | 0.909 |
| IV | 2.27 (1.21–4.25) | 0.011 | 1.20 (0.56–2.55) | 0.643 |
| Unknown | 1.76 (0.94–3.30) | 0.075 | 1.39 (0.66–2.93) | 0.391 |
| No. of nodes involved | ||||
| ≤9 | Reference | Reference | ||
| ≥10 | 0.87 (0.64–1.18) | 0.380 | 0.82 (0.57–1.20) | 0.311 |
| Tumour size | ||||
| 0 ~ 3.0 cm | Reference | Reference | ||
| 3.1–5.0 cm | 1.51 (1.05–2.17) | 0.028 | 1.33 (0.95–1.85) | 0.093 |
| 5.1–7.0 cm | 1.71 (0.89–3.29) | 0.109 | 1.75 (0.80–3.82) | 0.159 |
| >7 cm | 1.14 (0.36–3.67) | 0.820 | 2.16 (1.02–4.56) | 0.044 |
| Nodal stage | ||||
| N0 | Reference | Reference | ||
| N1 | 2.76 (1.90–4.00) | <0.001 | 2.06 (1.40–3.01) | <0.001 |
| N2 | 2.06 (1.39–3.04) | <0.001 | 2.05 (1.41–2.98) | <0.001 |
| Surgery | ||||
| Sublobar resection | Reference | Reference | ||
| Lobectomy | 0.60 (0.44–0.83) | 0.002 | 0.51 (0.38–0.70) | <0.001 |
| Pneumonectomy | 0.48 (0.23–1.01) | 0.052 | 1.02 (0.43–2.42) | 0.968 |
| PORT | ||||
| No | Reference | Reference | ||
| Yes | 0.83 (0.59–1.17) | 0.290 | 0.79 (0.55–1.14) | 0.216 |
| Adjuvant chemotherapy | ||||
| No | Reference | Reference | ||
| Yes | 0.76 (0.56–1.03) | 0.078 | 0.46 (0.34–0.63) | <0.001 |
Use of adjuvant chemotherapy for VPI and non-VPI groups
To further understand the role of adjuvant chemotherapy in SCLC patients with tumours ≤3 cm and pN0, we conducted additional survival analyses. The Kaplan-Meier curve showed that adjuvant chemotherapy improved the prognoses of patients with tumours ≤3 cm, pN0 and VPI (3-year OS = 49.57% vs. 33.43%; P = 0.016; Fig. 6A) but not in patients with tumours ≤3 cm, pN0 and non-VPI (3-year OS = 63.96 vs. 57.62%; P = 0.775; Fig. 6B).
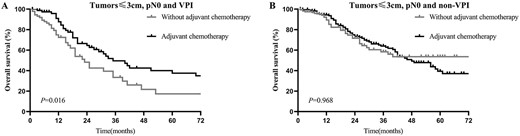
OS of patients with and without adjuvant chemotherapy in the VPI group (A) and non-VPI group (B) in patients with tumours ≤3 cm, pN0 disease.
Discussion
VPI accounts for ~11.5–46.6% of NSCLC (12,17,18,26) and is a poor prognosticator for NSCLC; it has been incorporated into the TNM staging system, accompanying tumour size. Based on these criteria, tumours ≤3 cm would be upstaged from T1 to more advanced tumours (T2; 3–5 cm) based on size alone if they invaded the visceral pleura. Conversely, VPI did not lead to upstaging for tumours >3 cm (23). Many studies have reported that VPI is a strong prognostic parameter. VPI was considered a poor prognostic parameter as early as 1958 by Brewer et al. (27). Yang et al. (20) reported that VPI was related to significantly worse lung cancer-specific survival in N0, but not in N1 or N2, patients. In addition, Fujimoto et al. (28) suggested that VPI was associated with both tumour recurrence and decreased long-term survival after surgery in N1 NSCLC patients. Hiroyuki Adachi et al. (12) showed that N0/N1 patients with VPI had significantly poorer OS after surgery, but no survival difference was observed in patients with N2 disease. Zhang et al. (21) showed that VPI is an adverse prognostic indicator in patients with N2 disease. However, the prognostic value of VPI in SCLC has been unclear.
In this study, we evaluated the prognosis value of VPI for OS and explored its potential relationship with node status. Before matching, significant differences in clinical characteristics were observed between patients with or without VPI, which could have affected the prognoses. After minimizing potential confounders using PSM, the results indicated that VPI significantly increased the risk of death in SCLC patients undergoing resection, leading to 1.44-fold increased mortality. Further subgroup analysis according to nodal status indicated significant differences in OS for patients with SCLC only for N0 patients but not N1 or N2 patients.
By analysing the prognostic effect of VPI concerning tumour size in patients with surgically resected pN0 SCLC, our study revealed that tumours ≤3 cm with VPI were significantly associated with lower OS than those without VPI, but no significant prognostic difference was observed in N0 patients who had tumours ≥3 cm with or without VPI. This result was consistent with previous studies. A study on 1653 patients who had undergone surgical resection for NSCLC showed that VPI was associated with the prognoses of patients with tumours ≤3 or >3 cm. Therefore, they suggested the stages of tumours ≤3 cm and tumours >3 cm with VPI be upgraded to T2 and T3, respectively (29). Similarly, Yoshida et al. (30) analysed 9758 patients who had received anatomical resections from a nationwide Japanese database, concluding that the T statuses of tumours ≤7 cm should be upstaged to the next T level if VPI was present. Wang et al. (19) retrospectively analysed 256 patients with radically resected adenosquamous carcinomas; they showed that VPI was an independent prognostic factor for survival, especially in patients with tumours ≤4 cm. Nitadori et al. (31) suggested that VPI significantly affected the risk of recurrence and OS in patients with tumours of 2–3 cm but not those with tumours <2 cm. Conversely, David et al. (32) found VPI was not associated with OS and disease-free survival in tumours ≤5 cm. The relationship between VPI and tumour size requires further exploration for SCLC.
At present, it remains unknown why VPI confers poor survival. Some studies showed that VPI was correlated with higher incidences of LN metastasis, pleural effusion and post-operative recurrence (18,33). Anatomically, the visceral pleura involves abundant lymphatic vessels that form an intercommunicating network arranged over the lung surface, passing through the lung parenchyma to join the bronchial lymph vessels that drain into various hilar LNs (13,14). This network may provide a pathway for systemic micrometastasis after invasion by primary cancer (28). Similarly, Shimizu et al. (17) suggested the existence of a VPI cancer cell pathway through the subpleural lymphatics and hilar LNs into the mediastinal LNs. Furthermore, the poor prognosis due to VPI was attributable to rapid pleural invasion followed by diffuse dissemination of malignant cells throughout the pleural cavity by pleural fluid (14,16). Once exfoliated in the pleural cavity, malignant cells were easily reabsorbed through parietal pleurae and diaphragmatic lymph drainage into the mediastinal LNs, resulting in the more frequent incidence of N2 disease. Consistent with the previous analysis, our results showed that the proportion of patients classified as N1/N2 increased according to VPI status: 31.18% (116 of 372) in the VPI group and 18.30% (191 of 1044) in the non-VPI group (P < 0.001). This also indicated that the presence of VPI was more likely to result in post-operative recurrence and a worse prognosis. In the present study, multivariable Cox analysis revealed that resection with lobectomy and adjuvant chemotherapy could significantly improve patient outcomes in the VPI groups. Therefore, when surgery is possible, lobectomy with a thorough systematic LN dissection is advised for patients with VPI. Adjuvant chemoradiotherapy is recommended to prevent local recurrence after surgical resection.
To our knowledge, this study is the first to explore the prognostic effect of VPI for post-operative survival of SCLC patients. Our results supported VPI as a prognostic factor for SCLC patients for future clinical applications, especially in those with N0 disease. In patients with VPI, SCLC seemed to be highly aggressive and closely associated with LN metastasis and a high risk of recurrence and poor prognosis. Furthermore, multivariable analysis indicated that adjuvant chemotherapy could significantly increase survival among patients with VPI. As per the current NCCN guideline, surgical resection is only allowed for stages I–IIA SCLC, followed by adjuvant chemotherapy with or without PORT. However, only 54.84% patients with VPI received adjuvant chemotherapy, implying that physicians had a general lack awareness about post-operative management of these patients. Therefore, we suggested that SCLC patients with VPI be considered for more aggressive post-operative treatments (such as intensive adjuvant chemotherapy) and post-operative follow-ups to improve their survival. In addition, our study found that adjuvant chemotherapy did not increase survival among patients without VPI with any statistical significance. In clinical practice, adjuvant chemotherapy usually has toxic side effects. Older adults and patients with poor performance status or co-morbidities cannot always tolerate adjuvant chemotherapy. Therefore, doctors may consider interrupting adjuvant chemotherapy in such non-VPI patients. Although validated biomarkers may be found in the future, VPI can assist doctors in the identification of risk factors for recurrence and help patients and their families formulate long-term therapeutic regimens and follow-up plans.
This study had some limitations. First, the selection bias in retrospective studies is inevitable. Despite the use of PSM, unadjusted confounding variables remain. Smoking history, cardiopulmonary function, co-morbidities, complications, gene mutations, surgical resection status and adjuvant therapeutic agents or doses were not available. Second, the SEER database does not provide detailed therapeutic information in terms of radiotherapy, targeted therapy and immunotherapy records. Third, information about recurrence and metastasis was not available, and progression-free survival could not be calculated. Fourth, patients who underwent preoperative chemotherapy should be excluded because preoperative chemotherapy may affect the pathological assessment of VPI. However, the SEER database fails to provide detailed information about preoperative chemotherapy for SCLC, which may have resulted in bias. Fifth, the design of the multivariable analysis was poor because the SEER database lacks many confounding variables, including smoking history, cardiopulmonary function, co-morbidities and complications. Furthermore, in clinical practice, patients who did not receive adjuvant chemotherapy usually exhibit worse general conditions than those who received it. It is reasonable that patients who received adjuvant chemotherapy showed better prognoses than those who did not receive it. Therefore, whether adjuvant chemotherapy improves the prognoses of SCLC patients with VPI must be interpreted very cautiously because there are many biases in the analysis. Overall, despite these limitations, a relatively large sample size and use of the PSM method may have reduced biases to a certain degree in our study.
In conclusion, VPI had an adverse effect on OS in SCLC patients, especially in those with N0 disease. Early tumours of ≤3 cm with VPI were associated with significantly worse prognoses, but there were no significant differences in survival for N0 patients with tumours >3.0 cm with and without VPI. Patients of younger ages at diagnosis, females, lower N stage, resection with a lobectomy and adjuvant chemotherapy were associated with increased OS in the VPI group. Patients with VPI should be advised to pursue more aggressive post-operative management. The predictive value of VPI should be confirmed in clinical trials.
Acknowledgements
The authors thank investigators and institutions involved in these studies and all patients whose data comprised the SEER Database.
Funding
None.
Conflict of interest statement
None declared.
Data availability statement
Publicly available datasets were analysed in this study. These data can be found here: SEER database (https://seer.cancer.gov/).
