


Abstract
The duration for which the indigo-reducing state maintenance in indigo natural fermentation in batch dependent. The microbiota was analyzed in two batches of sukumo fermentation fluids that lasted for different durations (Batch 1: less than 2 months; Batch 2: nearly 1 year) to understand the mechanisms underlying the sustainability and deterioration of this natural fermentation process. The transformation of the microbiota suggested that the deterioration of the fermentation fluid is associated with the relative abundance of Alcaligenaceae. Principal coordinates analysis (PCoA) showed that the microbial community maintained a very stable state in only the long-term Batch 2. Therefore, entry of the microbiota into a stable state under alkaline anaerobic condition is an important factor for maintenance of indigo fermentation for long duration. This is the first report on the total transformation of the microbiota for investigation of long-term maintenance mechanisms and to address the problem of deterioration in indigo fermentation.
Electronic supplementary material
The online version of this article (10.1007/s10295-019-02223-0) contains supplementary material, which is available to authorized users.
Introduction
Indigo is one of the oldest dyes used by humans. Before synthetic dyes were developed in the nineteenth century, indigo was traditionally derived from various blue dye plants, including woad (Isatis tinctoria), native to Europe and southeastern Russia; knotweed (Polygonum tinctorium), used in China, Korea, and Japan; and Indigofera (Indigofera tinctoria and Indigofera suffruticosa), used in India [1, 3, 39]. Plant leaf processing methods for dyeing have been developed in different regions, such as woad balls in Europe, niram in Korea and sukumo in Japan. However, precipitated indigo extracted from plants has been used in India, China and Southeast Asia [6, 24].
Indigo itself does not exist in the leaves of indigo-producing plants. The original state of indigo dye is always indican (indoxyl-β-D-glucoside) [32]. Therefore, transformation of indican to indigo is necessary for the production of indigo dye. The most popular method is the extraction of indigo dye by short-term fermentation. Fresh leaves are soaked in a large vat for 2–3 days until soft. Then, lime hydrate (Ca(OH)2) is added to the liquid, and the mixture is thoroughly stirred. The indigo then precipitates and accumulates at the bottom of the vat. Alternatively, indigo-containing plants are decomposed by microorganisms, as performed for woad in Europe and sukumo in Tokushima Prefecture, Japan [1, 30].
In Tokushima Prefecture, the leaves of knotweed plants are harvested and air-dried, and then, approximately 3 tons of dried leaves are mixed with a roughly equivalent weight of water and piled to approximately 1 m in height. Microbial oxidative fermentation of the leaves is promoted under aerobic conditions and at an appropriate temperature by controlling the water content and adjusting the turnover frequency through the skillful techniques of a trained craftsman [1]. The temperature reaches 60 °C because of microbial activity, and the mixture becomes alkaline. This microbial oxidation step is carried out for up to 100 days, and the brown composted product is called sukumo. During this process, the precursor is broken down to indoxyl and sugar moieties by plant enzymes, and free indoxyl has been suggested to form indigo via indoxyl radicals, which first form leuco-indigo and are then oxidized to indigo [34].
Due to its insolubility in water, indigo in sukumo needs to be reduced to the water-soluble form (leuco-indigo) before dyeing. The reduced form can be easily absorbed into fibers, and when exposed to the air, the soluble leuco-indigo is oxidized back to the insoluble indigo and stays within the fibers. Traditional sukumo reduction is implemented by fermentation under extreme alkalinity (pH 10.3–11.0) [30]. Sukumo is mixed with hot wood ash extract; the fluid is stirred once or twice daily; and wheat bran or wheat gluten is added as a substrate for the indigo-reducing microbes when the dyeing efficiency decreases. In this step, oxidized indigo is solubilized via bacterial reduction. Generally, the required dyeing efficiency can be maintained for approximately 6 months on average by skilled artisans [30].
Since the late nineteenth century, natural indigo has been replaced over a relatively short period by synthetic dyes, and in parallel, the use of chemical reductants, such as hydrosulfite (Na2S2O4), has been established in the industry for modern vat-based dyeing with indigo. Fermentation vats continue to be used on a small scale and even in domestic dyeing processes across Europe, Africa, Asia and America [10]. In addition to maintaining the cultural heritage, traditional techniques for indigo fermentation have significant advantages in terms of recyclability and human health and environmental safety [4, 27, 31].
In the past decade, attempts have been made to develop and optimize environmentally friendly alternatives for the formation and reduction of indigo. To elucidate the mechanism underlying indigo fermentation, many indigo-reducing bacterial species have been isolated from various types of indigo fermentation fluids. In the genus Alkalibacterium, there are ten named species, three of which are indigo-reducing bacteria: Alkalibacterium iburiense [28], Alkalibacterium psychrotolerans [41], and Alkalibacterium indicireducens [42]. There are ten named species within the genus Amphibacillus, and two of these species are indigo-reducing bacteria: Amphibacillus indicireducens [12] and Amphibacillus iburiensis [13]. In addition, some other species belonging to the class Bacilli, such as Oceanobacillus indicireducens [11], Fermentibacillus polygoni [14], Polygonibacillus indicireducens [17], Paralkalibacillus indicireducens [15], and Bacillus fermenti [16], have been shown to be indigo-reducing bacteria in recent years.
In addition, Okamoto et al. [30] explored the microbiota in aged fermented fluids with culture-dependent and clone library-based methods. They found that the microbiota mainly consists of the genera Alkalibacterium, Amphibacillus, Anaerobacillus and Polygonibacillus and the family Proteinivoraceae. Aino et al. [2] investigated the bacterial community structure associated with indigo fermentation using denaturing gradient gel electrophoresis (DGGE) and clone library analyses of a PCR-amplified 16S rRNA gene and found a marked substitution of Halomonas spp. by Amphibacillus spp., corresponding to a marked change in the state of indigo reduction. Alkalibacterium spp. were not predominant in the early phase of fermentation but were abundant in aged fluid (10 months) obtained from Date City, Japan. Milanović et al. [27] explored the microbiota of woad vat fermentation fluid aged 12 months with PCR-DGGE and pyrosequencing, and found that eumycetes and coliforms were present at levels below the detection limit in viable counts by the growth media; whereas, total mesophilic aerobes and spore-forming bacteria and their spores were detected at great at high levels. Both facultative and obligate anaerobes were present in the woad vat and were involved in the formation, reduction, and degradation of indigo. They inferred that indigo-reducing bacteria constitute only a small fraction of the microcosm.
During long periods of fermentation, there are many chances of contamination by environmental microorganisms. Subtle changes in nutrients, pH, and agitation can affect the state of reduction. Therefore, the maintenance time differs greatly among fermentation broths, and the differences and trends for microbial communities remain unknown. To investigate factors associated with defining the timing of the reducing state of fermentation fluid and the changes in bacterial dynamics during the whole fermentation process, we used two batches of sukumo fermentation broth. The reduction of one of the broths lasted for only approximately 7 weeks, and that of other lasted for nearly 1 year. Next-generation sequencing (NGS) was used to monitor the total transformation of bacteria during the whole fermentation process of Japanese sukumo.
Materials and methods
Indigo fermentation samples
Two batches of sukumo fermentation fluids were used: Batch 1 was fermented for approximately 7 weeks (51 days), and Batch 2 was fermented for nearly 1 year (345 days). Batch 1 contained 380 g of sukumo (produced in Tokushima Prefecture, Japan) and the same weight of wood ash (fine powder of burnt charcoal made from Quercus phillyraeoides) in 5 L of water. The wood ash was first added to 5 L of water and boiled by simmering on a stove for 10 min. When the liquid cooled to 60 °C at room temperature, the sukumo was added and mixed well, and then, the fluid was placed at 26 °C in a thermostatic room protected from light. On the next day, the fluid was heated again to 60 °C with constant stirring and then returned to the thermostatic room. Batch 2 was made from 532 g of sukumo (produced in Tokushima Prefecture, Japan) and 7 L of wood ash supernatant by heating to 70 °C, and then placed in the same thermostatic room. Batch 2 was also heated again to 60 °C on the next day and then maintained at 26 °C. During the subsequent long-term fermentation, the broths were stirred every day, and the pH of the fermentation fluid was maintained between 10.3 and 11 with Ca(OH)2 in addition to small amount of Na2CO3, NaOH and lactic acid for Batch 1 and with Ca(OH)2 and a small amount of K2CO3 for Batch 2. For precise adjustment of pH in preparation for the fermentation, NaOH, Na2CO3 and K2CO3 were used. On the other hand, for maintenance of pH during fermentation, Ca(OH)2 was used for the precipitation of acid. Lactic acid was used for reduction of pH. The oxidation–reduction potential (ORP) [23] was measured using a 9300-10D (Horiba, Kyoto, Japan) electrode.
According to the method used by traditional craftsmen, the reduction state was roughly evaluated by cotton cloth dyeing. In this method, a piece of white cotton cloth of approximately 2 cm × 3 cm is soaked in the fermentation fluid for 30 s and then removed and exposed to air for oxidation, and then, the impurities are washed away in flowing water. Reduced fermentation broth will stain the white cotton cloth blue. From Batch 1, samples fermented for 1 day, 7 days (1 week), 14 days (2 weeks), 21 days (3 weeks), 28 days (4 weeks), 35 days (5 weeks), 42 days (6 weeks), 49 days (7 weeks) and 51 days (7 weeks + 2 days) were examined. From Batch 2, samples fermented for 1 day, 9 days, 30 days (1 month), 135 days (4.5 months), 165 days (5.5 months), 240 days (8 months), and 345 days (11.5 months) were used for the subsequent analysis.
DNA extraction, PCR amplification, and PCR product purification
The obtained samples were centrifuged at 15,000×g for 10 min to obtain the sample pellet. Total bacterial DNA was directly extracted from the sample pellets using ISOIL (Nippon Gene, Tokyo, Japan) according to the manufacturer’s instructions: 950 μl of Lysis Solution HE and 50 μl of Lysis Solution 20S were added to the samples and, after mixing well by inversion, incubated at 65 °C for 1 h. The samples were then centrifuged (12,000×g, 1 min, room temperature). Then, 600 μl of each supernatant to a new tube, and 400 μl of Purification Solution was added, and mixed well. Then, 600 μl of chloroform was added, and each sample was vortexed for 15 s and then centrifuged (12,000×g, 15 min, room temperature). Then, 800 μl of the aqueous layer was transferred to a new tube while taking care not to transfer the intermediate layer; 800 μl of Precipitation Solution was added, and the samples were mixed well and then centrifuged (20,000×g, 15 min, 4 °C). The supernatant was discarded; 1 ml of Wash Solution was added and mixed by inverting a few times; and the mixture was then centrifuged (20,000×g, 10 min, 4 °C). The supernatant was discarded; 1 ml of 70% ethanol and 2 μl of Ethachinmate were added and the mixture was vortexed and then centrifuged (20,000×g, 5 min, 4 °C). The supernatant was discarded; the precipitates were air-dried and then dissolved in 50 μl of TE (pH 8.0).
The DNA extracts were purified with the QIAquick PCR Purification Kit (Qiagen) following the manufacturer’s instructions. The V4 region of the bacterial 16S rRNA genes was PCR-amplified using a composite pair of primers containing unique 35- or 34-base adapters, which were used to tag the PCR products from the corresponding samples. The forward primer was 515F (5′-GTGBCAGCMGCCGCGGTAA-3′) with an adaptor (GCTCGTCGGCAGCGTCAGATGTGTATAAGAGACAG) and 10 bp of sample-specific barcode, and the reverse primer was 805R (5′-GACTACHVGGGTATCTAATCC-3′) with an adaptor (GTCTCGTGGGCTCGGAGATGTGTATAAGAGACAG). The primer pair 515F-805R amplified approximately 290-bp fragments of the bacterial 16S rRNA genes. PCR was performed in a 100-μl solution containing 20 μl of 5 × Phusion HF buffer (Thermo), 2 ml of a 2.5-mM dNTP mixture (TaKaRa, Ohtsu, Japan), 25 ng of isolated DNA, 2 U of Phusion Hot Start II DNA polymerase (Thermo) and 50 pmol of each primer. The amplification reactions were performed as follows: initial thermal denaturation at 98 °C for 30 s, followed by 25 cycles of heat denaturation at 98 °C for 10 s, annealing at 55 °C for 20 s and extension at 72 °C for 30 s.
The fragment lengths of the PCR products were confirmed by agarose gel electrophoresis, and the products were then purified with the QIAquick PCR Purification Kit (Qiagen) following the manufacturer’s instructions. The purified PCR products with the expected bands were extracted after agarose gel electrophoresis with the Wizard SV Gel and PCR Clean-up System (Promega) following the manufacturer’s instructions.
Next-generation sequencing (NGS)
The extracted V4 region of the 1st PCR products was submitted to Hokkaido System Science Co., Ltd. (Sapporo, Hokkaido, Japan). A 2nd PCR was performed with an index-adapted primer to generate paired-end (2 × 301 base pair) libraries for Illumina shotgun sequencing, and the products were purified. NGS was carried out on the Illumina MiSeq platform (Illumina, San Diego, USA). The obtained raw reads were preprocessed with cutadapt version 1.1, Trimmomatic version 0.32 and fastq-join version 1.1.2-537. All failed sequence reads and low-quality, tag and primer sequences were removed. Clustering analysis based on operational taxonomic units (OTUs) with 97% identity and taxonomic classification annotated by each representative sequence were performed using QIIME software version 1.9.1 [5]. Taxonomic analysis and annotation of the output data were also carried out by QIIME software, which can perform OTU picking, taxonomic assignment, diversity analysis and graphical visualization [5, 33]. Nucleotide sequence identity analysis was also carried out with bacterial 16S rRNA reference sequences in the BLAST database [21].
The sequence data obtained in this study have been deposited in DDBJ under the accession number DRA007978.
Diversity analysis
Alpha diversity is usually used to represent species diversity in a sample. In this study, rarefaction curves were computed with sequences and observed species based on OTUs at a 97% similarity level with respect to the total number of reads for each sample. Observed species curves were obtained to show the trend in bacterial species detected in the samples. In addition to alpha diversity, beta diversity within all samples was computed in this study. Beta diversity analysis involves the explicit comparison of microbial communities based on composition. Beta diversity metrics, thus, assess the differences between microbial communities. PCoA based on Bray–Curtis distances was used to evaluate the similarity of the microbiota in every sample. Both rarefaction curves and PCoA were carried out with QIIME software version 1.9.1.
Results
Indigo-reducing fermentation
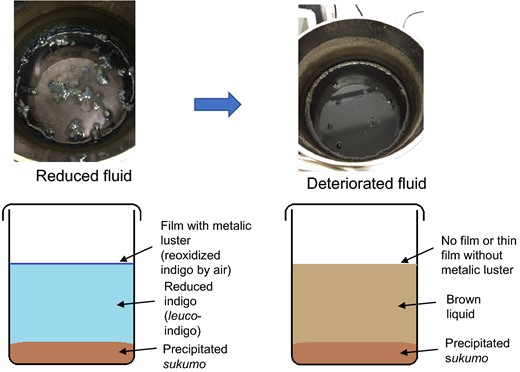
Change in appearance of indigo fermentation fluids from the reducing state to deterioration. Reducing fluid (soluble indigo) is characterized by the formation of a film with a metallic luster that is the result of indigo reoxidized upon exposure to air at the surface of the fluid (a). Deteriorated fluid is brown and lacks the film or has a thin film with no metallic luster (b)
![Relative abundance of the bacterial constituents of short-term [Batch 1 (a)] and long-term [Batch 2 (b)] batches. Batch 1 (a) was fermented from days 1 to 51, and the long-term Batch 2 (b) was fermented from days 1 to 345 (11.5 months) for indigo fermentation (26 °C). The corresponding staining intensity is described below. ++: very strong, +: strong, w: weak and −: no staining](https://oup.silverchair-cdn.com/oup/backfile/Content_public/Journal/jimb/46/12/10.1007_s10295-019-02223-0/3/m_10295_2019_2223_fig2_html.jpeg?Expires=1748151053&Signature=I3W~lDRfke4xyUB3qDlE2aLD1HUXyknT31pxrUFtfTqUkWI2VHtJBBNdicfjxmEWOpTIMRI5mNsXY3mPAKymUeIFcVQGJEGEBg5LXdh4yq1j9VON6MEGeTvMex40MOGULj612yxyJkjfvjLsfh5GvlAwglskTLZzOgMlIylSoWBzV0ZtmqvJ-HFHqUhaHkbhTrC3BYBUZOCchYMOBQxxO~pU3lBEPP8OLREtsG2ajL6mAXlmPs8nWbhizZnJi6aTD~XfClnKhlJIWgJIkiLWSrxDxlPShJld7NwCCdpSYPoGDmCuBz~YpEiomynNL2qJLwQr59BmY4DcoLiW~L1zOA__&Key-Pair-Id=APKAIE5G5CRDK6RD3PGA)
Relative abundance of the bacterial constituents of short-term [Batch 1 (a)] and long-term [Batch 2 (b)] batches. Batch 1 (a) was fermented from days 1 to 51, and the long-term Batch 2 (b) was fermented from days 1 to 345 (11.5 months) for indigo fermentation (26 °C). The corresponding staining intensity is described below. ++: very strong, +: strong, w: weak and −: no staining
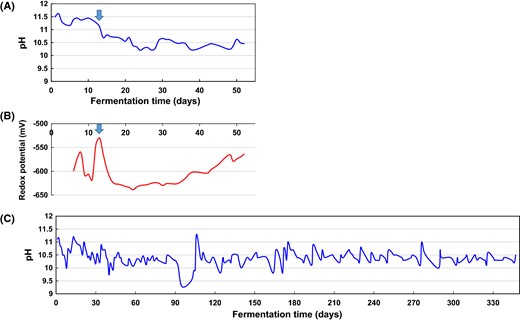
Fluctuation in abiotic parameters in indigo fermentation batches. Fluctuation in pH (a) and redox potential (b) in Batch 1 and pH (c) in Batch 2. The batches were stirred every day, and the pH of the fermentation fluid was maintained between 10.3 and 11 in Batch 1 with the addition of Na2CO3, NaOH, Ca(OH)2, and lactic acid and in Batch 2 with Ca(OH)2 and K2CO3
When the fermentation broth deteriorated, the film disappeared, and the liquid turned brown (Fig. 1). Batch 1 and Batch 2 exhibited deterioration on day 51 and month 11.5 (day 345), respectively. Although the basic preparation and maintenance procedures were the same for both batches, the characteristics of the fermentation fluids were different. This difference was because of the accumulation of inhomogeneity in the sukumo and the subtle differences in the temperature and pH of the wood ash extract at the initiation of fermentation, which was reflected in the differences in the microbiota on day 1 (Fig. 2). Furthermore, the subtle differences in maintenance procedures also induced differences in the characteristics of the fermentation fluid.
Whole bacterial community analysis by NGS
The whole community structure of the sukumo fermentation fluids was analyzed based on OTUs identified by NGS. NGS analysis indicated that the fluids contained a wealth of different bacterial species. The bacterial communities comprised a total of 22 phyla in Batch 1 and 24 phyla in Batch 2, including Archaea, which were detected in samples of Batch 1 from days 1, 7 and 51 and samples of Batch 2 from day 9, although the relative levels of Archaea were consistently less than 0.1%. The top three relative levels were exhibited by the phyla Proteobacteria, Firmicutes and Actinobacteria, which accounted for more than 90% of the phyla in every sample. In the beginning, the abundance of the phylum Firmicutes increased substantially in the middle and late stages of fermentation, the abundance of the phylum Proteobacteria increased substantially, and the abundance of the phylum Tenericutes (0.2–0.3%) also increased, especially in Batch 1 (data not shown).
At the genus level, 208 and 279 different genera were distinctly detected in Batch 1 and Batch 2, respectively. During the whole fermentation of the two batches, most of the significant bacterial populations were similar, and the batches also showed significant changes in the relative content of various genera or families (Fig. 2). The abundance of the genera Anaerobranca and Tissierella increased substantially in the beginning and decreased slightly thereafter. The family Alcaligenaceae was detected in small amounts, but the abundance increased greatly on day 21 in Batch 1 and on day 240 in Batch 2. There were also significant differences between the two batches. In the beginning, the abundance of the genus Prauseria decreased substantially in Batch 1, and the abundances of the families Rhodospirillaceae and Trueperaceae decreased substantially in Batch 2. The abundances of the genera Clostridium and Coprococcus increased from the middle period in Batch 1, while the abundances of genus Devosia and family Phyllobacteriaceae increased from the middle period in Batch 2, and the genera Acholeplasma and Azoarcus were detected in only deteriorated samples from Batch 2. In addition, the genus Caldicoprobacter had a relative abundance of 2.1% on day 28, which increased to 28.7% on day 35, and this genus was present at more than 20% after day 35 in Batch 1. Pseudomonas was present at 0% at week 2 but at 36.9% on day 21 in Batch 1, maintaining a relatively high level thereafter. However, Pseudomonas had a relative abundance of 16.9% in only the deteriorated sample and an abundance of 0% in the other samples of Batch 2.
Based on the reported indigo-reducing bacteria, the most likely indigo-reducing population includes Amphibacillus, Alkalibacterium and Oceanobacillus. Comparisons of sequences of Marinilactibacillus, which were identified by NGS and search against the BLAST database, showed that these sequences share 100% similarity with sequences of Amphibacillus spp. and Alkalibacterium spp. in the target 16S rRNA V4 region fragments. This result indicates that Marinilactibacillus may also contain indigo-reducing bacterial species. The relative abundance of Amphibacillus remained steady in both batches and the abundances of Alkalibacterium and Marinilactibacillus first increased and then decreased, while that of Oceanobacillus continued to decrease with fermentation (Supplementary Fig. 1). The total relative abundances of these genera showed a general trend consisting of an initial increase followed by a decrease. In all samples, the total amount of indigo-reducing bacteria peaked in the early stage of fermentation, on day 14 for Batch 1 and day 9 for Batch 2. In addition, the total amount in the long-term broth was more than that detected in short-term broth, which was more than the 8% detected before deterioration in Batch 2; however, the value in Batch 1 was 5.6% on day 28, decreasing to 1.5% by day 42.
Statistical analysis with OTUs
Observed species from rarefaction curves
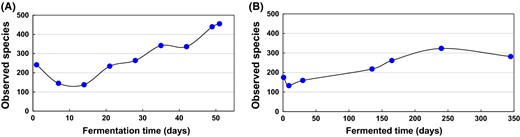
Changes in microbial diversity fluctuation during indigo fermentation. Fluctuation based on the number of taxonomic units for each sequence read in the samples of Batch 1 (3818 sequences read) (a) and Batch 2 (3730 sequences read) (b). These data were based on the rarefaction curves showing the bacterial diversity of indigo fermentation samples from Batch 1 and Batch 2
The bacterial populations in the sukumo fermentation broths changed during the whole fermentation process. The bacterial diversity of both batches decreased from the beginning to the reducing stage, and then increased until the final deterioration in the fermentation broths. That is, in the initial reduction state, the bacterial diversity was relatively low, and in the subsequent state, the bacterial diversity increased. Low bacterial diversity is conducive to fermentative reduction, and high diversity increases the risk of deterioration of the fermentation broth. However, comparison of Batch 1 and Batch 2 showed that the short-term Batch 1 maintained low bacterial diversity for a very short time (within 28 days), and the bacterial diversity of Batch 1 reached that of Batch 2 on day 165, which represents a sixfold difference in time. Based on this result, it is speculated that prolonging the period of low bacterial diversity in the stationary phase would play a positive role in maintaining a long period of reduction.
Principal coordinates analysis (PCoA)
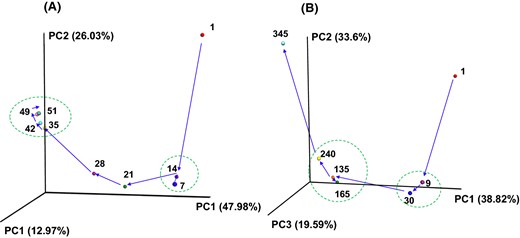
PCoA plot showing the changes in bacterial community during indigo fermentation. The plot shows Batch 1 (a) and Batch 2 (b). The numbers beside the symbols represent the fermentation time (days). The arrows indicate the routes of the changes in bacterial community during the fermentation period in Batch 1 and Batch 2. The dotted circles indicate that the microbiota remained stable

Fluctuation in the relative abundance of the indigo-reducing genera and dominant taxa. Short-term Batch 1 (a) and long-term Batch 2 (b) during each fermentation period for different fermentation periods. The presented results are based on next-generation sequence (NGS) analyses
Discussion
This study pioneered the use of indigo fermentation broths that maintained short-term and long-term reduction states and examined the bacterial communities and differences between these two batches. Although transformation in the microbiota occurred in both the short-term and long-term batches, the change velocity decreased after day 9 in Batch 2. On the other hand, the change velocity of the microbiota increased after day 14 in the short-term Batch 1 compared to that observed in the previous 7 days (days 7–14).
The presented results suggest that entry into a stable state at approximately 10 days in the long-term fluid is important for long-lasting indigo fermentation. The microbiota generated within 10 days of fermentation initiation exhibited retention ability. This period may correspond to the period in which obligate anaerobes were dominant in the fluids. The most predominant taxa transformed successively as follows: seeds (mostly oxygen metabolizing aerobes) → obligate anaerobes (i.e., Anaerobranca) → facultative anaerobes (i.e., Bacillus in Fig. 2; P. indicireducens in Fig. 6b). In addition to the most predominant organisms, reported aerotolerant indigo-reducing genera were present at a relative abundance of 7.4–16.3% during the indigo-reduction period. Comparison with the short-term fermentation fluid showed that the successive transitional change from predominance of the obligate anaerobe Anaerobranca to P. indicireducens was associated with the stable state of the microbiota. This stability was demonstrated by the endurance of the indigo-reducing state, although a substantial decrease in pH occurred in the Batch 1 at approximately days 95–102. Although the taxa were different from those in the present study, the predominance of obligate anaerobes in long-term indigo fermentation fluid was reported previously [30]. This retention is attributed to the environmental pressure of alkaline anaerobic conditions [1] and the persistence of the bacteria adapted to the environment (i.e., obligately anaerobic alkaliphiles). Natural fermentation processes that utilize spontaneously occurring microbiota have been used to produce several fermented foods, beverages and condiments [19, 20, 35, 37]. In most of these cases, acidic and/or salty environments define the adapted microbiota. In the case of traditional Korean fish sauce, fermentation (myeolchi-aekjeot) samples exhibit stable states of the microbiota under the appropriate fermentation conditions [20].
On the other hand, according to the microbiota, the stable state was maintained appropriately until day 14 in short-term indigo fermentation. On day 21, Pseudomonas was the predominant taxon, and its dominance lasted until day 51. This change may have resulted from the introduction of lactic acid on day 13. When lactic acid was introduced, the redox potential of the fermentation fluid increased to − 530 mV (Fig. 3a). In the non-dyeing deteriorated stage, Gram-negative bacteria were predominant in both batches. In addition to the high redox potential, a localized low-pH niche may eventually have been formed in the fermentation fluid, and this event may have increased the levels of Gram-negative bacteria such as Pseudomonas and Alcaligenaceae (Figs. 2, 6). This difference may have been due to Batch 1 having a small fermentation volume, which readily induces high redox potential, and a localized low-pH niche may have been produced due to stirring with a thinner glass bar than that used for Batch 2. Normally, the abundances of these taxa hardly increase under highly anaerobic and high-pH conditions, which are dominated by obligately anaerobic alkaliphiles. Detection of unfavorable taxa in the initial stage of propagation could prevent further propagation. Therefore, it is considered that there may be a period of susceptibility in which propagation of unfavorable taxa could occur. For example, during the period of entry into the obligate anaerobe-dominated phase, the mixture may be susceptible to unfavorable environmental changes. When the high redox potential occurred on day 13, the proportion of Anaerobacillus began to decrease (Fig. 6a). Bacteria belonging to Alcaligenaceae (genus Alcaligenes) are often observed in reduced indigo fermentation fluid [2, 27]. Therefore, a taxonomic study to identify Alcaligenaceae species observed in this study is desirable. The relative abundance of Alcaligenaceae and the time periods at which these species are present are important for determination of the staining intensity of textiles.
In this study, Amphibacillus, Alkalibacterium, and Oceanobacillus were detected in the initial sample (day 1) of Batch 1, and Amphibacillus and Oceanobacillus were detected in the initial sample (day 1) of Batch 2. These genera have been isolated from microbial indigo fermentation using sukumo as the source of the dye and have been indicated to include several indigo-reducing bacteria [11–13, 28, 41, 42]. Although the correlation between the relative proportions of Amphibacillus, Alkalibacterium, and Oceanobacillus and dyeing intensity exhibited a 7–14-day lags, there was a correlation observed in short-term fermentation. On the other hand, a direct correlation between the relative proportion of Amphibacillus and Oceanobacillus and dyeing intensity was observed in long-term fermentation (supplementary Fig. 1). Changes in the relative abundances of dominant taxa other than Amphibacillus, Alkalibacterium and Oceanobacillus were examined (Supplementary Fig. 1). In both batches, the abundance of Anaerobranca decreased as the fluids exhibited a shift toward deterioration (Fig. 6). Therefore, Anaerobranca is predicted to be a favorable bacterium for maintenance of a reducing state in indigo fermentation. On the other hand, Alcaligenaceae species were also predominant in both deteriorated fermentation fluids (Fig. 6). Although the mechanisms of inhibition of indigo reduction by Alcaligenaceae are unknown, it is possible that these organisms degrade indigo via the activity of enzymes such as laccase [36, 43].
There remains still a great possibility that a large number of potential indigo-reducing bacteria were not detected by NGS with the primer pair 515F-805R in this study [22]. In addition, the determined gene sequences were not always long enough to identify the corresponding species that were reported as indigo-reducing bacteria. Furthermore, although we detected their presence in this study, several taxa have not been identified as indigo-reducing bacteria. For example, the genus Anaerobranca was abundant in both Batch 1 and Batch 2. It was assumed that Anaerobranca spp. include indigo-reducing bacteria because of their phylogenetic position adjacent to indigo-reducing bacteria and their Fe3+-reducing characteristics [9].
Many studies have examined the microbiota in natural fermentation systems, such as fermented fish, fermented soybean condiments, lambic beer and fermented rice bran [19, 20, 26, 35, 37, 38, 40]. In most of these cases, fermentation occurs in salty and/or acidic environments. However, the largest difference is that indigo needs to be continuously used for dyeing during the fermentation process and that the reduction reaction needs to continue after dyeing. Most natural fermentation processes can be transferred to seed cultures of single microbial species because there is little chance of intensive contamination from external environments. However, maintenance of a stable microbiota under alkaline anaerobic conditions is much more important in indigo fermentation than in other natural fermentation processes due to the requirement for long-term maintenance. Determination of the reducing period of the fermentation fluid and the changes in bacterial dynamics during the whole fermentation process will be helpful for identification of a stable and efficient bacterial community for indigo reduction, and the findings will be applicable for the stabilization of other alkaline anaerobic bioprocesses [7, 8, 18, 25].
Funding
This work was funded by the Japan Society for the Promotion of Science (Grant No. 2357012 and 16K07684).
References
Perkin, A.G.; Bloxam, W.P. CLXII. Indican. Part I Transactions. J. Chem. Soc. 1907, 91, 1715-1728
Vuorema A (2008) Reduction and analysis methods of indigo. Dissertation thesis, Department of Chemistry, University of Turku, Finland
Publisher's Note
Springer Nature remains neutral with regard to jurisdictional claims in published maps and institutional affiliations.
