


Abstract
Due to the potential toxicity of mercury, there is an immediate need to understand its uptake, transport and flux within living cells. Conventional techniques used to analyze Hg2+ are invasive, involve high cost and are less sensitive. In the present study, a highly efficient genetically encoded mercury FRET sensor (MerFS) was developed to measure the cellular dynamics of Hg2+ at trace level in real time. To construct MerFS, the periplasmic mercury-binding protein MerP was sandwiched between enhanced cyan fluorescent protein (ECFP) and venus. MerFS is pH stable, offers a measurable fluorescent signal and binds to Hg2+ with high sensitivity and selectivity. Mutant MerFS-51 binds with an apparent affinity (K d) of 5.09 × 10⁻⁷ M, thus providing a detection range for Hg2+ quantification between 0.210 µM and 1.196 µM. Furthermore, MerFS-51 was targeted to Escherichia coli (E. coli), yeast and human embryonic kidney (HEK)-293T cells that allowed dynamic measurement of intracellular Hg2+ concentration with a highly responsive saturation curve, proving its potential application in cellular systems.
Electronic supplementary material
The online version of this article (10.1007/s10295-019-02235-w) contains supplementary material, which is available to authorized users.
Introduction
Metal ions are essentially needed by a certain set of biological organisms for crucial cellular processes and metabolic functions necessary to support life. Metals either act as cofactors for the catalytic activity of an enzyme or constitute an integral part of the structural component of a protein. Several efficient mechanisms such as metal acquisition by metalloproteins, influx/efflux ion pumps, and metal ion transporters/carriers are adapted by both prokaryotes and eukaryotes to maintain an appropriate balance of metal ions within the cell [1]. In contrast to important metal and transition metal ions, toxic metals present in even trace amounts can cause detrimental effects on human health and the environment. Toxic metals may include heavy metal ions (Hg2+, Pb2+, Fe2+, Cd2+, Cu2+, Zn2+) as well as semi-metallic elements or metalloids (As3+, Se2+) [2]. Heavy metals are ubiquitous, non-biodegradable, tend to bioaccumulate and are extremely harmful [3]. Most of the heavy metals are carcinogens that bind to DNA and proteins and alter the genetic makeup of a cell, resulting in extreme health complications that are not only toxic but also life-threatening [4]. In small quantities, heavy metals form complexes, especially with biological matters containing nitrogen, sulfur and oxygen in their active sites [5]. These interactions can cause structural changes in a protein at the molecular level and inhibit enzymes required for certain metabolic reactions. The toxicological profile of affected individuals highlights the carcinogenic effects of heavy metals on the central nervous system, kidneys, liver, skin, bones and teeth and can lead to acute toxicity, neurobehavioural retardation, multidrug resistance and even death [5–7]. As one of the heavy metals, mercury is a highly reactive and extremely volatile environmental pollutant that can be readily absorbed into the lungs/by intestinal tissues via skin exposure and may cause indigestion [8]. Mercury levels in ambient air are reported to be in the range of 2–10 ng/m3 [9]. The recommended mercury level in drinking water is 6000 ng/L as per the guidelines set by the World Health Organization [10]. The mean mercury concentration in whole blood is usually below 10 μg/L, but the value up to 20 μg/L is considered normal, whereas urine mercury concentration exceeding 100 μg/L can result in nervous disorders, and the level of 800 μg/L or above is fatal [11]. The most toxic methylmercury (MeHg) has a strong affinity for the thiol groups of proteins [12] and is a major concern to human life and ecosystem [13], as it affects the central and peripheral nervous systems causing severe neurobehavioral disorders. Methylmercury is a hydrophobic that crosses the blood–brain barrier and gets accumulated in the brain [13, 14]. Inorganic mercuric salts are reported to be corrosive to the skin, eyes and gastrointestinal tract. Mercury and its compounds have a strong affinity for sulfur and thiol group-containing molecules such as glutathione (GH), glutathione peroxidase, glutathione reductase, cysteine, metallothionein (MT) and superoxide dismutase (SOD) [15–17]. Mercuric compounds are also responsible for the inhibition of enzymes such as succinate dehydrogenase and cytochrome c oxidase involved in the citric acid cycle. Enzyme inhibition by this heavy metal leads to several neurological and behavioral disorders along with other nephrotoxic symptoms [18]. Hg2+ exposure generates free radicals like reactive oxygen species (ROS) in the body, thus inducing oxidative stress by affecting K+ and Ca2+ concentrations in mitochondria. Such decreased Ca2+ levels alter the neurotransmitter release, thereby increasing concentrations of dopamine and acetylcholine. Malondialdehyde (MDA) levels also increase because of lipid peroxidation on high-level Hg2+ exposure [19]. Furthermore, inhalation, ingestion and dermal exposure of mercuric salts induce symptoms like tremors, insomnia, memory loss, neuromuscular effects, headaches and cognitive and motor dysfunction.
In past, different spectroscopic approaches such as inductively coupled plasma atomic electron spectrometry (ICP/AES), atomic absorption spectrophotometry (AAS), mass spectrometry (MS), electrochemical (ion electrodes), chromatographic, voltammetric and optical methods were employed to monitor and detect mercury ions in environmental and biological samples [20–23]. Gas chromatography [24], colorimetric probes [25, 26], X-ray fluorescence and nuclear microscopy were other methods that were considered while selecting analytical tools for measuring mercury levels [27]. However, all these traditional techniques are expensive, bio-incompatible, toxic, complicated, time consuming, show low selectivity and less sensitivity and require degradation/disruption of biological samples along with highly trained personnel [6]. Therefore, the development of new and inexpensive methods for the detection of bioavailable Hg2+ concentrations is highly desirable when it comes to in situ analysis and low-level pollutant detection. Biosensors are promising, fast emerging and cost-effective tools to detect such heavy metals. Fluorescence backed biosensor technology has gained tremendous popularity in recent times. Construction of fluorescence resonance energy transfer (FRET)-based nanosensors for heavy metal detection is the latest approach in current times that has worked to quantify trace concentration of heavy metals, localize and monitor the distribution of metal ions within the cellular and subcellular compartments of the cell in real time.
An extensive range of FRET approaches has been designed for the detection of Hg2+ in cellular systems. One of them discusses the development of a fluorescent ratiometric chemosensor dyad (L) bearing organic dyes like rhodamine B and naphthalimide as FRET pair [28], while the other uses N-acetyl-l-cysteine functionalized quantum dots (NAC-QDs) and Rhodamine 6G derivative-mercury conjugate (R6G-D-Hg) as donor and acceptor molecules [29] for detection of Hg2+ in aqueous solution. In another approach, polymeric nanoparticles were used as the scaffold where nitrobenzoxadiazolyl derivative (NBD) dye (the donor) was embedded in the nanoparticles and rhodamine derivative SRhB-NH2 was covalently linked to the particle surface and used as the recognition element for Hg2+ [30]. However, each method of Hg2+ detection comes with its own drawbacks. Organic dyes are prone to metabolic degradation, have limited photostability and show reduced quantum yield at near-infrared wavelengths. Their use in biological studies results in bleed-through or spectral crosstalk in the dual emission detectors. Owing to their relatively narrow absorption/emission bands and small Stokes shifts, organic dyes like rhodamine and fluorescein experience ‘red tail’ emission spectra that consequently lead to signal leakage [31]. Quantum dots (QDs), on the other hand, are nanocolloids that are cytotoxic and their broad absorption spectra further limit their use as FRET acceptors in fluorescence quantification studies. Moreover, QD-protein fusion sensors, because of their potentially large size and random switching between emitting and non-emitting states render them less efficient and are difficult to induce in living cells [31–33]. The recently developed microbial and cell-free luminescence/fluorescence-based biosensor uses MerR protein as the recognition element for Hg2+ and luciferase (LucFF) and emerald green fluorescent protein (EmGFP) genes separately as reporters [34]. Firefly luciferase can help study single molecular events and has a large size that limits its ability to be used as a recombinant protein as it leads to stearic hinderance [35]. In single FP-based sensors, binding of metal induces a change in the chemical environment of the cell, causing an intensity change or a shift in the fluorescence spectrum, whereas in sensors containing two FPs, metal binding induces a conformational change in the binding domain and consequently give rise to a FRET signal [36].
Here we are reporting a genetically encoded FRET-based nanosensor for Hg2+ ions that makes use of a mercury-binding MerP protein and two green fluorescent protein (GFP) variants ECFP and venus (a red-shifted yellow fluorescent protein) to monitor the dynamic flux of Hg2+ ions in a concentration-dependent manner both in vitro and in cellular systems. This sensor is genetically encoded and potentially non-invasive that establishes its efficacy and can be used for the detection of Hg2+ in cellular systems. MerP, a component of the bacterial mercury detoxification system, is a 72-residue protein that binds mercury in the periplasm and transfers it to the transport proteins MerT or MerF releasing the metal into the cytoplasm where the enzyme mercuric reductase reduces Hg2+ to Hg0 [37, 38]. Conformational changes induced in MerP protein upon the addition of Hg2+ ions bring the donor ECFP at N-terminus and the acceptor venus at C-terminus of merP gene in close vicinity, transforming this change into a ratiometric FRET signal. This genetically encoded FRET-based nanosensor would allow real-time and in situ detection of Hg2+ ions which would help to tightly regulate their intracellular concentration in different cellular environments.
Materials and methods
Designing and construction of the nanosensor
The sequence and crystal structure of MerP protein were retrieved from the Kyoto Encyclopedia of Genes and Genomes (KEGG) database, managed by NPO Bioinformatics Japan and RCSB Protein Data Bank (PDB), respectively. Mercury sensing merP gene was amplified by PCR from genomic DNA of Pseudomonas aeruginosa after removing 20 signal peptides from the 5ʹ end and one STOP codon from the 3ʹ end of the gene using a forward primer (5ʹ-CGGggtaccACCCAGACCGTCACGCTAGCGG-3ʹ) and a reverse primer (5ʹ-CGGggtaccCTTGACGCTGGACGGATAGCCG-3ʹ). The lowercase sequence shows the restriction site KpnI. The fluorescent proteins (FPs) ECFP and venus are mutated variants of GFP extracted from a cnidarian, Aequorea victoria. The intrinsic fluorescence properties exhibited by these two FPs were exploited to construct the genetically encoded FRET-based nanosensor. The sensor was generated by sequentially ligating the genes encoding ECFP, merP and venus in pRSET-B (Invitrogen, USA) bacterial expression vector that adds an in-frame His tag at the amino terminus of the sequence and transformed in E. coli DH5α to generate a chimeric mercury FRET sensor. Gateway technology, following manufacturers’ instruction, was used for the shuttling of MerFS-51 in pYES-DEST52 (Invitrogen, USA). Yeast Saccharomyces cerevisiae (S. cerevisiae/URA3) strain BY4742 was maintained on YEPD (1% yeast extract, 2% peptone and 2% glucose) agar, grown in liquid YEPD medium with aeration on a shaker at 30 °C and transformed with MerFS-51. The chimeric sequence was then excised from the bacterial expression vector and sub-cloned in pcDNA3.1(-) (Invitrogen, USA) at BamHI and HindIII sites, respectively, for expression in HEK-293T cells.
Expression and purification of the nanosensor protein
Heat shock method was employed to transform the chimeric pRSET-B-ECFP-merP-venus plasmid in E. coli BL21-codon plus. The expression of the nanosensor was carried out by inoculating a single transformed colony in Luria-Bertani (LB) broth at 37 °C till the OD600 reaches 0.6. The cells were then induced by β-D-1-thiogalactopyranoside (IPTG) to a final concentration of 1 mM and grown at 20 °C for 16 h in a dark environment. The expressed cells were harvested at 6500 × g for 30 min and resuspended in a lysis buffer containing Tris–Cl pH 8.0, sodium chloride, imidazole, glycerol, a detergent (Triton-X) and a protease inhibitor phenylmethylsulfonyl fluoride (PMSF). Sonication was done to lyse the bacterial cells and the extracted sensor protein was collected by centrifugation at 6500 x g for 30 min. Nickel-nitrilotriacetic acid (Ni–NTA) His-tag affinity chromatography was used for purification of the sensor protein. Ni–NTA resin was washed with a wash buffer (20 mM Tris–Cl and 10 mM imidazole) to equilibrate the beads at pH 7.8. Binding of the protein was done at 4 °C for 1 h, which was followed by washing of the column with three consecutive buffers (Buffer A: 30 mM Tris pH 8.0, 150 mM NaCl, 10 mM imidazole, 5 mM β-mercaptoethanol, 5% glycerol; Buffer B: 30 mM Tris–Cl pH 8.0, 500 mM NaCl, 10 mM imidazole, 5% glycerol; Buffer C: 20 mM Tris–Cl pH 8.0). The protein was then eluted with a buffer (30 mM Tris pH 8.0, 150 mM NaCl, 300 mM imidazole, 5 mM β-mercaptoethanol, 5% glycerol) and kept at 4 °C overnight to allow proper folding of the protein to its native conformation. The purity of the protein was checked by running a 10% sodium dodecyl sulfate polyacrylamide gel electrophoresis (SDS-PAGE). The purified sensor protein was named as the mercury FRET sensor (MerFS).
Stability evaluation and fluorescence emission spectrum of sensor protein
The purified MerFS protein was diluted to a concentration of 0.15 mg/ml several times to carry out the characterization of the protein in various buffer systems ranging from pH 5.0 to 8.0. The buffers used were PBS (phosphate-buffered saline), TBS (Tris-buffered saline), Tris Cl and MOPS (3-(N-morpholino) propanesulfonicacid). Further stability of the protein was confirmed in 20 mM PBS buffer in the absence and presence of 0.5 µM Hg2+ ions. Fluorescence emission spectra of ECFP and venus were recorded using a monochromator microplate reader (Biotek, USA) through excitation of ECFP at 420 nm and fluorescence intensity was recorded in the range of 460–600 nm.
Mutagenesis and ligand-binding isotherm of the MerFS proteins
PDB was searched for retrieving the structure of MerP protein (PDB id: 1AVJ) and the amino acids involved in the binding pocket were identified. The binding motif GMTCSAC of MerP protein is responsible for the binding of the Hg2+ ions. It has been previously established that a change in position of the two cysteines residues in the metal-binding sequence GMTCXXC, i.e., CAAC, CACA, and CCAA affects the binding capacity and specificity of MerP for mercury ions [39]. Therefore, a set of affinity mutants S34A (GMTCAAC, serine replaced by alanine at position 34), S34C (GMTCCAC, serine replaced by cysteine at position 34), S34C-C36A (GMTCCAA, serine replaced by cysteine at position 34 and cysteine replaced by alanine at position 36) and C33G-C34G (GMTGGAA, cysteine replaced by glycine at both position 33 and 34) of MerFS were created by introducing point mutations in the merP gene. For this purpose, a QuikChange site-directed mutagenesis kit was used. These mutations were carried out to check the role of cysteine residues in binding of Hg2+. A double mutant C33G-C34G was developed in which both the cysteine residues present in the binding motif were mutated to glycine. Since MerP has been shown to bind Hg2+ through these two cysteine residues, this variant would serve as a control to study the binding event in cellular experiments. This variant was given the name MerFS-control. Mutations were also performed to alter the physiological range of the sensor proteins. The mutant sensor proteins were then expressed and purified as stated above.
For checking the affinity of MerFS proteins towards the different metal ions, a fluorescent signal in the form of FRET ratio was recorded in a microtitre plate with 96-well till no more change in the FRET ratio was observed to obtain a ligand titration saturation plot. The excitation filter used was 420/20 nm and the emission filter set for ECFP and venus was adjusted to 485/20 nm and 540/20 nm, respectively, for recording the FRET signal. Further binding constants (K d) of the WT and sensor variants were calculated using GraphPad Prism software by fitting the ligand titration curve in a binding isotherm equation [40, 41]: S = (r − r apo)/(r sat − r apo) = [L]/(K d + [L]), where S is saturation; [L] is ligand concentration; r is the relative ratio change of the emission intensities of the two fluorophores with respect to the increasing concentration of the ligand; r apo is ratio in the absence of ligand and r sat is ratio at saturation with ligand.
Metal specificity of the wild-type and affinity sensors
To evaluate the specificity and selectivity of the WT sensor and its variants, the purified sensor proteins were diluted in 20 mM PBS buffer and incubated with various metal ions at physiological concentrations. The tested metal salts included HgCl2 (1 µM), CH3ClHg (3 µM), CdCl2 (10 nM), CuCl2 (100 nM), ZnCl2 (10 µM), AsCl3 (1 µM), NaCl (2 mM), KCl (150 mM), CaCl2 (10 µM), MgCl2 (10 mM) and FeCl2 (100 µM). The change in the FRET ratio was recorded to determine the metal specificity of the sensor proteins. All readings were taken in triplicates in a monochromator microplate reader with a 96-well plate.
Measurement of intracellular Hg2+ in bacteria
Uptake of Hg2+ in E. coli was monitored in a time-dependent manner. MerFS-51 was expressed in E. coli BL21-codon plus strain by inducing the cells in their log phase with 1 mM IPTG at 20 °C in dark. The expressed cells were separated from the media and resuspended in 20 mM PBS buffer (pH 7.0). Bacterial cell suspension along with Hg2+ ions was dispensed in microplate wells in triplicates. FRET ratio was recorded at regular intervals of 5 min for a period of 2 h. Simultaneously, a control experiment was designed using MerFS-control and the ratiometric change was monitored for the defined period in the presence of 0.5 µM Hg2+. The excitation filter used was 420/20 nm and the emission filter set for ECFP and venus was adjusted to 485/20 nm and 540/20 nm, respectively, for recording the dual emission intensities in the form of FRET signal. Confocal microscope (Leica, Wetzlar, Germany) equipped with a confocal head TCS-SPE and 63x objective piece with 1.53 N. A. and a coupled camera was used for checking the expression and to take images of MerFS-51 after fixing the expressed bacterial cells by an adhesive on a glass slide.
Live cell monitoring of Hg2+ uptake by MerFS-51 in eukaryotic cells
Yeast and HEK-293T were used as eukaryotic model systems for the cell-based study of MerFS-51. MerFS-51 was introduced in BY4742 strain for monitoring the uptake, localization and distribution pattern of MerFS-51 in yeast cells. Selection of the cells transformed with MerFS-51 was done using synthetic-defined (SD) agar plates and the cells were grown for expression in YEPD media for 3–5 days with 3% galactose and 2% sucrose. Since the destination vector pYES-DEST52 contains Gal1 promoter, galactose works as an inducer and sucrose is added to maintain the nutrients in the growth media. To establish a negative control, the construct MerFS-control was cloned in yeast expression vector pYEST-DEST52. The yeast cells were fixed on a glass slide and FRET ratio (540/485 nm) along with ratiometric imaging after the addition of 0.5 µM mercury was performed using a 63x oil immersion objective of the confocal microscope (Leica, Germany) for 10 min.
Dulbecco’s modified Eagle’s media (DMEM, Sigma, USA) enriched with 10% heat-inactivated fetal bovine serum (FBS, Gibco-life technologies, Thermo Fisher Scientific, USA) and 1% antibiotic cocktail was used to maintain the HEK-293T cell line. HEK-293T cells were cultured in sterile polylysine-coated coverslips embedded in 6-well cell culture plate in a humidified incubator (5% CO2) at 37 °C and were serum starved for 3–5 h before transfecting cells with MerFS-51 with the help of a transfection reagent lipofectamine. The cells were grown for 48 h after transfection and healthy growth conditions were maintained by replacing the medium of cells with fresh complete media as and when required. For imaging purposes, the cells were washed with 20 mM PBS buffer (pH 7.0) and emission ratio change was recorded on a confocal microscope. Dual emission fluorescent intensities were measured after the addition of 0.5 µM mercury that uses an excitation filter of 420 nm. Ratiometric emission intensities were recorded for 10 min and images of the expressed MerFS-51 were acquired. As a negative control, C33G-C34G mutant was cloned in mammalian cell expression vector pcDNA3.1 (−) and changes in the ratio were recorded for 10 min after the addition of 0.5 µM Hg2+.
Cell culture and cytotoxicity studies
Culture of HEK-293T cells was maintained in DMEM medium supplemented with 10% heat-inactivated FBS and 1% antibiotic–antimycotic cocktail (penicillin, streptomycin and amphotericin-B) in a humidified CO2 chamber (5% CO2, 37 °C). The cytotoxicity evaluation of mercury was carried out using standard MTT (3-[4,5-dimethylthiazol-2-yl]-2,5- bromide) assay [42–44]. Briefly, the cells (9000-10,000 cells/well) were plated in a 96-well cell culture plate. After 24 h growth, the cells were incubated with increasing concentrations of mercury Hg2+ (0–5 μM) for 24 h. The culture medium was aspirated and cells were washed with phosphate-buffered saline (pH 7.4). After washing, cells were incubated for 4–5 h with 100 µl of incomplete medium and 25 µl of MTT solution (taken from 5 mg/ml stock), at 37 °C in the CO2 incubator. Subsequently, the supernatant of cells was removed and the remaining formazan crystals were dissolved by adding 150–200 µl of dimethyl sulfoxide (DMSO). The absorbance of the resultant solution was taken at 570 nm using a multiplate ELISA reader (BioRad). Finally, the percentage cell viabilities were calculated and plotted as a function of Hg2+ concentration.
Results and discussion
Construction of a nanosensor
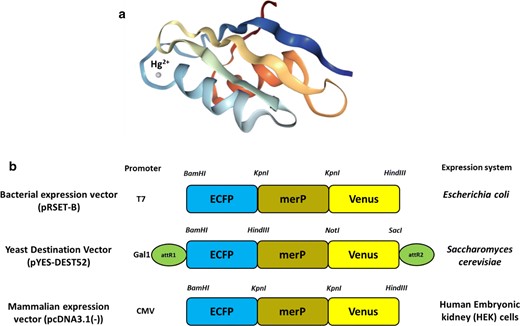
Construction of a nanosensor. a Crystal structure of periplasmic mercury-binding (MerP) protein showing Hg2+ as a dot structure. b Linear representation of MerFS constructs in different vectors for expression in prokaryotic and eukaryotic systems
Mercury is highly hazardous and poses severe toxic and deleterious effects on the environment resulting in serious substantial health problems [6, 49, 50]. Therefore, understanding the uptake and distribution of Hg2+ non-invasively becomes a crucial aspect for the diagnosis and identification of this metal-induced diseases and disorders for pathophysiological and clinical purposes. Thus, this genetically encoded FRET-based sensor would help to understand Hg2+ homeostasis in a non-destructible and non-invasive manner. The sensor construct MerFS-51 was also transferred to pYES-DEST52 a destination vector via an entry pENTR4 vector through Gateway technology for expression of the sensor protein in yeast BY4742 and to pcDNA3.1(-) vector for expression in HEK-293T cells.
Expression and purification of the nanosensor protein
Expression of the sensor protein in E. coli BL21-codon plus cells was obtained by inducing with 1 mM IPTG once the OD600 reached 0.6 and the cells were further grown in dark for 16 h at 20 °C. The cells were then lysed to release the sensor protein that carries an N-terminal His6 tag for purification through affinity chromatography from E. coli cells. The nanosensor protein was successfully purified and fidelity and size were confirmed by running a 10% SDS-PAGE.
Fluorescence emission spectrum of MerFS
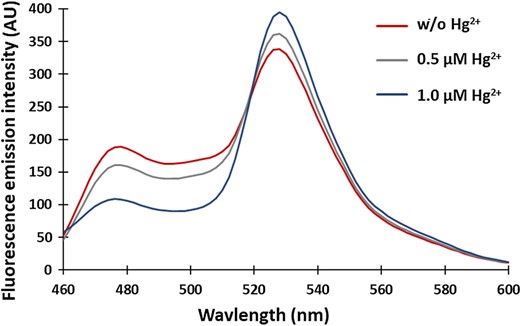
The fluorescence emission spectrum of the MerFS protein. The spectrum was recorded in a fluorimeter by exciting the sensor protein at 420 nm. An increase in the FRET ratio is observed upon mercury binding as the emission intensity of ECFP decreases with a concomitant increase in the emission intensity of venus
pH stability of MerFS protein
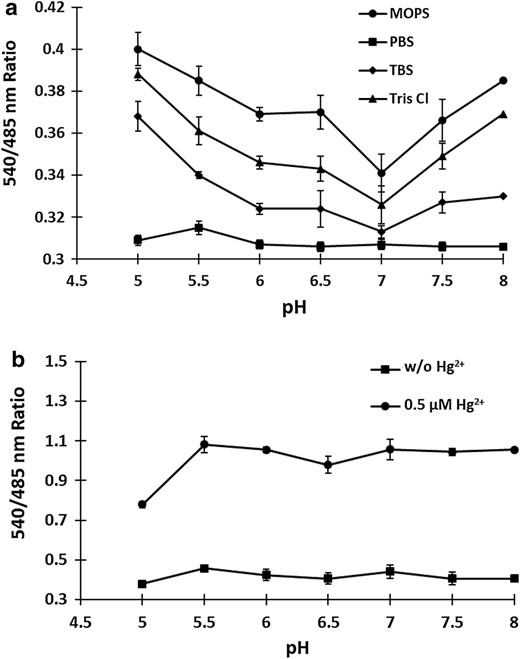
Stability of MerFS protein. a The stability was measured by calculating the 540/485 nm ratio in various buffer systems (MOPS, PBS, TBS and Tris–Cl) in the pH range 5.0–8.0. b pH stability of MerFS in PBS buffer. FRET ratio was measured in PBS buffer with different pH, in the absence and presence of 0.5 µM mercury. Stability increases with pH and the sensor stabilize above pH 7.0. Data are means of three independent replicates (n = 3). Vertical bars indicate standard error
Affinity mutants and binding isotherms
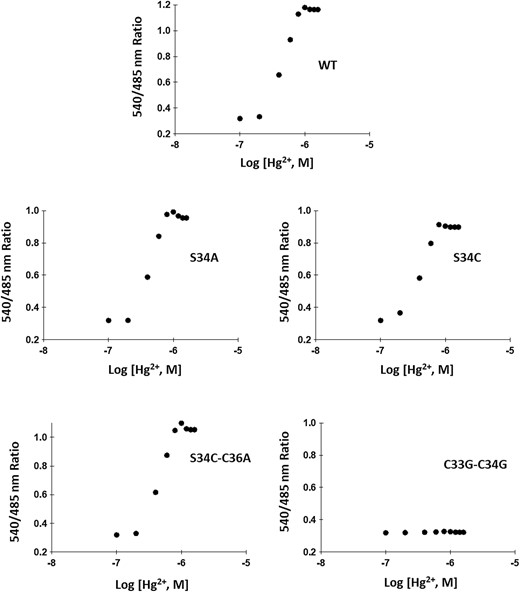
Ligand-binding isotherms of the WT and affinity sensors. In vitro ligand-dependent FRET ratio change was recorded in the presence of mercury. Affinity mutants S34A, S34C, S34C-C36A and C33G-C34G compared with WT nanosensor
Binding constants and dynamic range of MerFS-WT and mutants
| Sensor namea | Sequences | Binding motif | K d (M) (± SD*) | Dynamic rangeb (µM) |
|---|---|---|---|---|
| MerFS-89 | Wild type | GMTCSAC | 8.90 × 10⁻⁷ (± 0.01) | 0.210–1.196 |
| MerFS-73 | S34A | GMTCAAC | 7.34 × 10⁻⁷ (± 0.02) | 0.362–1.061 |
| MerFS-51 | S34C | GMTCCAC | 5.09 × 10⁻⁷ (± 0.02) | 0.234–1.028 |
| MerFS-82 MerFS-control | S34C-C36A C33G-C34Gc | GMTCCAA GMTGGAA | 8.16 × 10⁻⁷ (± 0.03) No binding | 0.289–1.139 - |
Binding constants (K d) was determined in vitro
*Standard deviation (SD)
aNumber next to the mutant name stands for the K d of the sensor variants
bEffective quantification range between 10% and 90% saturation of the nanosensor
cMerFS-control (C33G-C34G) was created using mutant S34C-C36A as a template
In vitro characterization and metal specificity of the nanosensors
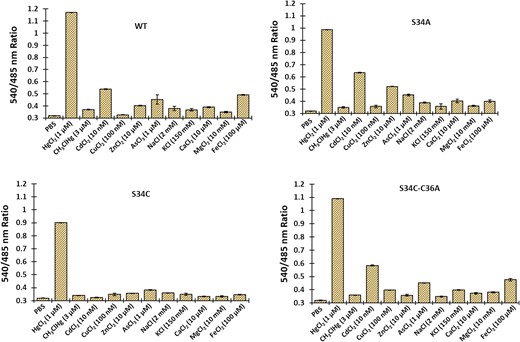
Comparison of the metal specificity of wild-type MerFS and the three affinity mutants. The ratio change was tested in the presence of various metal ions such as Hg2+, MeHg+, Cd2+, Cu2+, Zn2+, As3+, Na+, K+, Ca2+, Mg2+ and Fe2+. Data are means of three independent replicates (n = 3). Vertical bars indicate standard error
Intracellular monitoring of mercury uptake in bacterial cells
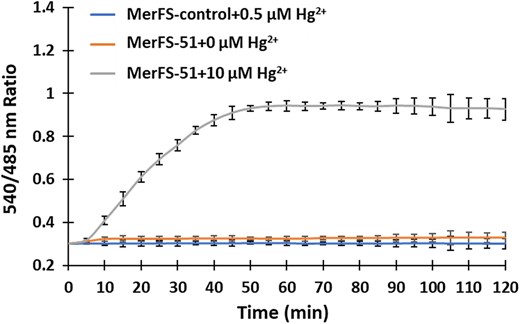
Monitoring of mercury uptake in bacterial cells. The time-dependent response curve was obtained by measuring the FRET ratio after the incubation of bacterial cell suspension containing MerFS-51 with 0.5 µM mercury. 0.5 µM Hg2+ was also added to MerFS-control and the ratiometric change was obtained for the defined period. Data are means of three independent replicates (n = 3). Vertical bars indicate standard error
Live cell imaging of Hg2+ uptake in eukaryotes
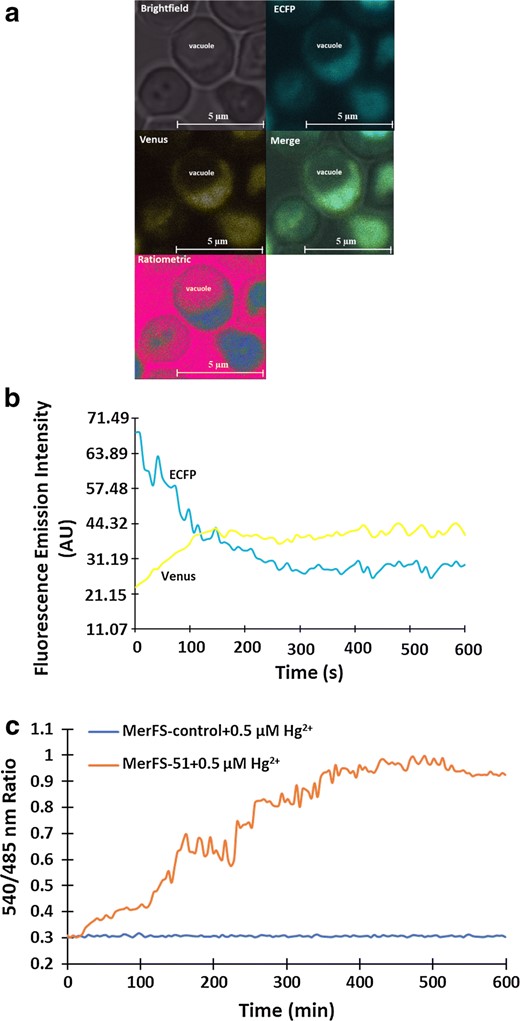
Real-time imaging of dynamic flux rate changes of Hg2+ uptake in yeast cells. a Confocal image showing expression of MerFS-51 in the cytosol of yeast S. cerevisiae (scale bar—5 μm). Yeast images are pseudocolored to demonstrate Hg2+-dependent ratio changes. b Fluorescence emission intensities of ECFP and venus in the presence of mercury. The addition of Hg2+ over time decreased the ECFP emission and increased the venus emission intensity representing the energy transfer. c The graph indicates 540/485 nm ratio change in the cytosol of single yeast cell expressing MerFS-51 in presence of 0.5 µM Hg2+. The ratiometric change obtained after the addition of 0.5 µM Hg2+ to the MerFS-control was also recorded and compared with the changes obtained with MerFS-51
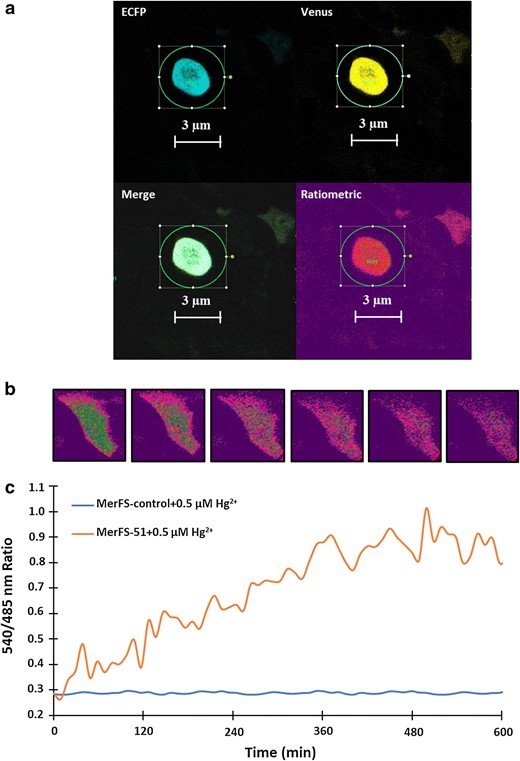
Detection of Hg2+ uptake by of MerFS-51 in HEK-293T cell line. a Confocal image of mammalian HEK-293T cells expressing the nanosensor showing ECFP, venus, merge and ratiometric channels (Scalebar–3 μm). The ratiometric HEK-293T images are pseudocolored to demonstrate Hg2+-dependent ratio changes. b Time-dependent FRET ratio change in single HEK-293T cell separately expressing MerFS-51 and MerFS-control in the presence of externally supplied 0.5 µM Hg2+. The graph indicates the venus/ECFP ratio change for 10 min
Cytotoxicity studies
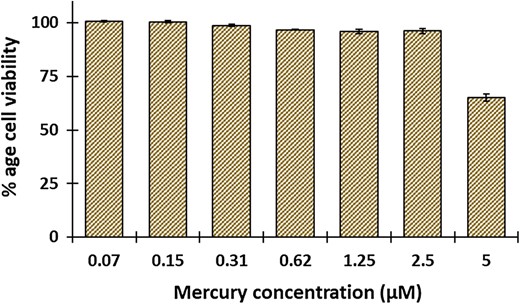
Cell viability studies of mercury on HEK-293T. Viability of HEK-293T cells treated with increasing concentration of Hg2+ (0–5 μM) using MTT assay. Percent cell viability was calculated with respect to the untreated control cells
Conclusions
In contrast to the conventional methods that have been used so far for the quantification of Hg2+ ions in different biological samples, genetically encoded MerFS is cheap, offers limited toxicity, and is highly selective and sensitive. This sensor can monitor the toxic levels of Hg2+ ions at low concentrations at in vitro level and in cellular systems non-invasively. The constructed nanosensor responded to the changing levels of Hg2+ ions specifically. Affinity mutant sensors developed have altered binding constants (K d) and varying dynamic ranges of Hg2+ detection at the in vitro level. Live cell imaging of the bacterial cells showed successful expression of the sensor MerFS-51. Owing to the bioaccumulation of methylmercury in fishes and shellfishes living in the marine environment, MerFS-51 can be an important ecological toolkit to monitor Hg2+ levels in bacteria and will aid in studying the transformation of Hg2+ into methylmercury. Moreover, after successful monitoring of Hg2+ levels in S. cerevisiae and HEK-293T cells, it is concluded that the developed nanosensor MerFS-51 can be a suitable tool to measure levels of Hg2+ ions in different eukaryotic single living cells to monitor the flux rate of Hg2+ in them, hence establishing the sensor’s efficacy in both prokaryotic and eukaryotic systems. These measurements can be achieved with efficient spatiotemporal resolution and in real time. It is demonstrated with mercury, that a set of constructs could be obtained with heterogeneous affinity and ample FRET dynamics for cell-based applications.
Acknowledgements
The first author (NS) is thankful to University Grants Commission for Senior Research Fellowship. Financial Assistant in the form of research grant under nanobiotechnology scheme (No. BT/PR22248/NNT/28/1272/2017) from Department of Biotechnology, Govt. of India for conducting this research work is gratefully acknowledged.
Author contributions
NS and MM designed the study and prepared the original manuscript. NS and MM conducted all in vitro and cellular experiments and analyzed the data. NS and MM did the live cell imaging of yeast and HEK cells and analyzed the data. AQ performed the cytotoxicity test. NS, MM and MAJ revised the manuscript. All authors were engaged in commenting on the manuscript. All authors read and approved the final manuscript.
Compliance with ethical standards
Conflict of interest
The authors declare that they have no conflict of interest.
References
Publisher's Note
Springer Nature remains neutral with regard to jurisdictional claims in published maps and institutional affiliations.
