


 https://orcid.org/0009-0006-0734-0667

Abstract
Background
Where surveillance data are limited, nationally representative electronic health records allow for geographic, temporal, and demographic characterization of the fungal diseases blastomycosis and histoplasmosis.
Methods
We identified incident blastomycosis and histoplasmosis cases from 2013 to 2023 within Oracle EHR Real-World Data, which comprises 1.6 billion healthcare encounters nationally. To characterize spatiotemporal incidence trends, we used generalized estimating equations weighted for nonrepresentativeness of electronic health record–reporting facilities. We computed standardized incidence rate ratios (sIRRs), which relay relative differences in standardized incidence rates between regions, race/ethnicity, gender, and age subgroups and the national population.
Results
National incidence rates in 2023 were 2.4 (95% confidence interval [CI]: 1.6–3.5) and 1.9 times (95% CI: 1.6–2.2) rates in 2013, for blastomycosis and histoplasmosis, respectively. Blastomycosis incidence rates among Hispanic or Latino and non-Hispanic Black individuals were 60% (sIRR: 1.6 [95% CI: 1.0–2.4]) and 30% (sIRR: 1.3 [95% CI: 1.0–1.6]) higher than the standardized national incidence rate. Histoplasmosis incidence rates were elevated among non-Hispanic White patients (sIRR: 1.05 [95% CI: 1.02–1.08]). Standardized incidence rates of both diseases were higher among older and male patients, were consistently elevated in the Upper Midwest and Ohio Valley regions, and increased greatly in the Northern Rockies and Plains from 2013 to 2023. We estimated high incidence in states (blastomycosis: Illinois, Kentucky, and West Virginia; histoplasmosis: Missouri, Iowa, and Oklahoma) that do not report to surveillance.
Conclusions
This analysis revealed increasing incidence rates of blastomycosis and histoplasmosis, with increasing diagnoses outside of historically endemic regions, and notable differences in incidence by race/ethnicity, gender, and age.
Blastomycosis and histoplasmosis are fungal diseases caused by infection with dimorphic fungal pathogens that live in the environment [1, 2]. Case reports of blastomycosis and histoplasmosis indicate a shift outside of their historical geographic endemic range [3–5], potentially due to migration from or travel to endemic areas [6], changes in environmental and climate conditions, and increased host susceptibility due to increasing use of immunosuppressive medication [7–9]. As of 2025, in the United States, blastomycosis is reportable in 8 states and histoplasmosis is reportable in 15 states (Supplementary Figure 1, Supplementary Table 1) [10], limiting our understandings of their geographic range. Additionally, national surveillance datasets lack complete demographic information, which has limited our understanding of differences in incidence by gender, race, and ethnicity [2, 11].
Blastomycosis is caused by inhalation of Blastomyces dermatitidis, Blastomyces gilchristii, and recently discovered Blastomyces helicus, which occupy moist, acidic soil and rotting wood [12, 13]. In the United States, Blastomyces spp. are considered endemic in the Great Lakes region, the Mississippi and Ohio River valleys, and along the St. Lawrence River in New York and Canada, with B. helicus in the Western United States and Canada [12, 13]. Histoplasmosis, caused by inhalation of spores of Histoplasma capsulatum found in soil, is endemic in the Mississippi and Ohio River valleys, although its distribution is likely national [14, 15]. Most blastomycosis and histoplamosis infections are sporadically acquired from environmental exposures [14]; point-source outbreaks have been linked to soil excavation [16], yard waste [17], paper milling [18], outdoor recreation [19], and, for histoplasmosis, disturbance of bird or bat droppings [1]. Blastomycosis and histoplasmosis are often underdiagnosed due to limitations in diagnostics [20], varying degrees of diagnostic suspicion, nonspecific clinical presentation, and being mistaken for community-acquired pneumonia with bacterial etiology [21–24].
Public health leaders have called for epidemiologic studies to understand the distribution and geographic range of blastomycosis and histoplasmosis and have advised using longitudinal electronic health record (EHR) data to complement public health surveillance systems [9, 25]. Preliminary assessments using EHR data have advanced our understanding of fungal disease distribution in the United States but have been limited to local health systems or inpatient populations [26, 27]. Here, we leveraged data from Oracle EHR Real-World Data (OERWD)—an EHR database with national coverage—to conduct a retrospective cohort study examining the geographic and temporal distribution of blastomycosis and histoplasmosis incidence in the United States from 2013 to 2023, and to quantify differences in incidence rates by race and ethnicity, gender, and age.
METHODS
Data Source
OERWD comprises de-identified electronic medical records of health systems that have a data use agreement with Oracle, in compliance with Health Insurance Portability and Accountability Act requirements. OERWD contains encounter information for over 109 million unique patients and over 1.6 billion healthcare encounters over 2 decades nationally. Encounters may include pharmacy, laboratory, admission, and billing information, which are date and time stamped.
Ethics
De-identified fungal disease data derived from OERWD were provided through a Data Transfer and Use Agreement with Children's Mercy Hospital, Kansas City, Missouri. The Children's Mercy Office of Research Integrity deems work with OERWD to be nonhuman subject research.
Case Definition and Estimation of Person-Time At-Risk
Patients with at least 1 healthcare encounter between 1 January 2013 and 31 December 2023 were eligible for inclusion; patients missing discharge dates and state of residence were excluded. Patients were categorized into US census racial and ethnic categories using self-reported race and ethnicity provided by Oracle (see Supplementary Methods) [28], 5-year age groups using birthdate and encounter date, and National Oceanic and Atmospheric Association climate regions using state location (excluding Alaska and Hawaii) [29]. We identified incident case-patients using their initial encounter with an International Classification of Diseases (ICD) 9th or 10th revision code for blastomycosis (ICD-9: 116.0; ICD-10: B40*) or histoplasmosis (ICD-9: 115*; ICD-10: B39*) in any position of the record; case-patients whose first diagnosis occurred before 2013 were excluded. Patients contributed person-time (ie, time at risk for disease) for years in which they had at least 1 healthcare encounter with any recorded diagnosis code. We used poststratification weights to adjust for differences in age, gender, race and ethnicity, state, and year between our sample and the US population resulting from nonrepresentativeness of facilities reporting to OERWD (see Supplementary Methods).
Geographic and Temporal Distribution of Blastomycosis and Histoplasmosis Incidence
We calculated annual incidence rates within climate regions by fitting region-specific generalized estimating equation (GEE) Poisson regression models with poststratification weights to case data, with fixed effects on year as a categorical variable (y), and an offset for the log of weighted patient-years (p-y), as . To examine how incidence rates changed within states over time, we stratified the data by 4 time periods (2013–2015, 2016–2018, 2019–2021, and 2023–2023) and fit period-specific weighted GEE Poisson models with fixed effects for state (s), as . To estimate state-, age-, gender-, and race and ethnicity-adjusted incidence rate ratios (aIRRs) reflecting the change in incidence rates over time for the overall United States, we used weighted GEE Poisson models, as , where X represents a matrix of covariates including fixed effects for year, state, age group, gender, and racial and ethnic group.
We used direct standardization to compute incidence rates that would have been observed in each region if the distribution of age, gender, and race and ethnicity matched the US population (our reference population; see Supplementary Methods), enabling comparison of incidence rates across regions. Standardized incidence rates (sIRs) by age group, racial and ethnic group, and gender were also calculated using direct standardization (see Supplemental Methods). We generated 1000 cluster bootstrapped datasets from the original dataset stratified by state-month clusters, and calculated 95% confidence intervals (CIs) as the 2.5th and 97.5th percentiles of the distribution using the R boot package [30].
Differences in Incidence by Geography and Demographics
To evaluate whether regions, age groups, racial and ethnic groups, and genders had disproportionately high blastomycosis or histoplasmosis sIRs, we computed overall and year-specific standardized incidence rate ratios (sIRRs) comparing the group-specific sIR to the sIR in the standard (national) population (see Supplementary Methods). An sIRR >1 indicates a region or group had a higher incidence rate than the national sIR, accounting for varying distributions of demographic characteristics in the population; an sIRR <1 indicates a lower incidence rate than the national sIR.
Estimating differences using sIRRs rather than IRRs from regression models allows us to compare group-specific incidence rates to the national average rather than selecting 1 group to serve as the reference. In the case of racial differences, for instance, this allows us to de-center 1 socially constructed racial and ethnic group as the reference population [31]. All analyses were completed in R (version 4.4.1), using geepack for GEE Poisson regressions [32].
RESULTS
Study Population
Our cohort included 8313 histoplasmosis case-patients, 1424 blastomycosis case-patients, and 168 316 366 p-y from 2013 to 2023, after excluding 19 blastomycosis cases, 57 histoplasmosis cases, and 3 274 376 p-y with missing state location (Table 1). Female patients contributed more overall p-y (55.9%) and slightly more histoplasmosis case-patients (51.7%), while the majority of blastomycosis case-patients were male (69.3%; Table 1). The majority of case-patients were non-Hispanic (NH) White (blastomycosis: 73.0%; histoplasmosis: 84.1%). NH White individuals also contributed the most p-y (62.8%). Patients aged 55 years and older made up the majority of case-patients (blastomycosis: 62.1%; histoplasmosis: 58.8%), and most case-patients resided in the Ohio Valley (blastomycosis: 40.5%; histoplasmosis: 52.7%; Table 1).
Number and Proportion of Blastomycosis and Histoplasmosis Cases and Total Oracle Cerner Real-World Data (OERWD) Patient-years, by Patient Characteristics—United States, 2013–2023
| Characteristic | Blastomycosis N (%) | Histoplasmosis N (%) | OERWD Patient-Years N (%) |
|---|---|---|---|
| N | 1422 (100.0) | 8313 (100.0) | 168 316 366 (100.0) |
| Gender | |||
| Female | 437 (30.7) | 4295 (51.7) | 94 024 336 (55.9) |
| Male | 985 (69.3) | 4018 (48.3) | 74 223 588 (44.1) |
| Age Group | |||
| Under 5 | 10 (0.7) | 45 (0.5) | 15 257 181 (9.1) |
| 5 to 9 | 26 (1.8) | 97 (1.2) | 10 832 218 (6.4) |
| 10 to 14 | 26 (1.8) | 157 (1.9) | 10 309 671 (6.1) |
| 15 to 19 | 54 (3.8) | 312 (3.8) | 10 876 186 (6.5) |
| 20 to 24 | 30 (2.1) | 193 (2.3) | 9 225 530 (5.5) |
| 25 to 29 | 45 (3.2) | 230 (2.8) | 8 933 086 (5.3) |
| 30 to 34 | 63 (4.4) | 315 (3.8) | 9 232 681 (5.5) |
| 35 to 39 | 53 (3.7) | 387 (3.8) | 8 890 755 (5.3) |
| 40 to 44 | 62 (4.4) | 448 (5.4) | 8 737 494 (5.2) |
| 45 to 49 | 82 (5.8) | 576 (6.9) | 8 983 560 (5.3) |
| 50 to 54 | 89 (6.3) | 665 (8.0) | 10 081 815 (6) |
| 55 to 59 | 129 (9.1) | 793 (9.5) | 10 893 956 (6.5) |
| 60 to 64 | 156 (11.0) | 897 (10.8) | 11 051 869 (6.6) |
| 65 and over | 597 (42.0) | 3198 (38.5) | 35 001 125 (20.8) |
| Race and Ethnicitya | |||
| Hispanic or Latino | 154 (11.1) | 513 (6.3) | 28 720 842 (17.7) |
| NH AI/AN | 10 (0.7) | 15 (0.2) | 1 240 457 (0.8) |
| NH Asian | 42 (3.0) | 86 (1.1) | 4 335 822 (2.7) |
| NH Black or African American | 136 (9.8) | 529 (6.5) | 17 696 116 (10.9) |
| NH Other Race | 32 (2.3) | 150 (1.8) | 8 469 405 (5.2) |
| NH White | 1010 (73.0) | 6864 (84.1) | 102 202 122 (62.8) |
| Climate Regionb | |||
| Northeast | 173 (12.2) | 582 (7.0) | 41 308 306 (24.6) |
| Northern Rockies and Plains | 35 (2.5) | 561 (6.8) | 6 199 851 (3.7) |
| Northwest | 10 (0.7) | 38 (0.5) | 2 383 155 (1.4) |
| Ohio Valley | 574 (40.5) | 4380 (52.7) | 35686 542 (21.3) |
| South | 48 (3.4) | 780 (9.4) | 11430 832 (6.8) |
| Southeast | 54 (3.8) | 352 (4.2) | 21 656 428 (12.9) |
| Southwest | 51 (3.6) | 407 (4.9) | 18 312 052 (10.9) |
| Upper Midwest | 261 (18.3) | 778 (9.4) | 7 329 988 (4.4) |
| West | 213 (15.0) | 432 (5.2) | 23 431 004 (14) |
Abbreviations: NH = non-Hispanic, AI/AN = American Indian or Alaska Native.
aRace and ethnicity were unknown for 38 patients (2.7%) with a blastomycosis diagnosis, 156 patients (1.9%) with a histoplasmosis diagnosis, and 6 892 059 OERWD p-y (4.1%).
bClimate regions do not include Alaska and Hawaii. 3 patients (0.2%) with a blastomycosis diagnosis were diagnosed in Alaska and Hawaii, 3 patients (0.03%) with a histoplasmosis diagnosis were diagnosed in Alaska or Hawaii; and 578 208 OERWD p-y were located in Alaska or Hawaii (0.3%).
Spatiotemporal Trends in Incidence
Blastomycosis
The national incidence rate of blastomycosis per 100 000 p-y increased between 2013 and 2023 from 0.4 cases per 100 000 p-y (95% CI: 0.3–0.6) to 1.3 per 100 000 p-y (95% CI: 1.1–1.6; Figure 1, Supplementary Table 3). The adjusted blastomycosis incidence rate in 2023 was 2.4 times (95% CI: 1.6–3.5) the rate in 2013 (Figure 2). Blastomycosis incidence increased in all regions over the study period (Supplementary Tables 2 and 3), with the most profound increases in the Upper Midwest (0.5 cases per 100 000 p-y in 2013 to 6.8 cases per 100 000 p-y in 2023; Figure 1). Most states maintained incidence rates between 0 and 2.0 cases per 100 000 p-y from 2013 to 2023. However, incidence rates exceeded 4.0 cases per 100 000 p-y in 2022–2023 in some states in the Upper Midwest (eg, Wisconsin: 9.9; Michigan: 6.2), the Ohio Valley (eg, Illinois: 4.1; West Virginia: 4.9), and the South (eg, Arkansas: 10.7) (Figure 1, Supplementary Table 2).
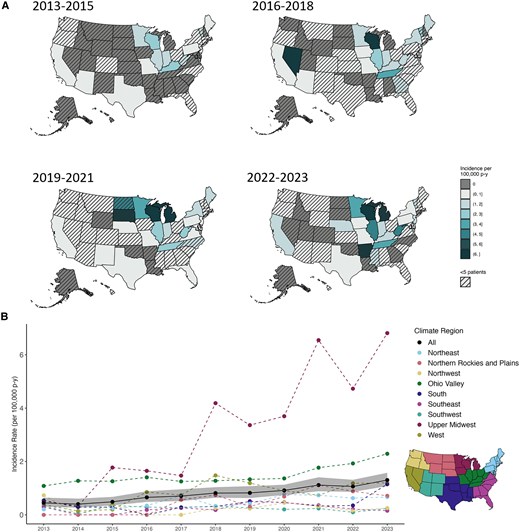
Incidence rate of blastomycosis per 100 000 patient-years by state and climate region, 2013–2023. A, Incidence rates of blastomycosis by state and period: 2013–2015, 2016–2018, 2019–2021, and 2022–2023. Hatches indicate states that had fewer than 5 blastomycosis cases during the time period. B, Incidence rate of blastomycosis per 100 000 patient-years by year and climate region (colored, dashed lines and points). Black points show the national annual incidence rate estimate, and the gray ribbon indicates the 95% CI. Inset map shows climate regions, which do not include Alaska or Hawaii. See Supplementary Tables 2 and 3.
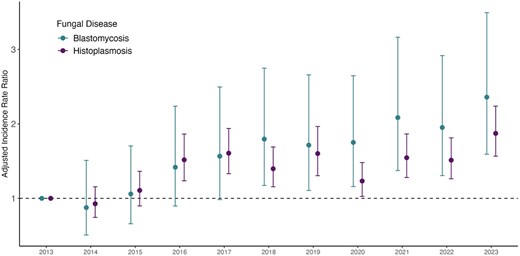
Annual adjusted incidence rate ratios (aIRRs) for blastomycosis and histoplasmosis in the United States, 2013–2023. Annual aIRRs for blastomycosis and histoplasmosis in the United States are compared with the reference year, 2013. Points indicate effect estimates and vertical bars show 95% CIs. aIRRs are adjusted for state, gender, race and ethnicity, and age group.
During the study period (2013–2023), the sIRs in the Upper Midwest and Ohio Valley were 5.1 and 2.0 times that of the national patient population (sIRR: Upper Midwest: 5.1 [95% CI: 3.7–6.8]; Ohio Valley: 2.0 [95% CI: 1.7–2.3]; Figure 3A; Supplementary Table 3). The highest increases in sIR occurred in the Upper Midwest, from 0.4 cases per 100 000 p-y (95% CI: 0.0–0.9) in 2013 to 8.2 cases per 100 000 p-y (95% CI: 5.1–11.9) in 2023. In the Northern Rockies and Plains, the sIR increased from 0.4 cases per 100 000 p-y (95% CI: 0.0–0.9) in 2017 to 1.7 cases per 100 000 p-y (95% CI: 0.1–4.3) at the peak in 2022. The Southeast, South, Northeast, Southwest, and Northwest regions had sIRs lower than the national average during the study period (sIRR: Southeast: 0.3 [95% CI: 0.2–0.4]; South: 0.5 [95% CI: 0.4–0.7]; Northeast: 0.6 [95% CI: 0.5–0.8]; Southwest: 0.3 [95% CI: 0.2–0.4]; Northwest: 0.2 [95% CI: 0.1–0.4]; Figure 3A; Supplementary Table 3).
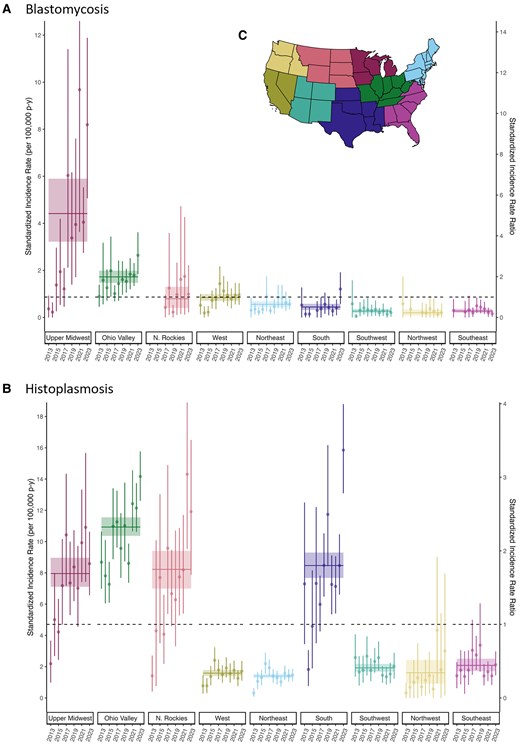
Standardized incidence rates and standardized incidence rate ratios (sIRRs) of blastomycosis and histoplasmosis per 100 000 patient-years by climate region and year, United States, 2013–2023. A, Standardized incidence rate (sIR, left y-axis) and sIRR (right y-axis) of (A) blastomycosis and (B) histoplasmosis per 100 000 patient-years by climate region, 2013–2023. sIRs are direct standardized to the US national population by gender, race and ethnicity, and age group. Points represent the sIR and sIRR for each year and vertical bars represent 95% CIs. The horizontal lines represent the sIR and sIRR for each climate region for the entire study period, and the colored boxes represent the 95% CIs for the entire study period. The dashed horizontal line shows the null sIRR of 1. N. Rockies = Northern Rockies and Plains. C, A map of climate regions in the United States. Climate regions do not include Alaska and Hawaii. See Supplementary Table 4.
Histoplasmosis
National histoplasmosis incidence increased from 2.9 cases per 100 000 p-y in 2013 (95% CI: 2.4–3.5) to 6.5 cases per 100 000 p-y in 2023 (95% CI: 5.7–7.5; Figure 4B). The adjusted incidence rate in 2023 was 1.9 times that in 2013 (95% CI: 1.6–2.2; Figure 2; Supplementary Table 3). Incidence rates in most regions increased slightly over the study period, with the highest rates in most years in the Ohio Valley (Figure 4B, Supplementary Table 3). Incidence rates increased each year in the Upper Midwest between 2013 and 2017 (2.8 cases per 100 000 p-y in 2013 to 11.8 cases per 100 000 p-y in 2017), and remained steady thereafter. Incidence rates in the Northern Rockies and Plains and the South surpassed the Upper Midwest in 2023 (Northern Rockies and Plains: 11.0 cases per 100 000 p-y; South: 13.3 per 100 000 p-y; Upper Midwest: 10.4 per 100 000 p-y). By 2022–2023, incidence rates increased to above 20 cases per 100 000 p-y in Indiana (21.0), Iowa (20.7), Kansas (28.6), and Nebraska (22.4), reflecting the increasing incidence in the Northern Rockies and Plains and South after 2017 (Figure 4A, Supplementary Table 3).
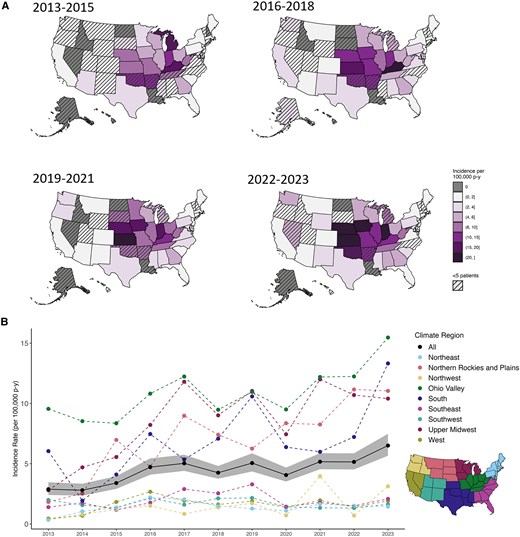
Incidence rate of histoplamosis per 100 000 patient-years by state and climate region, United States, 2013–2023. A, Incidence rate by state of histoplasmosis by period: 2013–2015, 2016–2018, 2019–2021, and 2022–2023. Hatches indicate states that had fewer than 5 histoplasmosis cases during the time period. B, Incidence rate of histoplasmosis per 100 000 patient-years by year and climate region (colored, dashed lines and points). Black points show national annual incidence rate estimate, and the gray ribbon shows 95% CI. Inset map shows climate regions, which do not include Alaska or Hawaii. See Supplementary Tables 2 and 3.
The Upper Midwest and Ohio Valley had the highest mean sIRs from 2013 to 2023 (sIR: Upper Midwest: 8.0 cases per 100 000 p-y [95% CI: 7.1–9.0]; Ohio Valley: 10.9 cases per 100 000 p-y [95% CI: 10.4–11.6]). The Northern Rockies and Plains sIR increased the most over the study period, from 1.4 cases per 100 000 p-y (95% CI: 0.4–2.7) in 2013 to the peak in 2022 of 14.3 cases per 100 000 p-y (95% CI: 9.5–20.0) (Figure 4B, Supplementary Table 4). The Upper Midwest, Ohio Valley, Northern Rockies and Plains, and South all had disproportionately high sIRs compared with the national sIR (sIRR: Upper Midwest: 1.7 [95% CI: 1.5–1.9]; Ohio Valley: 2.3 [95% CI: 2.2–2.5]; Northern Rockies and Plains: 1.7 [95% CI: 1.5–2.0]; South: 1.8 [95% CI: 1.6–2.0]; Figure 3B; Supplementary Table 4).
Patient Characteristics
The sIR of blastomycosis increased for each successive age group, from 0.1 cases per 100 000 p-y (95% CI: 0.0–0.1) among patients under 5 years to 1.9 cases per 100 000 p-y (95% CI: 1.7–2.1) for patients aged 65 and over (Figure 5A; Supplementary Table 5). Patients older than 55 had higher blastomycosis sIRs compared with the national sIR for the study period (sIRR: 55–59: 1.6 [95% CI: 1.2–2.0]; 60–64: 1.8 [95% CI: 1.5–2.1]; 65+ (2.2 [95% CI: 1.9–2.4]). The sIRs for histoplasmosis also increased from 0.3 cases per 100 000 p-y (95% CI: 0.2–0.4) in patients under 5 to 8.4 cases per 100 000 p-y (95% CI: 7.9–8.9) among patients aged 65 and over. Patients older than 45 had disproportionately high histoplasmosis incidence compared with the national sIR (sIRR > 1) (Figure 5B; Supplementary Table 5).
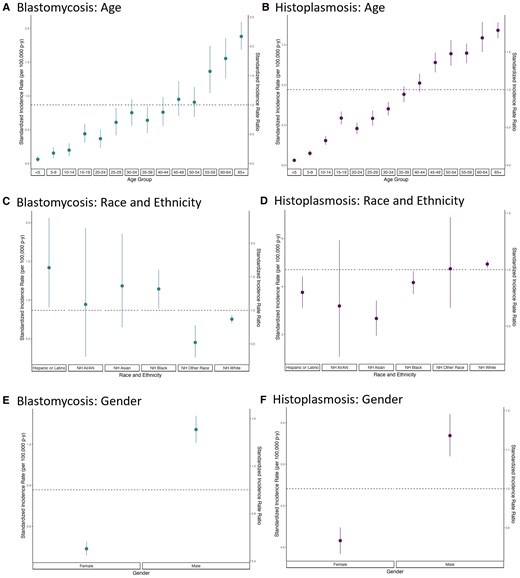
Standardized incidence rate and standardized incidence rate ratio (sIRR) of blastomycosis and histoplasmosis per 100 000 patient-years by age group, race and ethnicity, and gender, United States, 2013–2023. Standardized incidence rate (sIR, left y-axis) and sIRR (right y-axis) of blastomycosis (A, C, E) and histoplasmosis (B, D, F) per 100 000 patient-years by age group (A, B), race and ethnicity (C, D), and gender (E, F) 2013–2023. sIRs are direct standardized to the US national population for gender, race and ethnicity, and state (A, B); gender, state, and age group (C, D); and state, race and ethnicity, and age group (E, F). Points represent the sIR and sIRR for each patient characteristic group compared with the United States population, vertical lines represent 95% CIs. The dashed line shows the US sIR for the total population and the null sIRR of 1. NH = non-Hispanic; AI/AN = American Indian or Alaska Native; NH Black = non-Hispanic Black or African American. See Supplementary Table 5.
Hispanic or Latino patients and NH Black or African American patients had 60% and 30% higher sIRs of blastomycosis, respectively, over the study period compared with the national sIR (sIRR: Hispanic or Latino: 1.6 [95% CI: 1.0–2.4]; NH Black or African American: 1.3 [95% CI: 1.0–1.6]; Figure 5C; Supplementary Table 5). NH AI/AN and NH Asian individuals also experienced elevated blastomycosis incidence rates compared with the national rate, although not significantly so, and the sample size was very small (sIRR: NH AI/AN: 1.1 [95% CI: 0.3–2.2]; NH Asian: 1.4 [95% CI: 0.7–2.1]). The only racial and ethnic group to experience a disproportionately high histoplasmosis incidence compared with their national representation was NH White (sIRR: 1.05 [95% CI: 1.02–1.08]; Figure 5D; Supplementary Table 5). Hispanic and Latino, NH Asian, and NH Black or African American patients had disproportionately low histoplasmosis incidence rates during the study period (sIRR: Hispanic or Latino: 0.8 [95% CI: 0.7–0.9]; NH Asian: 0.6 [95% CI: 0.4–0.7]; NH Black or African American: 0.9 [95% CI: 0.8–1.0]; Figure 5D).
Male patients had 50% higher blastomycosis and 10% higher histoplasmosis sIRs than the national sIR (sIRR: blastomycosis: 1.5 [95% CI: 1.4–1.6], histoplasmosis: 1.1 [95% CI: 1.1–1.2]; Figure 5E and 5F; Supplementary Table 5). The sIR of blastomycosis for male patients (1.3 cases per 100 000 p-y [95% CI: 1.2–1.4]) was more than 3 times that of female patients (0.4 cases per 100 000 p-y [95% CI: 0.4–0.5]). The histoplasmosis sIR among male patients was also greater than for female patients (sIR: male: 5.3 cases per 100 000 p-y [95% CI: 5.1–5.6]; female: 4.1 cases per 100 000 p-y [95% CI: 3.9–4.2]).
DISCUSSION
This retrospective cohort study using EHR data from 2013 to 2023 in the United States provides updated, nationally representative evidence that blastomycosis and histoplasmosis have been increasingly diagnosed beyond historical endemic regions. Blastomycosis and histoplasmosis incidence rates have increased in the United States overall: national blastomycosis incidence increased 2.4 times from 2013 to 2023, from 0.4 to 1.3 cases per 100 000 p-y, and histoplasmosis incidence increased 1.9 times from 2013 to 2023, from 2.9 to 6.5 cases per 100 000 p-y.
We found that blastomycosis and histoplasmosis diagnoses occurred beyond the Mississippi and Ohio River valleys [15, 23], similar to analyses of Medicare and private insurance claims data that also document diagnoses of both diseases for patients residing outside of these historical endemic regions [23, 33, 34]. While the Upper Midwest and Ohio Valley had the highest sIRs for histoplasmosis and blastomycosis from 2013 to 2023, the Northern Rockies and Plains and the South also had disproportionately high sIRs of histoplasmosis from 2013 to 2023, with high histoplasmosis incidence in Kansas and Nebraska after 2017. Blastomycosis incidence in the Northern Rockies and Plains also increased steadily throughout the study period. Low, stable incidence rates of blastomycosis in western states (eg, California, Idaho, and Utah) imply limited influence of the newly identified species, B. helicus [13]. Potential changes in the geographic distributions of these pathogens contributing to diagnoses outside endemic regions remain to be thoroughly investigated.
Our results generally align with surveillance trends, albeit with some variation. Surveillance data from states that report blastomycosis and histoplasmosis demonstrate increasing trends in incidence. Statewide incidence of blastomycosis in Minnesota in 2019 was twice the 1999–2019 median incidence rate [35]. In Wisconsin, blastomycosis incidence rates rose between 1985 and 2010 [36], fluctuating between 2007 and 2017 [2]. Blastomycosis incidence rates in Louisiana, Michigan, and Arkansas were roughly stable between 2007 and 2017 [2], although case counts in Michigan increased steadily between 2015 and 2022 [37], with a large outbreak in 2023 [18, 38]. In 4 of the 5 states reporting blastomycosis at the time of analysis (Michigan, Minnesota, Wisconsin, and Arkansas; Supplementary Table 1), the incidence rates estimated using EHR data were higher than those estimated from surveillance data [2]. Overestimation of incidence relative to surveillance data is not unexpected, as patients in our study only contributed person-time during healthcare encounters, whereas every resident in the state contributes person-time to surveillance denominators.
Histoplasmosis surveillance data from 12 reporting states show stable incidence from 2011 to 2014 [39], with higher incidence rates in 2019 in Arkansas, Illinois, and Michigan compared with 2014 [40]. From 2019 to 2021, histoplasmosis incidence rates across reporting states increased slightly from 1.6 to 2.0 cases per 100 000 p-y [11]. Although surveillance data suggest that Minnesota had the highest histoplasmosis incidence rates among reporting states from 2011 to 2014, we found higher histoplasmosis incidence in reporting states, including Arkansas, Michigan, Kansas, Kentucky, Illinois, Indiana, and Nebraska, during the early part of the study period [39].
Our study sheds important light on the epidemiology of blastomycosis and histoplasmosis within states that do not report to surveillance. We found consistently high blastomycosis incidence throughout the study period in nonreporting states like Illinois, Kentucky, and West Virginia, and sporadically high incidence in Nevada and South Dakota, which may indicate outbreaks or cases related to travel or migration. We also found some of the higher incidence rates of histoplasmosis in the nonreporting states of Missouri, Iowa, and Oklahoma. States with high incidence rates that do not currently report blastomycosis and histoplasmosis should consider making them reportable to improve understandings of their epidemiology.
Our study provides further evidence of incidence differences by racial and ethnic group, age group, and gender. We found that NH AI/AN, NH Asian, Hispanic or Latino patients, and NH Black or African American patients had higher sIRs of blastomycosis between 2013 and 2023. This aligns with surveillance data suggesting higher blastomycosis incidence rates among NH AI/AN and NH Asian populations [11], as well as documented outbreaks of blastomycosis among Indigenous and NH Asian populations in Wisconsin and Ontario, Canada [3, 41]. Several studies have found differences in clinical presentation, disease severity, and case fatality rates of blastomycosis among minority racial and ethnic patients compared with NH White patients, although understandings of structural and upstream causes remain limited [2, 26, 42]. Analyses of associations between social determinants of health and histoplasmosis incidence have found higher rates in more rural counties and in areas with limited healthcare infrastructure and access [43]. Patients identifying as NH White experienced a disproportionately high sIR of histoplasmosis, while Hispanic and Latino, NH Asian, and NH Black or African American patients had disproportionately low histoplasmosis sIRs during the study period, similar to surveillance studies [11].
Blastomycosis patients aged 55 and older and histoplasmosis patients aged 45 and older had the highest sIRs among age groups. This aligns with surveillance data showing most cases are among older adults [11]. In addition, we found that the sIRs for both diseases were disproportionately higher among male patients, with the sIR of blastomycosis more than 3 times that of female patients. These patterns align with previous surveillance and administrative data findings, which document more cases among male than female patients [2, 11]. Gender differences in blastomycosis incidence are often attributed to gendered exposure pathways (eg, outdoor recreation [19], occupational exposure [18]), shaping the profile of a “typical” blastomycosis patient as a younger man who works or recreates outdoors [44]. Further research is needed to examine the extent to which genderized exposure pathways mediate observed gender differences [44] and to assess potential underdiagnosis among female patients not matching the profile of a “typical” patient.
Future research should examine how factors like bat and bird migration, changes in temperature and precipitation, travel, prevalence of immunosuppression, and diagnostic awareness influence the shifting geographic distributions of these diseases [5, 45]. Additionally, studies should investigate upstream drivers of racial and ethnic and gendered differences in hospitalization, mortality, and disease severity among blastomycosis and histoplasmosis patients.
Limitations
EHR-based analyses are subject to bias due to systematic exclusion of patients who do not seek healthcare at data-contributing facilities; we used poststratification weighting to make our sample more nationally representative and improve generalizability. The composition of data-contributing organizations may differ by state and region, with implications for reported incidence rate estimation. Reported incidence rates likely underestimate true disease burdens due to missed diagnoses.
The study period includes years during which substantial changes to regulatory requirements for reporting and use of EHRs occurred. Early EHR data may have been less complete or accurate, or exhibited other data capture issues that were mitigated as EHR technology and use improved over time. Case definitions relied on ICD codes, which may be only moderately sensitive for fungal disease cases [46]. Incidence relied on the date of the initial encounter with an ICD code, rather than date of exposure or disease onset, and state locations recorded in OERWD refer to the location of patient residence, but do not necessarily correspond to the location of patient exposure. Therefore, geographic estimates of disease burden represent the spatial distribution of fungal patient residence rather than fungal exposures. Misclassification for cases who acquired infection during out-of-state travel or received a diagnosis later in life for an earlier asymptomatic infection after migrating out of state is possible [6, 21].
CONCLUSION
This retrospective cohort study using EHR data presents evidence that blastomycosis and histoplasmosis incidence rates in the United States have doubled from 2013 to 2023. Diagnoses have increased both within and beyond historically endemic regions, with high incidence observed in several states that do not report cases through public health surveillance. These findings highlight opportunities for expanded reporting to improve the epidemiology of these diseases in the United States. Incidence varied by race and ethnicity, age, and gender. Future research should examine potential geographic shifts in disease distributions, as well as differences in outcomes and disease severity across demographic groups.
Supplementary Data
Supplementary materials are available at The Journal of Infectious Diseases online (http://jid.oxfordjournals.org/). Supplementary materials consist of data provided by the author that are published to benefit the reader. The posted materials are not copyedited. The contents of all supplementary data are the sole responsibility of the authors. Questions or messages regarding errors should be addressed to the author.
Notes
Acknowledgments. Data not publicly available. J. G. E. B. and J. R. H. jointly conceptualized the research study, outlining the main objectives and hypotheses. N. J. K., R. M. R., A. L., and J. G. E. B. executed data processing, ensuring adherence to ethical standards and study protocols. J. G. E. B. led statistical analysis, with support and substantial contributions from S. K. C., T. T. S., J. R. H., and B.L.M.B. J. G. E. B. and J. R. H. carried out interpretation of study findings. J. G. E. B. wrote the original draft of the final manuscript, and all authors provided feedback. M. H., T. C. W., and J. V. R. provided guidance, access to the data, and supervision. J. R. H. made the final decision to submit for publication.
Financial support. This work was supported by the National Institute of Allergy and Infectious Diseases (NIAID) of the National Institutes of Health (R01 AI148336, R01 AI176770, K01 AI173529), and the National Institute for Occupational Safety and Health/Centers for Disease Control and Prevention Training Grant [T42 OH008429]. The content is solely the responsibility of the authors and does not necessarily represent the official views of the National Institutes of Health (NIH), the National Institute for Occupational Safety and Health (NIOSH), or the Centers for Disease Control and Prevention (CDC).
References
Author notes
Potential conflicts of interest. The authors: No reported conflicts of interest.


