


 https://orcid.org/0000-0002-2965-9269

Abstract
Background
Patients with recalcitrant enterococcal bloodstream infections are at greater risk of adverse outcomes. We identified patients in the 2016–2022 Vancomycin-Resistant Enterococcal Bacteremia Outcomes Study (VENOUS) cohort experiencing recalcitrant bloodstream infections for further clinical and genomic characterization.
Methods
Bacteremia episodes were considered persistent if there was a lack of clearance on day 4 while receiving ≥ 48 hours of active therapy and recurrent if there was clearance during hospitalization with a subsequent positive culture (collectively, recalcitrant bacteremia). A matched comparison group of nonrecalcitrant bacteremia patients was chosen in a 2:1 control to case ratio. Isolates were subjected to short- and long-read whole-genome sequencing. Hybrid assemblies were created using a custom pipeline.
Results
A total of 46 recalcitrant infections from 41 patients were identified. Patients with persistent bacteremia were more often admitted to the intensive care unit upon admission relative to controls. Enterococcus faecalis strains causing persistent infections had a significantly higher proportion of genes associated with carbohydrate utilization relative to controls. Representation of functional groups associated with mutated genes was disparate between Enterococcus faecium and E. faecalis index and persistent isolates, suggesting species-specific adaptation.
Discussion
Enterococcal isolates causing recalcitrant bacteremia were genomically diverse, indicating that strain-specific signatures are not drivers of persistence. However, comparisons of index versus persistent isolates revealed that E. faecium may be genetically preadapted to cause persistent infection, and site-specific structural variation during infection suggests the role of differential gene expression in adaptation and persistence. These data lay groundwork for future studies to define signatures of enterococcal adaptation during bacteremia.
Persistent enterococcal bacteremia is common in clinical practice, despite the administration of seemingly appropriate antienterococcal antibiotic therapy [1]. Importantly, recent studies have shown that failure to clear enterococcal bloodstream infection (BSI) is associated with a higher in-hospital mortality [2, 3].
Persistent enterococcal bacteremia has been attributed to “translocation” from the gastrointestinal tract, particularly in patients with cancer and neutropenia and those subjected to liver transplants [4]. Additionally, persistent positive blood cultures with enterococci are often associated with infected vascular devices or endovascular infections with no source control [5]. Once in the bloodstream, these organisms are subjected to niche-specific selective pressures, which may select for hardier and more adaptable strains that allow for persistence in this new niche [6].
Studies that comprehensively describe the population genomics and clinical factors associated with persistent enterococcal bacteremia are scarce and are generally limited to small case studies of patients at a single institution. Here, we aimed to comprehensively characterize persistent and recurrent enterococcal bacteremia in a multicenter cohort (Vancomycin-Resistant Enterococcal BSI Outcomes Study; VENOUS).
METHODS
Source Population and Eligibility Criteria
VENOUS is a global, prospective, observational study of adults (≥ 18 years of age) admitted to participating institutions from 2016 to 2023 with at least 1 blood culture positive for Enterococcus faecalis or Enterococcus faecium, along with 1 follow-up blood culture taken within 7 days following the initial positive culture. Clearance of bacteremia was defined as 2 consecutive negative cultures, or 1 negative culture and no positive cultures in the following 4 days. Patients were considered as having persistent bacteremia if there was a lack of clearance on day 4 while receiving at least 48 hours of active antienterococcal therapy (previously defined as microbiological failure in VENOUS) [2]. Those with recurrent bacteremia either had clearance of bacteremia during hospitalization, with a second positive culture also during this period, or 2 negative cultures at least 1 day apart, followed by at least 1 positive culture. Persistent and recurrent episodes were collectively referred to as recalcitrant bacteremia. Index isolates and isolates from the positive culture at the time of persistence or recurrence were used for genomic analyses. A comparison cohort of patients with total clearance of bacteremia per clinical documentation was also selected in a 2:1 ratio of nonrecalcitrant to recalcitrant bacteremia (Figure 1). Groups were balanced with respect to hospital of admission, timing of the index positive culture, and enterococcal species (E. faecalis or E. faecium).
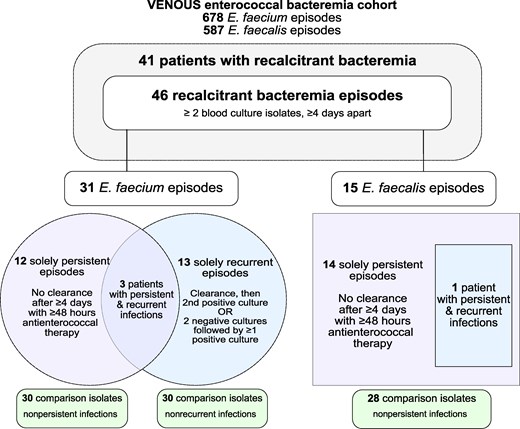
Flow diagram of the study and isolate selection. Identification and selection criteria of recalcitrant bacteremia episodes from the VENOUS source population, along with the number of infections defined as persistent, recurrent, or both for each enterococcal species are depicted.
Clinical Data Collection
Clinical, microbiological, and demographic data were collected from electronic medical records using REDCap (Vanderbilt University). Pitt bacteremia score and Charlson Comorbidity Index were calculated for each patient based on clinical data values [7, 8]. Details on empiric and definitive therapy definitions can be found in the Supplementary Material.
Population Structure and Phylogenetic Analyses
Isolate processing, storage, sequencing, assembly, and genomic analyses are described in the Supplementary Material. The pan-genome of final hybrid assemblies was reconstructed for E. faecium and E. faecalis separately using Roary version 3.11.2 [9]. The core genome alignment file produced from Roary was used as input for separate midpoint-rooted maximum-likelihood phylogenetic tree creation using RAxML version 8.2.12 [10] with 100 bootstrap iterations. Trees were visualized using iTOL [11].
Statistical Analysis of Clinical and Genomic Data
Comparisons between persistent or recurrent bacteremia patients and their respective comparison cohorts, as well as comparisons between persistent infection pairs (the index isolate and the persistent time point isolate collected at day ≥ 4 of bacteremia) were performed separately for E. faecium and E. faecalis using R version 4.1.2 [12]. Details on isolates and specific analyses are included in Supplementary Data 1 and Supplementary Material, while the results of these analyses can be found in Supplementary Data 2. The study was approved by local institutional review boards of participating institutions, which waived the requirement for written or verbal consent from patients based on the observational nature of the study.
RESULTS
Amongst 1265 unique patients with enterococcal bacteremia (678 E. faecium; 587 E. faecalis), we identified 41 patients with recalcitrant bacteremia episodes from 8 study sites (Figure 1 and Figure 2). Of these, there were 29 solely persistent bacteremia episodes, 13 exclusively recurrent bacteremia episodes, and 3 persistent followed by recurrent bacteremia episodes (included in both persistent and recurrent clinical data analyses). The median length of time between index blood culture and persistent culture was 4 days (interquartile range [IQR], 4–5) with a nearly even split between patients with E. faecium and E. faecalis (51.7% and 48.3%, respectively). Recurrent infections had a median time between index and recurrent blood cultures of 26 days (IQR, 7–34 days) and were predominately caused by E. faecium (93.8%) (Table 1 and Table 2). A total of 58 patients without persistent or recurrent bacteremia served as a control group for the persistent bacteremia cohort, and 30 patients were included as controls for the recurrent bacteremia cohort. Of note, matching by institution for 1 study site was not possible due to lower patient enrollment at the time of analysis.
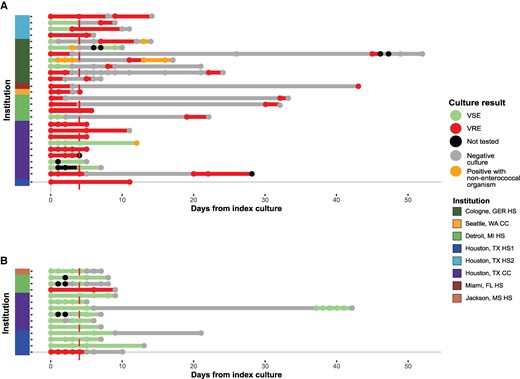
Timeline of recalcitrant bacteremia episodes relative to date of hospital admission: (A) Enterococcus faecium and (B) Enterococcus faecalis. Each horizontal line represents a single patient's hospital course from index culture to the day of the persistent or recurrent culture, and clearance of the bacteremia if documented. The vertical dotted line indicates day 4 following collection of the index blood culture, which is designated as time 0 on this chart. Abbreviations: CC, cancer center; HS, hospital system; VRE, vancomycin-resistant enterococci; VSE, vancomycin-susceptible enterococci.
Clinical Characteristics of Patients With Persistent Enterococcal Bacteremia and Comparison Patients
| Variables | Persistent (n = 29) | Comparison (n = 58) | Total Population (n = 87) | Univariable P Value | GLMM P Value |
|---|---|---|---|---|---|
| Institution | NA, matching factor | ||||
| Seattle, WA CC | 1 (3.4) | 2 (3.4) | 3 (3.4) | ||
| Houston, TX CC | 15 (51.7) | 30 (51.7) | 45 (51.7) | ||
| Detroit, MI HS | 4 (13.8) | 8 (13.8) | 12 (13.8) | ||
| Houston, TX HS 1 | 5 (17.2) | 10 (17.2) | 15 (17.2) | ||
| Houston, TX HS 2 | 3 (10.3) | 6 (10.3) | 9 (10.3) | ||
| Jackson, MS HS | 1 (3.4) | 2 (3.4) | 3 (3.4) | ||
| Demographics | |||||
| Age, y | |||||
| ≤40 | 6 (20.7) | 13 (22.4) | 19 (21.8) | 1 | |
| 41–50 | 2 (6.9) | 5 (8.6) | 7 (8.0) | 1 | |
| 51–60 | 4 (13.8) | 11 (19.0) | 15 (17.2) | .76 | |
| 61–70 | 13 (44.8) | 20 (34.5) | 33 (37.9) | .48 | |
| 71–80 | 4 (13.8) | 9 (15.5) | 13 (14.9) | 1 | |
| Race | |||||
| Asian | 2 (6.9) | 2 (3.4) | 4 (4.6) | .60 | |
| Black or African-American | 3 (10.3) | 13 (22.4) | 16 (18.4) | .28 | |
| Caucasian/White | 21 (72.4) | 37 (63.8) | 58 (66.7) | .57 | |
| Unknown | 3 (10.3) | 6 (10.3) | 9 (10.3) | 1 | |
| Ethnicity | |||||
| Hispanic | 6 (20.7) | 5 (8.6) | 11 (12.6) | .21 | |
| Not Hispanic | 20 (69.0) | 47 (81.0) | 67 (77.0) | .32 | |
| Unknown | 3 (10.3) | 6 (10.3) | 9 (10.3) | 1 | |
| Sex, male | 21 (72.4) | 27 (46.6) | 48 (55.2) | .04 | .48 |
| Current admission | |||||
| Intensive care unit admission | 14 (48.3) | 14 (24.1) | 28 (32.2) | .04 | .70 |
| Reason of admission, medical/nonsurgical | 27 (93.1) | 56 (96.6) | 83 (95.4) | .86 | |
| Length of hospitalization, d, median (range) | 37 (10–354) | 21.5 (3–101) | 25 (3–354) | < .001 | < .001 |
| Medical history | |||||
| Baseline comorbidities | |||||
| Heart/cardiovascular disease | 2 (6.9) | 3 (5.2) | 5 (5.7) | 1 | |
| Diabetes mellitus | 12 (41.1) | 18 (31.0) | 30 (34.5) | .47 | |
| Chronic obstructive pulmonary disease | 3 (10.3) | 7 (12.1) | 10 (11.5) | 1 | |
| Chronic kidney disease | 8 (27.6) | 8 (13.8) | 16 (18.4) | .20 | |
| Liver disease | 4 (13.8) | 6 (10.3) | 10 (11.5) | .91 | |
| Solid malignancy | 8 (27.6) | 13 (22.4) | 21 (24.1) | .79 | |
| Hematological malignancy | 13 (44.8) | 23 (39.7) | 36 (41.4) | .82 | |
| Charlson Comorbidity Index, median (range) | 8 (4–13) | 7 (2–12) | 8 (2–13) | .50 | |
| Solid organ transplant | 3 (10.3) | 1 (1.7) | 4 (4.6) | .21 | |
| Bone marrow transplant | 6 (20.7) | 3 (13.8) | 14 (16.1) | .61 | |
| Immunosuppressive therapy | 20 (69.0) | 32 (55.2) | 52 (59.8) | .25 | |
| Cardiac device and cardiac valve | 4 (13.8) | 4 (6.9) | 8 (9.2) | .43 | |
| Hemodialysis prior to admission | 1 (3.4) | 1 (1.7) | 2 (2.3) | 1 | |
| Previous hospitalization within 365 d | 24 (82.8) | 43 (74.1) | 67 (77.0) | .53 | |
| Resided in nursing home/long-term care facility prior to admission | 0 (0.0) | 3 (5.2) | 3 (3.4) | .55 | |
| At time of index blood culture collection | |||||
| Recent surgical procedure | 4 (13.8) | 6 (10.3) | 10 (11.5) | .76 | |
| High-dose steroid use | 4 (13.8) | 6 (10.3) | 10 (11.5) | .73 | |
| Neutropenia < 500 cells/μL | 11 (37.9) | 22 (37.9) | 33 (37.9) | 1 | |
| Receiving hemodialysis or renal replacement therapy | 6 (20.7) | 6 (10.3) | 12 (13.8) | .32 | |
| Central line placement | 21 (72.4) | 42 (72.4) | 63 (72.4) | 1 | |
| Urinary catheter | 4 (13.8) | 19 (32.8) | 23 (26.4) | .07* | .01 |
| Mechanical ventilation | 6 (20.7) | 15 (25.9) | 21 (24.1) | .79 | |
| Pitt bacteremia score ≥ 2 | 14 (48.3) | 27 (46.6)* | 41 (47.1) | 1 | |
| Index bacteremia episode | |||||
| Positive culture > 2 d of admission | 16 (55.2) | 29 (50.0) | 45 (51.7) | .05* | .06 |
| Polymicrobial BSI | 7 (24.1) | 16 (27.6) | 23 (26.1) | .93 | |
| Enterococcus faecium | 15 (51.7) | 30 (51.7) | 45 (51.7) | NA, matching factor | |
| Enterococcus faecalis | 14 (48.3) | 28 (48.3) | 42 (48.3) | NA, matching factor | |
| Isolate is vancomycin resistant | 13 (44.8) | 20 (34.5) | 33 (37.9) | .48 | |
| Infectious diseases consult | 28 (96.6) | 49 (84.5) | 77 (88.5) | .15 | |
| Endocarditis | 6 (20.7) | 3 (5.2) | 9 (10.3) | .06* | .22 |
| Infection source | |||||
| Central line infection | 5 (17.2) | 8 (13.8) | 13 (14.9) | .75 | |
| Genitourinary | 1 (3.4) | 3 (5.2) | 4 (4.6) | 1 | |
| Abdominal/gastrointestinal | 9 (31.0) | 13 (22.4) | 22 (25.3) | .44 | |
| Endovascular/endocarditis | 4 (13.8) | 2 (3.4) | 6 (6.9) | .09* | .52 |
| Unknown/primary source | 8 (27.6) | 28 (48.3) | 36 (41.4) | .07* | .05 |
| Wound/osteoarticular | 0 (0.0) | 2 (3.4) | 2 (2.3) | .60 | |
| Other | 2 (4.8) | 2 (3.4) | 4 (4.5) | .55 | |
| Clinical outcomes | |||||
| In-hospital mortality | 12 (41.4) | 12 (20.7) | 24 (27.6) | .07* | .03 |
| Definitive antimicrobial therapy | |||||
| E. faecium | |||||
| Monotherapy | |||||
| β-lactams | 8 (27.6) | 8 (13.8) | 16 (18.4) | .65 | |
| Daptomycin | 7 (24.1) | 7 (12.1) | 14 (16.1) | .42 | |
| Vancomycin | 2 (6.9) | 10 (17.2) | 12 (13.8) | 1 | |
| Linezolid | 2 (6.9) | 5 (8.6) | 7 (8.0) | 1 | |
| Tigecycline | 3 (10.3) | 1 (1.7) | 4 (4.6) | .25 | |
| Combination therapy | 1 | ||||
| Dual β-lactams | 3 (10.3) | 7 (12.1) | 10 (11.5) | 1 | |
| Vancomycin plus β−lactams | 0 (0.0) | 4 (6.9) | 4 (4.6) | .54 | |
| Daptomycin plus β−lactams | 5 (17.2) | 11 (19.0) | 16 (18.4) | 1 | |
| Daptomycin plus linezolid | 0 (0.0) | 4 (6.9) | 4 (4.6) | .54 | |
| Othera | 2 (6.9) | 1 (1.7) | 3 (3.4) | .25 | |
| Therapy received was not appropriate | 2 (6.9) | 4 (6.8) | 6 (6.9) | 1 | |
| E. faecalis | |||||
| Monotherapy | |||||
| β-lactams | 7 (50.0) | 4 (14.3) | 11 (26.2) | .04 | |
| Daptomycin | 1 (7.1) | 0 (0.0) | 1 (2.4) | .33 | |
| Vancomycin | 1 (7.1) | 8 (28.6) | 9 (21.4) | .23 | |
| Linezolid | 0 (0.0) | 1 (3.6) | 1 (2.4) | 1 | |
| Tigecycline | 1 (7.1) | 0 (0.0) | 1 (2.4) | .33 | |
| Combination therapy | 1 | ||||
| Dual β-lactams | 3 (21.4) | 7 (25.0) | 10 (23.8) | 1 | |
| Vancomycin plus β−lactams | 0 (0.0) | 2 (7.1) | 2 (4.8) | .54 | |
| Daptomycin plus β−lactams | 1 (7.1) | 3 (10.7) | 4 (9.5) | 1 | |
| Daptomycin plus linezolid | 0 (0.0) | 1 (3.6) | 1 (2.4) | 1 | |
| Therapy received was not Appropriate | 0 (0.0) | 6 (21.4) | 6 (14.3) | .08* | |
| Empiric therapy | |||||
| E. faecium | |||||
| Vancomycin | 2 (13.3) | 5 (16.7) | 7 (15.6) | 1 | |
| β-lactams | 4 (26.7) | 16 (53.3) | 20 (44.4) | .12 | |
| Daptomycin | 7 (46.7) | 10 (33.3) | 17 (37.8) | .59 | |
| Linezolid | 2 (13.3) | 9 (30.0) | 11 (24.4) | .29 | |
| Tigecycline | 2 (13.3) | 2 (6.7) | 4 (8.9) | .59 | |
| Otherb | 1 (6.7) | 4 (13.3) | 5 (11.1) | .65 | |
| Therapy received was not appropriate | 5 (33.3) | 2 (6.7) | 7 (15.6) | .03 | |
| E. faecalis | |||||
| Vancomycin | 5 (35.7) | 14 (50.0) | 19 (45.2) | .58 | |
| β-lactams | 4 (28.6) | 13 (46.4) | 17 (40.5) | .33 | |
| Daptomycin | 1 (7.1) | 1 (3.6) | 2 (4.8) | 1 | |
| Linezolid | 1 (7.1) | 2 (7.1) | 3 (7.1) | 1 | |
| Tigecycline | 1 (7.1) | 1 (3.6) | 2 (4.8) | 1 | |
| Otherc | 2 (14.3) | 1 (3.6) | 3 (7.1) | .25 | |
| Therapy received was not appropriate | 2 (14.2) | 8 (28.6) | 10 (23.8) | .45 | |
Values are reported as No. (%) except where indicated. Clinical characteristics of patients with and without persistent bacteremia are described. Matching factors were not analyzed, as they were balanced by design with respect to the outcome of interest. Bolded values correspond to P values of statistical significance. Nonantibiotic variable P values with an asterisk correspond to variables with P values above the threshold for significance (P < .05) but were included in the multivariable analysis. As analyses were performed by species for all antibiotic therapy data, none of these variables were included in the multivariable model.
Abbreviations: BSI, bloodstream infection; CC, cancer center; GLMM, generalized linear mixed model; HS, hospital system; NA, not applicable.
aIncluded minocycline (n = 4), quinupristin/dalfopristin (n = 1).
bIncluded minocycline (n = 5).
cIncluded doxycycline (n = 1), levofloxacin (n = 1), rifampin (n = 1).
Clinical Characteristics of Patients With Recurrent Enterococcal Bacteremia and Comparison Patients
| Variables | Recurrent (n = 16) | Comparison (n = 30) | Total Population (n = 46) | Univariable P Value | GLMM P Value |
|---|---|---|---|---|---|
| Institution | NA, matching factor | ||||
| Cologne, GER HS | 7 (43.8) | 12 (40.0) | 19 (41.3) | ||
| Houston, TX CC | 2 (12.5) | 4 (13.3) | 6 (13.1) | ||
| Detroit, MI HS | 3 (18.8) | 6 (20.0) | 9 (19.6) | ||
| Houston, TX HS 1 | 1 (6.3) | 2 (6.7) | 3 (6.5) | ||
| Houston, TX HS 2 | 2 (12.5) | 4 (13.3) | 6 (13.0) | ||
| Miami, FL HS | 1 (6.3) | 2 (6.7) | 3 (6.5) | ||
| Demographics | |||||
| Age, y | |||||
| ≤40 | 3 (18.8) | 4 (13.3) | 7 (15.2) | .96 | |
| 41–50 | 0 (0.0) | 2 (6.7) | 2 (4.3) | .56 | |
| 51–60 | 0 (0.0) | 5 (16.7) | 5 (10.9) | .92 | |
| 61–70 | 4 (25.0) | 4 (13.3) | 8 (17.4) | .78 | |
| 71–80 | 9 (56.3) | 15 (50.0) | 24 (52.2) | .22 | |
| Race | |||||
| Asian | 0 (0.0) | 1 (3.3) | 1 (2.2) | 1 | |
| Black or African-American | 2 (12.5) | 3 (10.0) | 5 (10.9) | 1 | |
| Caucasian/White | 12 (75.0) | 24 (80.0) | 36 (78.3) | .72 | |
| Unknown | 2 (12.5) | 2 (6.7) | 4 (8.7) | .60 | |
| Ethnicity | |||||
| Hispanic | 2 (12.5) | 3 (10.0) | 5 (10.9) | 1 | |
| Not Hispanic | 11 (6.8) | 25 (83.3) | 36 (78.3) | .44 | |
| Unknown | 3 (18.8) | 2 (6.7) | 5 (10.9) | .32 | |
| Sex, male | 12 (75.0) | 14 (46.7) | 26 (56.5) | .12 | |
| Current admission | |||||
| Intensive care unit admission | 8 (50.0) | 11 (36.7) | 19 (41.3) | .57 | |
| Reason of admission medical/nonsurgical | 11 (68.8) | 22 (73.3) | 33 (71.7) | 1 | |
| Length of hospitalization, d, median (range) | 71.5 (12–164) | 20 (5–77) | 27 (5–164) | < .001 | .002 |
| Medical history | |||||
| Baseline comorbidities | |||||
| Heart/cardiovascular disease | 1 (6.3) | 3 (10.0) | 4 (8.7) | 1 | |
| Diabetes mellitus | 4 (25.0) | 9 (30.0) | 13 (28.3) | .99 | |
| Chronic obstructive pulmonary disease | 1 (6.3) | 4 (13.3) | 5 (10.9) | .81 | |
| Chronic kidney disease | 8 (26.7) | 8 (26.7) | 12 (26.1) | 1 | |
| Liver disease | 3 (18.8) | 3 (10.0)a | 6 (13.0) | .734 | |
| Solid malignancy | 2 (125) | 9 (30.0) | 11 (23.9) | .34 | |
| Hematological malignancy | 6 (37.5) | 7 (23.3) | 13 (28.3) | .50 | |
| Charlson Comorbidity Index, median (range) | 9 (3–13) | 8 (3–14)a | 9 (3–14) | .80 | |
| Solid organ transplant | 2 (12.5) | 0 (0.0) | 2 (4.3) | 1 | |
| Bone marrow transplant | 2 (12.5) | 4 (13.3) | 6 (13.0) | .01 | .40 |
| Immunosuppressive therapy | 10 (62.5) | 10 (33.3) | 20 (43.5) | .07* | .07 |
| Cardiac device and cardiac valve | 2 (12.5) | 1 (3.3)a | 3 (6.5) | .28 | |
| Hemodialysis prior to admission | 0 (0.0) | 2 (6.7) | 2 (4.3) | 1 | |
| Previous hospitalization within 365 d | 11 (68.8)a | 19 (63.3)b | 30 (65.2) | .78 | |
| Resided in nursing home/long-term care facility prior to admission | 0 (0.0) | 2 (6.7) | 2 (4.3) | .54 | |
| At time of index blood culture collection | |||||
| Recent surgical procedure | 7 (43.8) | 7 (23.3) | 14 (30.4) | .27 | |
| High-dose steroid use | 1 (6.3) | 1 (3.3) | 2 (4.3) | 1 | |
| Neutropenia < 500 cells/μL | 9 (56.3)a | 18 (60.0)b | 27 (58.7) | .59 | |
| Receiving hemodialysis or renal replacement therapy | 3 (18.8) | 6 (20.0) | 9 (19.6) | .02 | .81 |
| Central line placement | 12 (75.0) | 17 (56.7) | 29 (63.0) | .34 | |
| Urinary catheter | 6 (37.5)a | 12 (40.0)b | 18 (39.1) | 1 | |
| Mechanical ventilation | 6 (37.5) | 10 (33.3)a | 16 (34.8) | 1 | |
| Pitt bacteremia score ≥ 2 | 8 (50.0) | 16 (53.3)a | 24 (52.2) | .53 | |
| Index bacteremia episode | |||||
| Positive culture > 2 d after admission | 14 (87.5) | 18 (60.0) | 32 (69.6) | .11 | |
| Polymicrobial BSI | 1 (6.3) | 15 (16.7) | 6 (13.0) | .59 | |
| Enterococcus faecium | 15 (93.8) | 28 (93.3) | 43 (93.5) | NA, matched factor | |
| Enterococcus faecalis | 1 (6.3) | 2 (6.7) | 3 (6.5) | NA, matched factor | |
| Isolate is vancomycin resistant | 9 (56.3) | 23 (76.7) | 32 (69.6) | .27 | |
| Infectious diseases consult | 12 (75.0) | 20 (66.7) | 32 (69.6) | .74 | |
| Endocarditis | 0 (0.0) | 0 (0.0) | 0 (0.0) | NA | |
| Infection source | |||||
| Central line infection | 5 (31.3) | 7 (23.3) | 12 (26.1) | .82 | |
| Genitourinary | 0 (0.0) | 1 (3.3) | 1 (2.2) | 0.50 | |
| Abdominal/gastrointestinal | 3 (18.8) | 9 (30.0) | 12 (26.1) | .85 | |
| Unknown/primary source | 7 (43.8) | 11 (36.7) | 18 (39.1) | 1 | |
| Wound/osteoarticular | 0 (0.0) | 1 (3.3) | 1 (2.2) | 1 | |
| Other | 0 (0.0) | 1 (3.3) | 1 (2.2) | 1 | |
| Clinical outcomes | |||||
| In-hospital mortality | 9 (56.3) | 8 (26.7) | 17 (37.0) | .10* | .34 |
| Definitive antimicrobial therapy | |||||
| E. faecium | |||||
| Monotherapy | |||||
| β-lactams | 3 (18.8) | 5 (16.7) | 8 (17.4) | 1 | |
| Daptomycin | 3 (18.8) | 4 (13.3) | 7 (15.2) | .69 | |
| Glycopeptidesc | 4 (25.0) | 2 (6.7) | 6 (13.0) | .16 | |
| Linezolid | 2 (12.5) | 8 (26.7) | 10 (21.7) | .29 | |
| Tigecycline | 2 (12.5) | 1 (3.3) | 3 (6.5) | .29 | |
| Combination therapy | |||||
| Dual β-lactams | 0 (0.0) | 1 (3.3) | 1 (2.2) | 1 | |
| Glycopeptided plus β-lactams | 1 (6.3) | 4 (13.4) | 5 (10.9) | .64 | |
| Daptomycin plus β-lactams | 4 (25.0) | 8 (26.7) | 12 (26.1) | 1 | |
| Daptomycin plus linezolid | 0 (0.0) | 1 (3.3) | 1 (2.2) | 1 | |
| Othere | 1 (6.3) | 4 (13.3) | 5 (10.9) | .64 | |
| Therapy received was not appropriate | 0 (0.0) | 5 (16.7) | 5 (10.9) | .14 | |
| E. faecalis | |||||
| Monotherapy | |||||
| β-lactams | 1 (100.0) | 0 (0.0) | 1 (25.0) | .25 | |
| Combination therapy | |||||
| Dual β-lactams | 0 (0.0) | 1 (33.3) | 1 (25.0) | 1 | |
| Daptomycin plus β-lactams | 0 (0.0) | 2 (66.7) | 2 (50.0) | 1 | |
| Therapy received was not appropriate | 0 (0.0) | 0 (0.0) | 0 (0.0) | NA | |
| Empiric therapy | |||||
| E. faecium | |||||
| Vancomycin | 3 (20.0) | 5 (18.5) | 8 (19.0) | 1 | |
| β-lactams | 2 (13.3) | 15 (55.6) | 17 (40.5) | .01 | |
| Daptomycin | 5 (33.3) | 7 (25.9) | 12 (28.6) | 0.73 | |
| Linezolid | 1 (6.7) | 4 (14.8) | 5 (11.9) | .64 | |
| Tigecycline | 2 (13.3) | 0 (0.0) | 2 (4.8) | .12 | |
| Otherf | 0 (0.0) | 2 (7.4) | 2 (4.8) | .53 | |
| Therapy received was not appropriate | 4 (26.7) | 3 (11.1) | 7 (16.7) | .22 | |
| E. faecalis | |||||
| Vancomycin | 0 (0.0) | 1 (33.3) | 1 (25.0) | 1 | |
| β-lactams | 0 (0.0) | 1 (33.3) | 1 (25.0) | 1 | |
| Daptomycin | 0 (0.0) | 2 (66.7) | 2 (50.0) | 1 | |
| Linezolid | 1 (100.0) | 0 (0.0) | 1 (25.0) | .25 | |
| Tigecycline | 0 (0.0) | 1 (33.3) | 1 (25.0) | 1 | |
| Therapy received was not appropriate | 0 (0.0) | 1 (33.3) | 1 (25.0) | 1 | |
Values are presented as No. (%) except where indicated. Clinical characteristics of patients with and without recurrent bacteremia are described. Matching factors were not analyzed, as they were balanced by design with respect to the outcome of interest. Patients with both persistent and recurrent bacteremia episodes during hospitalization were also included in these analyses. Bolded values correspond to P values of statistical significance. Nonantibiotic variable P values with an asterisk correspond to variables with P values above the threshold for significance (P < .05) but were included in the multivariable analysis. As analyses were performed by species for all antibiotic therapy data, none of these variables were included in the multivariable model.
Abbreviations: BSI, bloodstream infection; CC, cancer center; GLMM, generalized linear mixed model; HS, hospital system; NA, not applicable.
aMissing, < 5.
bMissing, < 10.
cTwo patients received teicoplanin, all others received vancomycin.
dOne patient received teicoplanin, all others received vancomycin.
eIncluded minocycline (n = 2), quinupristin/dalfopristin (n = 1), teicoplanin (n = 1), rifampin (n = 1).
fIncluded minocycline (n = 1), rifampin (n = 1).
Patients with persistent versus nonpersistent bacteremia differed in that they were predominately male, more often admitted to the intensive care unit upon admission, and had longer hospital stays following collection of the index positive blood culture. There was no difference between persistent and comparison groups regarding relevant comorbidities, including neutropenia, solid organ transplant history, or presence of hematological malignancies (Table 1), although a larger proportion of patients with persistent bacteremia had endocarditis during hospitalization relative to the comparison group. In the multivariable model, length of hospitalization, presence of a urinary catheter at the time of index blood culture, and in-hospital mortality were significantly associated with persistent bacteremia. Notably, a higher proportion of patients with persistent E. faecium bacteremia received inappropriate empiric therapy relative to those in the comparison group (5/15 [33.3%] vs 2/30 [6.7%], respectively) (Table 1).
Patients with recurrent bacteremia had increased lengths of hospitalization following the index positive blood culture (median, recurrent 71.5 days vs comparison group 20 days; P < .001), were more likely to have a history of bone marrow transplant, and be actively receiving renal replacement therapy relative to the comparison group (Table 2). However, only length of hospitalization was significantly associated with recurrent bacteremia in the adjusted analysis (Table 2). A composite analysis of all recalcitrant (persistent and recurrent) bacteremia patients indicated that those with recalcitrant bacteremia were more likely to be male, have a longer hospital stay following index culture, receive immunosuppressive therapy at baseline, and have endocarditis during hospitalization compared to those without recalcitrant bacteremia (Supplementary Table 1).
Overall, there was no predominating sequence type (ST) associated with persistent or recurrent infections in either E. faecium or E. faecalis (Figure 3). However, there was evidence of institution-specific clustering by STs, such as E. faecium ST80 and 117 in Cologne, Germany, and E. faecalis ST6 in a cancer center in Houston, TX. Nine STs were represented in the persistent E. faecium cohort (Figure 3A) with 4 unique STs (1471, 1478, 584, and 736). For E. faecalis, ST19 and 480 were unique to the persistent cohort (Figure 3B). All but 2 patients in the persistent cohort were consistently infected with the same enterococcal strain, and they were all of the same ST (Supplementary Figure 1). In the recurrent cohort, the infecting isolates also belonged to the same strain in most cases, with the exception of 2 patients from Cologne, Germany (ST117 to ST80; > 7000 SNP differences) (Supplementary Figures 1 and 2) with changes in vancomycin susceptibility. Extensive recombination with a resulting pairwise SNP distance of > 1000 was found in 1 patient (Supplementary Figure 3).
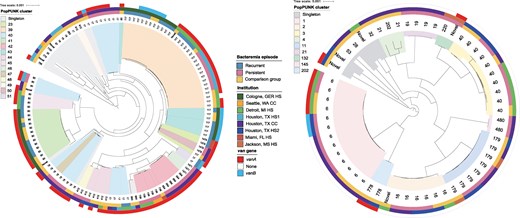
Population structure of the recalcitrant enterococcal bacteremia cohort: (A) Enterococcus faecium (n = 131) and (B) Enterococcus faecalis (n = 57). Midpoint-rooted, core genome-based maximum likelihood phylogenetic trees for comparison, persistent, and recurrent VENOUS isolates are depicted. The labels indicate the ST of each isolate, while branch shading indicates PopPUNK cluster, a whole-genome clustering method, as a higher-resolution clustering method relative to ST assignment. Presence or absence of vancomycin resistance genes vanA and vanB, institution of isolate collection, and bacteremia episode designation are represented as colored bars on the outside of each tree. Abbreviations: CC, cancer center; HS, hospital system; ST, sequence type.
To assess the potential of preadaptation in isolates causing infection, isolates from the index positive blood culture in the persistent and comparison groups were compared to assess genomic differences (Supplementary Table 2). A total of 11 of 15 (73.3%) persistent E. faecium index isolates harbored vanA relative to 16 of 30 (46.7%) nonpersistent index isolates. Furthermore, persistent E. faecium isolates were resistant to more antibiotic classes than their respective comparison cohort, although the number of antimicrobial resistance (AMR) determinants was not significantly different between the groups. Persistent E. faecium index isolates also had larger genomes relative to nonpersistent index isolates (+ 85 181 base pairs [bp]), including accessory genomes (37.8% accessory gene content vs 35.7%, respectively), although the median number of plasmids per isolate was identical. However, 1 small plasmid, rep type rep 14b_2, was found in 2 persistent E. faecium index isolates but was absent from nonpersistent index isolates (Supplementary Table 3).
In E. faecalis, the differences were more modest than those observed in E. faecium, but there was a larger proportion of vanA-harboring nonpersistent index isolates compared to the persistent group (5/28 [17.9%] vs 1/14 [7.1%]). Of note, 1 index ST6 E faecalis isolate from a Houston patient with persistent bacteremia harbored vanB, a previously published occurrence [13]. Persistent E. faecalis isolates did not harbor significantly different numbers of AMR determinants, nor were they resistant to more antibiotic classes relative to controls (Supplementary Table 2). Lastly, 1 plasmid rep type, rep11b_1, was present in 2 E. faecalis index isolates from the persistent bacteremia group but absent in nonpersistent index isolates (Supplementary Table 3 and Supplementary Figure 4). This 9331-bp plasmid has been characterized and contains enterocins 1071A and 1071B [14].
Next, the average proportions of functional gene classes (clusters of orthologous groups, COGs) present in the accessory genomes of persistent versus nonpersistent index isolates were compared for E. faecium and E. faecalis (Supplementary Figure 5). There were no significant differences in proportions of COG groups between persistent and nonpersistent E. faecium index isolates, although a larger proportion of genes belonging to COG L (replication, recombination, and repair) was found in persistent index isolates (Supplementary Figure 5A). Further examination of gene groups exclusively found in persistent isolates (n = 703) revealed 18 gene groups that were significantly associated with persistence, half of which belonged to COG L and were predominantly transposases (Supplementary Data 2 tabs 2 and 3). In E. faecalis, there was a significantly larger proportion of genes belonging to COG G, associated with carbohydrate transport and metabolism (Supplementary Figure 5B). However, of gene groups exclusively present in persistent isolates (n = 646), only 1, a gene associated with a phage protein (group 5172), was significantly associated with persistent BSI and could not be assigned to any COG functional group (Supplementary Data 2 tabs 3 and 4).
Subsequently, we assessed genetic changes during each persistent infection from the index culture to the sequential persistent positive culture to evaluate whether positive genetic selection occurred in response to host or antibiotic pressures. Median genome size of E. faecium isolates decreased over time by 50 808 bp, although the median number of plasmids stayed the same (n = 4). Gains or losses in the typeable plasmid repertoire were observed in 5 persistent bacteremia episodes (5/15, 33.3%) (Supplementary Figure 6A). In persistent E. faecalis infections, genomic changes were smaller relative to E. faecium. There was a slight increase (2261 bp) in average genome size over time, and median plasmid carriage remained the same, although it was overall lower than in E. faecium isolates (median carriage 1 vs 4, respectively) (Supplementary Table 2). However, as observed in E. faecium, there were also 5 plasmid gain/loss events (5/14, 35.7%) observed in the typeable plasmid repertoire in this cohort (Supplementary Figure 6B). For both species, plasmid gains and losses were not specific to a specific rep type.
Chromosomal structural variations (SV) have been postulated to drive niche adaptation through transcriptional regulation and subsequent alteration of bacterial phenotype [15]. Chromosomal SV were highly prevalent, with SV > 1000 bp occurring in 21 of 29 (72.4%) infection pairs, and they were observed more often in E. faecium. The most common SV observed in E. faecium infection pairs was the gain or loss of insertion sequences in ISL3, IS3, or IS256 families. In E. faecalis infection pairs, SV predominantly occurred in site-specific recombination regions (Supplementary Data 2 tab 11), likely modulating transcription of downstream loci [15]. A notable SV in E. faecium included an IS1216E-mediated insertion of the vanA operon and a chromosomal insertion of a cadmium resistance gene cadC disrupting fhs (formyltetrahydrofolate synthetase gene) (Supplementary Figure 7). In E. faecalis, a 5-fold duplication of a gene cluster that includes a putative multidrug resistance protein (EF-1078) and streptomycin adenylyltransferase gene (ant1) was seen in the index isolate, which was reduced to a single copy in the persistent isolate (Supplementary Figure 8).
Given the relatively short time between blood cultures, there was no appreciable difference in the proportions of accessory genes belonging to any COG functional categories for either species in each patient's index blood culture isolate and the respective persistent isolate, suggesting that the persistence of bacteremia is not generally driven by the acquisition of specific genes. However, the proportion of genes belonging to COG L (replication, recombination, repair) was higher in persistent E. faecium isolates relative to persistent E. faecalis (Supplementary Figure 9). Relative to the index blood culture isolate, persistent E. faecium isolates gained substantially more genes than E. faecalis isolates (median genes gained 34 vs 10.5, respectively) (Supplementary Data 2 tabs 7 and 8). For both species, the majority of genes gained in more than 1 patient isolate set were associated with COG L group, including transposases from the IS66 family, integrase core domains, and phage integrases (Supplementary Data 2 tabs 9 and 10).
Index isolates from persistent bacteremia episodes served as patient-specific references to examine within-host diversity in persistent time point isolates relative to baseline (Figure 4). Overall, the average pairwise SNP distance was markedly higher for E. faecium relative to E. faecalis (average, 7.73 [range, 0–31] vs 1.71 [range, 0–6], respectively), with only 2 infection pairs from both E. faecium and E. faecalis infections differing by over 20 SNPs (31 and 21 SNPs), the previously published threshold suggested to differentiate E. faecium strains [16]. Nonetheless, 3 of 5 E. faecium persistent infections with more than 1 positive culture beyond the first persistent time point exceeded this threshold at some point during infection (Figure 4A). The overall number of nonsynonymous SNPs observed in E. faecium was higher compared to E. faecalis persistent infections. However, the proportion of nonsynonymous SNPs relative to synonymous SNPs was much higher in E. faecalis infection pairs (Figure 5 and Supplementary Material, p. 23).
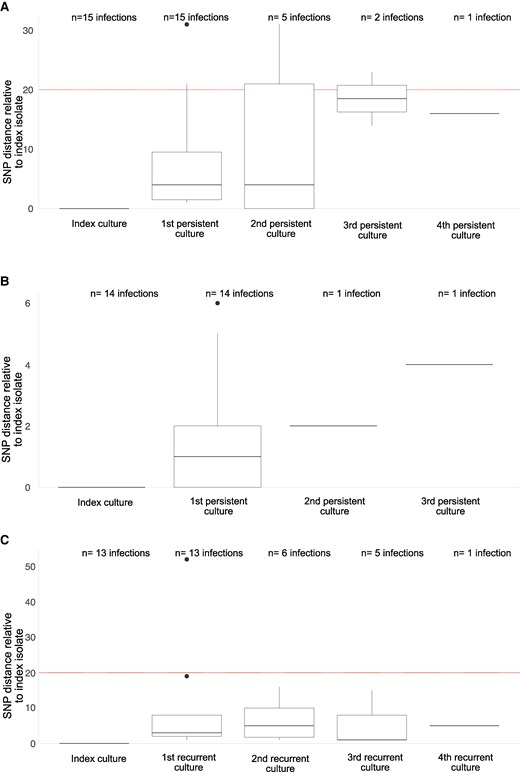
SNP distances relative to index culture of recalcitrant isolates by time of culture collection: box and whisker plots displaying the distribution, including outliers (fileld circles) of (A) pairwise SNP distance relative to index culture isolate for persistent Enterococcus faecium infections; box and whisker plots of (B) pairwise SNP distances relative to the index culture isolate for persistent Enterococcus faecalis infections; and box and whisker plots of (C) pairwise SNP distances relative to the index culture isolate for recurrent E. faecium infections. The horizontal line corresponds to the previously published 20-SNP threshold for strain differentiation. For recurrent infections, 3 infections were excluded from these analyses—2 due to ST switching, and 1 due to a SNP distance of > 1000 due to disruptive genomic insertions. Abbreviations: SNP, single-nucleotide polymorphism; ST, sequence type.
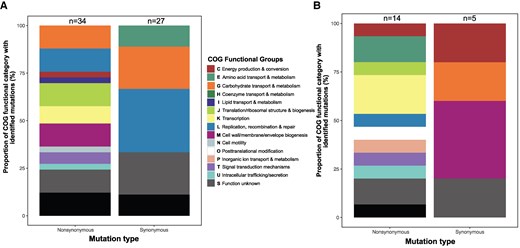
Functional characterization of mutations in coding regions during the course of persistent bacteremia: (A) Enterococcus faecium and (B) Enterococcus faecalis. The stacked bar plots indicate the average proportions of the functional classifications of mutation-containing genes in index bacteremia isolates versus respective persistent time point bacteremia isolates. Synonymous and nonsynonymous mutations are presented separately for each species, and the total number of mutations identified in coding regions are presented at the top of each stacked bar plot. Abbreviation: COG, clusters of orthologous groups
The representation of functional groups associated with mutated genes was relatively disparate between E. faecium and E. faecalis infection pairs, suggesting species-specific pathways of adaption. For instance, nonsynonymous mutations in genes belonging to COG O (posttranslational modification) were exclusively found in E. faecalis infection pairs (Figure 5B). In contrast, there was a markedly higher proportion of mutations in genes belonging to COGs L, (carbohydrate transport/utilization), G (amino acid transport/utilization), and J (translation/ribosomal structure/biogenesis) in E. faecium pairs (Figure 5A). Of note, a nonsynonymous mutation in rpoB (resulting in H486N), observed in 1 E. faecium persistent pair, has been associated with rifampin and daptomycin resistance [17]. Moreover, mutation-based adaptation appears to be episode-specific in this cohort, as there were no common mutations across more than 1 infection episode in either species. Nonetheless, the same variant, Thr167Ile in a GTP diphosphokinase (encoded by relA) and previously associated with the ppGpp stringent response under stress conditions [18], appeared in 1 infection pair in both E. faecium and E. faecalis (Supplementary Data 2 tabs 12 and 14).
Two episodes of E. faecium recurrent bacteremia exhibited strain switching, exhibiting SNP distances of > 20 as well as a change in ST. In the other 11 episodes, pairwise SNP distances in recurrent bacteremia infection pairs were significantly higher compared to pairwise SNP distances in persistent E. faecium pairs (Supplementary Figures 10 and 11). Recurrent E. faecium isolates also exhibited a larger proportion of nonsynonymous mutations relative to the persistent E. faecium cohort (Supplementary Figure 10). As previously described, 1 same-ST recurrent bacteremia episode was not included in aggregate analyses—although no strain switching was observed, the recurrent isolate collected differed from the index isolate by 1462 SNPs, indicating a different infecting strain. Of the SNPs in coding regions, 88.8% (1030) were located in the chromosome. Further genomic characterization revealed the insertion of large genomic elements in the recurrent isolate (Supplementary Figures 2 and 3), including a 43.3-kb transposon harboring the vanB operon that resulted in conversion to phenotypic vancomycin resistance.
DISCUSSION
In this large-scale, multicenter cohort study of 1265 patients with enterococcal bacteremia, we found that 41 of 1265 (3.2%) patients experienced a recalcitrant episode. Recalcitrant episodes were further divided into patients with persistent bacteremia (defined as positive blood cultures ≥ 4 days after the index culture) and those with recurrent BSI (patients who had initial clearance but their bacteremia returned). Our findings indicate that patients with extended hospitalizations or presence of a urinary catheter (likely reflecting chronic illness) are at higher risk of developing persistent bacteremia. Moreover, those patients experienced increased risk of mortality, confirming previous findings using the VENOUS cohort [2] and supporting the notion that efforts to clear the bacteremia are of paramount importance to improve patients’ outcomes. Of note, there was a relatively even number of persistent E. faecium and E. faecalis infections, despite the fact that persistent E. faecalis were predominantly ampicillin and vancomycin-susceptible and harbored a lower number of AMR determinants than E. faecium infections (2 vs 11.5, respectively), and were most likely to receive appropriate therapy. However, species-specific comparisons showed that nearly 30% of patients with persistent E. faecalis infections were also diagnosed with endocarditis during hospitalization, relative to only 13.3% of patients with persistent E. faecium infections. Previous studies assessing risk factors for persistent enterococcal bacteremia have found that infective endocarditis is an independent risk factor for persistent bacteremia despite effective therapy [19].
The only clinical variable significantly associated with recurrent bacteremia was length of hospitalization. The recurrent episodes were caused predominantly by E. faecium and were primarily attributed to a single site. This is likely due to the greater frequency of blood cultures per patient taken by this site—nearly daily in most instances— which may have allowed for the identification of clearance events that would not be captured by less frequent blood cultures. Nonetheless, our findings suggest that both phenomena (persistence and recurrence) are clinically distinct and likely are influenced by different factors.
Our comprehensive genomic analyses suggest that persistent E. faecium enterococcal bacteremia isolates may be preadapted to cause recalcitrant infection and that pathways of adaptation are both species and episode specific. More importantly, we found that most episodes of persistent and recurrent infection were with the same enterococcal strain. Our findings suggest that isolates likely evolve independently of lineage to cause persistent infection. Indeed, vancomycin resistance was more prevalent in the persistent group, genome size was markedly larger, and there was resistance to significantly more antibiotic classes relative to nonpersistent isolates.
Persistent E. faecium isolates had a higher proportion of genes associated with replication, recombination, and repair, and half of the gene groups found exclusively in persistent E. faecium isolates were transposases and insertion sequences, consistent with previous findings [20]. Of note, persistent E. faecium isolates exhibited a median decrease in genome size of over 50 000 bp despite maintaining a stable median plasmid carriage, indicating that a major source of genetic variation is chromosomal SV. Larger SV of > 1000 bp were highly prevalent in both E. faecium and E. faecalis infection pairs, but the type of SVs observed appeared to be largely species specific, with E. faecium SV driven mainly by insertion sequence gain and loss, whereas E. faecalis SV were more often attributed to reshuffling or inversion of existing genetic material at site-specific recombination regions. This phenomenon of phase variation in E. faecalis affecting type I restriction-modification systems impacts gene expression [15, 21], while the lack of functional clustered regularly interspaced short palindromic repeats–CRISPR-associated protein (CRISPR-cas) systems and highly plastic genomes of clinical E. faecium isolates are widely associated with acquisition and loss of mobile genetic elements, such as insertion sequences [22].
Although E. faecium gained over 3 times more genes during infection relative to E. faecalis [23], we found no shared patterns of adaptation, with the exception of a relA mutation in 1 E. faecium and 1 E. faecalis infection pair. Mutations in relA, a mediator of the bacterial stringent response, have been associated with antibiotic resistance in multiple pathogens, with mutations likely to alter the expression of genes related to biofilm-dependent antibiotic tolerance in immunocompromised hosts [24].
Despite the large sample of sites and patients compared with previous studies, statistical power is limited due to the relatively small number of recalcitrant episodes. There is also the potential for selection bias, as the distribution of vancomycin resistance in E. faecalis isolates in this study does not reflect the overall prevalence of vancomycin-resistant E. faecalis in the general US clinical population. Although US geographical representation is robust, the global generalizability of this work is limited given the single non-US study site, especially considering that the infections from this site were exclusively classified as recurrent BSI. Lastly, only 1 isolate per blood culture was sequenced, meaning the full breadth of within-host diversity over time may have been missed. However, previous studies have shown that even sequencing up to 10 isolates per culture does not reveal substantial diversity in infections from this source [4]. Data from this study improve our understanding of enterococcal adaptive evolution during recalcitrant infections, serving as foundational research for more extensive studies to define specific signatures of adaptation and correlation with clinical outcomes.
Supplementary Data
Supplementary materials are available at The Journal of Infectious Diseases online (http://jid.oxfordjournals.org/). Supplementary materials consist of data provided by the author that are published to benefit the reader. The posted materials are not copyedited. The contents of all supplementary data are the sole responsibility of the authors. Questions or messages regarding errors should be addressed to the author.
Notes
Author contributions. All authors contributed to the study conception and design. B. M. H. and C. A. A. contributed equally to this work. S. R. S. was responsible for data cleaning, isolate sequencing, analysis, and drafting of the manuscript. P. V. S., M. G. S., A. M. D., D. T., L. B., G. S., J. K., V. W., R. C., K. N., and A. M. were responsible for data collection. A. Q. D., H. S. S., and A. E. D. were responsible for isolate processing and sequencing. All authors reviewed and approved the final version of the manuscript.
Acknowledgments. The authors thank the clinical microbiology teams at each participating study site for identification and isolation of the isolates used in this study.
Data availability. Whole-genome hybrid assemblies of isolates used in the study are available on the National Institutes of Health National Center for Biotechnology Information under BioProject ID PRJNA118579 and the accession numbers listed in Supplementary Data 1.
Financial support. This work was supported by the National Institute of Allergy and Infectious Disease (grant numbers K24AI121296, R01AI134637, R01AI148342-01, and P01AI152999-01 to C. A. A., and K01AI148593-01 and P01AI152999-01 to B. M. H.); and the National Institutes of Health (grant number 5T32AI055449-15 to S. R. S. predoctoral training grant for Theresa M. Koehler).
References
Author notes
Potential conflicts of interest. W. R. M. has received grant support from Merck; and royalties from UpToDate. C. A. A. has received royalties from UpToDate. All other authors report no potential conflicts.
All authors have submitted the ICMJE Form for Disclosure of Potential Conflicts of Interest. Conflicts that the editors consider relevant to the content of the manuscript have been disclosed.


