


Abstract
Within a multistate viral genomic surveillance program, we evaluated whether proportions of severe acute respiratory syndrome coronavirus 2 (SARS-CoV-2) infections attributed to the JN.1 variant and to XBB-lineage variants (including HV.1 and EG.5) differed between inpatient and outpatient care settings during periods of cocirculation. Both JN.1 and HV.1 were less likely than EG.5 to account for infections among inpatients versus outpatients (adjusted odds ratio [aOR], 0.60 [95% confidence interval (CI), .43–.84; P = .003] and 0.35 [.21–.58; P < .001], respectively). JN.1 and HV.1 variants may be associated with a lower risk of severe illness. The severity of coronavirus disease 2019 may have attenuated as predominant circulating SARS-CoV-2 lineages shifted from EG.5 to HV.1 to JN.1.
Throughout 2023, Omicron XBB-lineage variants were responsible for most severe acute respiratory syndrome coronavirus 2 (SARS-CoV-2) infections in the United States [1]. Between January and May 2023, XBB.1.5 accounted for the majority of infections. This period was followed by multiple XBB variants and their sublineages cocirculating at lower levels. By August and October 2023, 2 sublineages of XBB.1.9.2—EG.5 and its descendant HV.1 (see Supplementary Figure 1 for alternative Pangolin designations)—each sequentially emerged as the most prevalent variants, respectively. By late December 2023, a descendant of BA.2.86, JN.1, became predominant. Compared with XBB variants, JN.1 possesses >30 mutations in the spike protein, including the notable L455S mutation, which may contribute to increased immune escape and infectivity [2, 3].
The clinical severity of coronavirus disease 2019 (COVID-19) has differed across previous SARS-CoV-2 variants. On average, the Delta variant resulted in more severe illness than the Alpha variant [4, 5], while the Omicron variant resulted in less severe illness than the Delta variant [6, 7]. Among early Omicron sublineages, findings have been mixed, with some studies indicating more severe illness with BA.5 versus BA.1 or BA.2 variants and others reporting no difference [8, 9]. Little is known regarding the relative severity of XBB lineages. In one study, XBB.1.16 was associated with a greater risk of severe outcomes compared to XBB.1.5 and XBB.1.9 [10]. Empirical data comparing severity between JN.1 and XBB-lineage variants is also scarce. One study suggests that severity is attenuated with BA.2.86 lineages (predominantly JN.1) [11].
Within a multistate respiratory virus genomic surveillance program, we assessed whether the proportions of SARS-CoV-2 infections attributed to EG.5, HV.1, and JN.1 variants during periods of cocirculation differed among patients in inpatient care settings (cases considered more severe) versus outpatient care settings (considered more mild). This investigation offers valuable insights into whether the clinical severity of illness differs among the 2 most recently predominant XBB-lineage variants and the JN.1 variant.
METHODS
Within a pan–respiratory virus genomic surveillance program, residual clinical samples from patients who tested positive for a respiratory virus (molecular or antigen) were obtained from 3 health systems spanning 5 US states (Supplementary Table 1). This analysis included samples collected starting on 14 May 2023 (ie, the first 2-week period with EG.5 detected) through 20 January 2024. Only SARS-CoV-2–positive samples that were initially collected during outpatient or inpatient visits were included. Samples from emergency departments or other/unknown visit types were excluded. Patients' demographic characteristics and COVID-19 vaccination history were extracted from electronic health records (EHRs) and state vaccine registries. Study protocols were approved by institutional review boards (central or local) and the requirement for informed consent was waived.
Viral sequencing was performed by Helix using a hybridization-capture based assay (Twist Biosciences) [12] and short-read genome sequencing technology (Illumina) [13]. Samples were included in the analysis if they were successfully sequenced, defined as having at most 30% N bases. SARS-CoV-2 was identified in these samples with reads that aligned to the reference genome, and Pango lineages were subsequently assigned using Pangolin software, version 4.3.1. Further details are provided in the Supplementary Methods.
The clinical visit type associated with sample collection served as a surrogate measure of the severity of illness at time of testing. Inpatient visits represented more severe illness compared to outpatient visits. The reason for the visit and patients’ specific symptoms were not available for analysis. COVID-19 vaccination status was assigned using the date of the most recent dose received before the specimen collection date (Supplementary Methods).
Proportions of outpatients and inpatients with EG.5, HV.1, and JN.1 variants were compared and plotted over 2-week intervals. EG.5 proportions were plotted through the time of ≥5% HV.1 prevalence, and HV.1 proportions were plotted through the time of ≥5% JN.1 prevalence (since the rise of emerging variants, which would be newly included in denominators, could influence observed proportions for previous variants). Logistic regression was used to calculate unadjusted odds ratios for infection with each variant, comparing outpatients and inpatients.
Subsequently, aORs were calculated using multivariable mixed effects logistic regression models with a random intercept for health system and state of residence. Models also adjusted for collection date (natural cubic spline), age (natural cubic spline), sex, race/ethnicity, and COVID-19 vaccination status. Three pairwise comparisons were performed among EG.5, HV.1, and JN.1 during their full respective periods of cocirculation (ie, HV.1 vs EG.5, JN.1 vs EG.5, and JN.1 vs HV.1). We implemented a Bonferroni correction, whereby differences were considered statistically significant at P < .0167. In exploratory analyses, these variants were also compared with other cocirculating XBB variants. Analyses were performed using R software, version 4.2.3.
RESULTS
Between 14 May 2023 and 20 January 2024, of 10 118 total samples that were collected during outpatient or inpatient visits, 6654 (65.8%) were successfully assigned a SARS-CoV-2 lineage. Of those, 1089 samples (16.4%) were collected during inpatient visits, compared with 5565 (83.6%) collected during outpatient visits. XBB-lineage variants accounted for ≥90% of samples through the 2-week period ending 25 November 2023. The 2 most highly prevalent XBB-lineage variants, EG.5 and HV.1, reached peak prevalences of 29.3% and 26.7% during the 2-week periods ending 30 September and 25 November 2023, respectively. The prevalence of JN.1 increased from 20.3% during the 2-week period ending 9 December 2023 to 72.2% during the 2-week period ending 20 January 2024. Temporal patterns in variant prevalence for EG.5, HV.1, and JN.1 are shown in Figure 1.
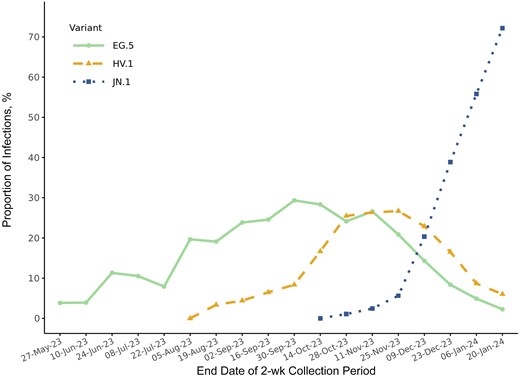
Biweekly prevalences of EG.5, HV.1, and JN.1 variants between 14 May 2023 and 20 January 2024 in the ViEW Network multistate viral genomic surveillance program. Dates are given in date-month-year format.
Patient characteristics overall and by visit type are described in Supplementary Table 2. The median age (interquartile range) was higher among inpatients (74 [60–83] years) than among outpatients (50 [30–67] years). Female sex was less likely among inpatients than among outpatients (52.2% vs 60.3%, respectively), and fewer inpatients than outpatients had ever received a COVID-19 vaccine (63.9% vs 68.4%).
Before HV.1 emergence, EG.5 accounted for similar proportions of SARS-CoV-2 infections among outpatient and inpatient visits (Figure 2A). However, once HV.1 emerged, HV.1 consistently accounted for a greater proportion of infections among outpatient than among inpatient visits, before JN.1 emergence (Figure 2B). Once JN.1 emerged, JN.1 also accounted for more infections among outpatient versus inpatient visits (Figure 2C).
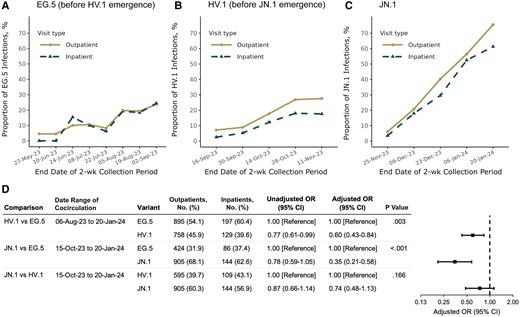
Biweekly prevalence of (A) EG.5, (B) HV.1, and (C) JN.1 variants among samples collected during outpatient and inpatient visits and (D) variant associations with inpatient visits. Proportions for EG.5 are shown during the period of EG.5 circulation through the time of ≥5% HV.1 prevalence. Proportions for HV.1 are then shown through the time of ≥5% JN.1 prevalence. Proportions for JN.1 are then shown through 20 January 2024. Pairwise variant associations were calculated among samples collected during all 2-week periods with variant cocirculation. Odds ratios (ORs) were adjusted for health system and state of residence (as a random intercept), specimen collection date (as a natural cubic spline with 4 degrees of freedom), age (as a natural cubic spline with 4 degrees of freedom), sex, race/ethnicity (Asian, non-Hispanic; black, non-Hispanic; Hispanic; white, non-Hispanic; and other or unknown), and coronavirus disease 2019 vaccination status (XBB.1.5 vaccinated, BA.4/BA.5 vaccinated, wild type vaccinated, or unvaccinated, based on the date of the most recent vaccine dose received before the sample collection date). Dates are given in date-month-year format. Abbreviation: CI, confidence interval.
Both HV.1 and JN.1 were significantly less likely than EG.5 to account for infections among inpatients compared with outpatients, with aORs of 0.60 (95% CI, .43–.84; P = .003) and 0.35 (.21–.58; P < .001), respectively (Figure 2D). The distribution of JN.1 versus HV.1 did not show a significant difference between inpatient and outpatient visits (aOR, 0.74 [95% CI, .48–1.13; P = .17). Although precision was somewhat limited in additional exploratory comparisons, aOR point estimates for HV.1 and JN.1 were consistently <1 when compared with other cocirculating XBB-lineage variants, a trend not seen with EG.5 (Supplementary Figure 2).
DISCUSSION
This study is among the first to provide empirical evidence regarding the relative severity of the JN.1 variant and earlier XBB-lineage variants, which was enabled by the linkage of viral sequencing and patient-level EHR data. Among adults with medically attended SARS-CoV-2 infection, JN.1 and HV.1 infections were less prevalent among hospitalized patients and more prevalent among outpatients, compared with EG.5 infections during the same time period. This inverse association was nearly twice as strong for JN.1 than for HV.1, although the direct comparison of JN.1 versus HV.1 did not reach statistical significance. These variant differences were observed after adjustment for calendar time, demographics, and COVID-19 vaccination status. Our findings provide evidence that disease severity may have attenuated over the course of the 2023–2024 respiratory illness season, as the common circulating SARS-CoV-2 lineages have shifted from EG.5 to HV.1 to JN.1.
Our results are based on variant associations among infected individuals who accessed health system–administered SARS-CoV-2 testing. Healthcare-seeking and testing behaviors, which could vary by medical visit type and change over time, may have introduced differences between inpatients and outpatients beyond disease severity and the patient characteristics measured. However, such behaviors are unlikely to be correlated with one's likelihood of infection with a specific variant over another at a given time point in this study. First, the study sample was restricted to patients who received SARS-CoV-2 testing during their medical visits and had their samples successfully sequenced. This condition is expected to have led to a degree of homogeneity in healthcare-seeking behaviors and healthcare access among patients included. Second, the variants under examination in this study circulated broadly in the United States, making it unlikely that they would have been distributed at vastly different frequencies in populations demarcated by urban/rural divides or socioeconomic status, which are factors known to influence healthcare access. Thus, primary findings are not likely to be explained by selection bias.
JN.1 has exhibited enhanced immune evasion and higher transmissibility compared with XBB variants, which might explain its rapid rise to predominance [2, 3]. Although our findings suggest that JN.1 may be linked to less severe illness than EG.5, COVID-19 hospitalization rates could still be elevated during JN.1 predominance if the overall incidence of SARS-CoV-2 infection is higher. During the winter wave of 2023–2024, new COVID-19 hospital admissions reached their peak during the week ending 6 January 2024, just as JN.1 achieved predominance, which was then followed by a consistent decline [1]. It is uncertain whether this pattern can be partially attributed to JN.1 supplanting XBB lineages or whether it was primarily driven by broader seasonal or temporal SARS-CoV-2 patterns.
The current study has several limitations, including the absence of data on symptoms, reasons for visits, and subsequent clinical outcomes. One underlying assumption is that inpatient status at the time of SARS-CoV-2 testing serves as a reliable indicator of COVID-19 severity. This assumption may not always hold true, as it is unknown whether outpatients were later hospitalized or whether inpatients were admitted primarily due to the severity of their COVID-19 symptoms or for other unrelated reasons. Despite this limitation, several factors may mitigate its impact. During the 2023–2024 respiratory illness season, both SARS-CoV-2 testing and COVID-19 hospitalization rates were reduced compared with previous seasons. This trend could suggest that patients admitted and tested for SARS-CoV-2 during this period were more likely to have severe COVID-19 symptoms rather than being incidental infections detected during admissions for other reasons. In addition, HealthPartners, which contributed 66% of hospitalized patients in the sample, tested only symptomatic patients during the study period. This policy reduces the likelihood that asymptomatic or non-COVID-19–related admissions were included. Furthermore, we adjusted for calendar time in analyses, which would control for potential temporal changes in testing practices. As such, any possible misclassification is expected to be nondifferential with respect to the infecting SARS-CoV-2 variant, and thus, unlikely to explain variant associations.
This study also lacked information on social factors and underlying comorbid conditions. The precision of estimates was reduced when comparing JN.1, HV.1, and EG.5 with other cocirculating variants due to smaller sample sizes. The period of JN.1 circulation during our study was also shorter than that for the XBB-lineage variants, and it remains unknown whether longer-term outcomes associated with JN.1 infection might differ beyond our study’s follow-up period.
While an inverse association for JN.1 and HV.1 with hospitalization is reassuring, ongoing surveillance and further studies comparing patient outcomes across variants are essential. The current study highlights the importance of timely linkage of viral genomic surveillance data with clinical records for monitoring outcomes associated with emerging SARS-CoV-2 variants.
Supplementary Data
Supplementary materials are available at The Journal of Infectious Diseases online (http://jid.oxfordjournals.org/). Supplementary materials consist of data provided by the author that are published to benefit the reader. The posted materials are not copyedited. The contents of all supplementary data are the sole responsibility of the authors. Questions or messages regarding errors should be addressed to the author.
Notes
Acknowledgments. We acknowledge the Helix Clinical Informatics and Bioinformatics teams for their contributions to EHR data and viral sequencing pipelines. We also acknowledge Catherine Clinton for her oversight and guidance in ensuring research compliance. We thank the investigators and staff at HealthPartners, Providence Health, and the Medical University of South Carolina who contributed to the ViEW Network.
Author contributions. All authors contributed substantively to this manuscript in the following ways: conceptualization (M. E. L., V. C., and S. L.), investigation (M. E. L., V. C., R. E. D., P. R. H., P. A. P., J. D. G., C. A. S., L. M. M., D. W., A. D. R., H. D., M. I., N. L. W., T. B., K. T., J. N., J. R., E. S., and S. L.), data curation (M. E. L., V. C., L. M. M., D. W., A. D. R., H. D., M. I., N. L. W., and S. L.), formal analysis (M. E. L.), project administration (R. E. D., P. R. H., P. A. P., J. D. G., C. A. S., E. T. C. N. L. W., W. L., J. L., and S. L.), writing—original draft (M. E. L.), and writing—review and editing (M. E. L., V. C., R. E. D., P. R. H., P. A. P., J. D. G., C. A. S., and S. L.).
Data availability. The accession identification numbers for samples submitted to GISAID (https://gisaid.org/) are provided in Supplementary Table 3. Note that, because this analysis used more permissive criteria than used for GISAID uploads, not all sequences are available on GISAID. Patient metadata are not publicly available. Requests may be considered depending on the use case and should be directed to M. E. L. ([email protected]) and S. L. ([email protected]).
Financial support. This work was supported by Helix.
References
Author notes
Potential conflicts of interest. M. E. L., V. C., L. M. M., E. T. C., D. W., A. D. R., H. D., M. I., N. L. W., T. B., K. T., J. N., J. R., E. S., W. L., J. L., and S. L. are employees of Helix. M. E. L., E. T. C., D. W., M. I., J. L., and S. L. report support for attending meetings and/or travel from Helix. M. E. L., E. T. C., D. W., A. D. R., M. I., N. L. W., W. L., J. L., and S. L. report stock or stock options from Helix. M. E. L., M. I., W. L., and S. L. report contracted research from Pfizer. M. E. L., M. I., W. L., and S. L. report contracted research from the Centers for Disease Control and Prevention. M. E. L. reports contracted research and travel support from Novavax. R. E. D. reports consulting fees from Health Advances. P. R. H. reports contracted research from Seegene USA and Helix. J. D. G. reports contracted research from Helix, Gilead, Eli Lilly, and Regeneron; grants from Merck (BARDA) and Gilead; speaking honoraria and personal fees from Gilead Sciences and Eli Lilly; and collaborative services agreements with Adaptive Biotechnologies, Monogram Biosciences, and LabCorp; and service as a speaker or advisory board member for Gilead and Eli Lilly. C. A. S. reports giving educational lectures sponsored by Eli Lilly. M. I., N. L. W., and S. L. report patents pending or issued to Helix (M. I. and S. L.: US-11776694-B2 and US-20230178236-A1). P. A. P. reports no potential conflicts.
All authors have submitted the ICMJE Form for Disclosure of Potential Conflicts of Interest. Conflicts that the editors consider relevant to the content of the manuscript have been disclosed.

