


Abstract
Brain tissue-derived extracellular vesicles (bdEVs) act locally in the central nervous system (CNS) and may indicate molecular mechanisms in human immunodeficiency virus (HIV) CNS pathology. Using brain homogenate (BH) and bdEVs from a simian immunodeficiency virus (SIV) model of HIV disease, we identified RNA networks in SIV infection and neuroinflammation.
Postmortem occipital cortex samples were obtained from uninfected controls and SIV-infected subjects (acute and chronic phases with or without CNS pathology [SIV encephalitis]). bdEVs were separated and characterized per international consensus guidelines. RNAs from bdEVs and BH were sequenced and quantitative polymerase chain reaction (qPCR)-amplified to detect levels of small RNAs (sRNAs, including microRNAs [miRNAs]) and longer RNAs including messenger RNAs (mRNAs) and circular RNAs (circRNAs).
Dysregulated RNAs in BH and bdEVs were identified in acute and chronic infection with pathology groups, including mRNAs, miRNAs, and circRNAs. Most dysregulated mRNAs in bdEVs reflected dysregulation in source BH. These mRNAs are disproportionately involved in inflammation and immune responses. Based on target prediction, several circRNAs that were differentially abundant in source tissue might be responsible for specific differences in sRNA levels in bdEVs during SIV infection.
RNA profiling of bdEVs and source tissues reveals potential regulatory networks in SIV infection and SIV-related CNS pathology.
Human immunodeficiency virus (HIV) infection causes chronic immune activation, inflammation, and end-organ diseases [1], including HIV-associated neurocognitive disorders [2]. Studies of HIV neuropathology are facilitated by animal models. The simian immunodeficiency virus (SIV) dual-inoculated pigtailed macaque (Macaca nemestrina) model, involving coinfection with a neurovirulent molecular clone SIV/17E-Fr and an immunosuppressive swarm SIV/DeltaB670, consistently recapitulates classic HIV central nervous system (CNS) pathology [3, 4].
Extracellular vesicles (EVs) may be involved in HIV-associated neuropathology as nanosized membranous particles that share biogenesis pathways with HIV, affect virus entry, carry HIV components, and transfer molecules with proviral and antiviral effects [5]. EVs can be used to assess the health of brain tissue and may betray disease if released into the periphery [6]. Recent advances allow rigorous separation and characterization of brain derived EVs (bdEVs) [7], whose molecular components may hint at mechanisms of CNS pathogenesis [7–9]. Previous studies of EV-associated messenger RNAs (mRNAs) [10] and microRNAs (miRNAs) [11, 12] have suggested roles in HIV pathogenesis. In contrast, circular RNAs (circRNAs) [13]—highly stable, covalently closed, single-stranded RNAs that may bind and modulate miRNAs as “sponges” [14] and compete with canonical mRNAs for splicing factors [15]—are relatively unexplored in HIV disease.
Here, we explored potential competing endogenous RNA (ceRNA) interactions in HIV infection. mRNAs, miRNAs, and circRNAs were measured by RNA sequencing (RNA-Seq) and quantitative polymerase chain reaction (qPCR) in brain homogenate (BH) and rigorously separated and characterized bdEVs in SIV CNS disease. We identified associations of specific RNA species. mRNA differences in BH and bdEVs largely correlated, while miRNA and circRNA findings suggest that several circRNAs may contribute to differential abundance of bdEV miRNAs.
METHODS
Tissues
Occipital cortex samples were from previous studies of male pigtailed macaques, approved by the Johns Hopkins Institutional Animal Care and Use Committee and conducted following the Weatherall Report, the Guide for the Care and Use of Laboratory Animals, and the US Department of Agriculture Animal Welfare Act. Occipital cortex samples (including both gray and white matter) were from subjects (Table 1) not infected (n = 6) or dual inoculated (n = 16) with SIV swarm B670/clone SIV/17E-Fr [3, 4] at acute (n = 5, 7 days postinoculation, peak of viral replication) and chronic infection (n = 11, 84–101 days postinoculation). Chronic cases were classified as without or with CNS pathology (respectively, CP− n = 7, and CP+ SIV encephalitis, n = 4) [16, 17]. For details of tissue perfusion, preparation, storage, and pathological examination, see [3, 4].
Subject Characteristics
| Animal No. | Animal ID | Group | Inoculation | SIVE | Necropsy, dpi | Age at Necropsy, y | Brain Weight, mg |
|---|---|---|---|---|---|---|---|
| 1 | 332 | Uninfected | 6 Sep 2011 (sham) | None | 85 | 5 | 141 |
| 2 | 333 | Uninfected | 6 Sep 2011 (sham) | None | 84 | 5.1 | 218 |
| 3 | 334 | Uninfected | 6 Sep 2011 (sham) | None | 84 | 5.5 | 194 |
| 4 | 373 | Uninfected | 16 Sep 2014 (sham) | None | 84 | 3.5 | 295 |
| 5 | 374 | Uninfected | 16 Sep 2014 (sham) | None | 85 | 3.5 | 318 |
| 6 | 375 | Uninfected | 16 Sep 2014 (sham) | None | 86 | 3.4 | 391 |
| 7 | 275 | Acute | 2 Dec 2008 | None | 7 | 3 | 246 |
| 8 | 282 | Acute | 2 Dec 2008 | None | 7 | 3.3 | 133 |
| 9 | 278 | Acute | 8 Dec 2008 | None | 7 | 3.3 | 253 |
| 10 | 284 | Acute | 9 Dec 2008 | None | 7 | 3.5 | 217 |
| 11 | 296 | Acute | 9 Dec 2008 | None | 7 | 2.3 | 168 |
| 12 | 262 | CP− | 19 Nov 2007 | None | 95 | 3.3 | 239 |
| 13 | 260 | CP− | 19 Nov 2007 | None | 101 | 3.4 | 298 |
| 14 | 294 | CP− | 25 Jul 2008 | None | 87 | 2.2 | 245 |
| 15 | 292 | CP− | 25 Jul 2008 | None | 84 | 3.2 | 120 |
| 16 | 299 | CP− | 6 Apr 2009 | None | 98 | 3 | 144 |
| 17 | 272 | CP− | 29 Apr 2010 | None | 84 | 4.7 | 298 |
| 18 | 351 | CP− | 20 Nov 2012 | None | 87 | 5.4 | 211 |
| 19 | 143 | CP+ | 20 May 2005 | + | 208 | 3.9 | 204 |
| 20 | 295 | CP+ | 25 Jul 2008 | + | 88 | 3 | 163 |
| 21 | 298 | CP+ | 6 Apr 2009 | + | 93 | 3.1 | 211 |
| 22 | 350 | CP+ | 20 Nov 2012 | + | 86 | 5.5 | 224 |
Abbreviations: CP, central nervous system pathology; dpi, days postinoculation; SIVE, SIV encephalitis.
EV Separation
bdEVs were separated [7–9] from 120–391 mg tissue (Table 1). Approximately 50 mg was used for total RNA extraction (BH). The remainder was digested with 75 U/mL collagenase 3 (CLS-3, S8P18814; Worthington), 15 minutes, and spun at 300g, 10 minutes, and 2000g, 15 minutes at 4°C. Supernatant was filtered (0.22 μm) and centrifuged at 10 000g, 30 minutes at 4°C. Supernatant was separated by size exclusion chromatography and concentrated and resuspended in 120 uL. For methodologic details see [7].
Basic EV Characterization
bdEV size profile and concentration were measured by nanoflow cytometry (Flow NanoAnalyzer; NanoFCM, Inc) as described [18].
Single-Particle Interferometric Reflectance Imaging
Single-particle interferometric reflectance imaging (SP-IRIS) was performed as described [18]. bdEVs (10 μL from the 120 μL resuspension) were diluted in 35 μL incubation buffer and incubated overnight on ExoView tetraspanin chips (NanoView Biosciences). After 4 times 3-minute washes in incubation buffer, chips were imaged (ExoView; NanoView) and data analyzed (NanoViewer 2.8.10; NanoView).
Transmission Electron Microscopy
bdEVs (10 μL) were imaged as described [7] with a Philips CM120 instrument and an 8-megapixel AMT XR80 charge-coupled device.
Nucleic Acid Extraction
RNA was extracted from 100 μL bdEV resuspension with Trizol LS (10296028; Thermo Fisher). For tissue, Trizol (15596018; Thermo Fisher) was used with Lysing Matrix D (116913100; MP Biomedicals) and a benchtop homogenizer (FastPrep-24; MP Biomedicals). After homogenization, RNA was isolated using miRNeasy solutions (217004; Qiagen) with Zymo-Spin columns (C1003-50; Zymo Research). Genomic DNA was isolated using the AllPrep kit (80284; Qiagen) per manufacturer's recommendations.
Quantification of SIV RNA and Total DNA
Viral RNA was measured by qPCR (QuantiTect Virus kit, 211011; Qiagen) or digital droplet PCR (One-Step RT ddPCR Advanced Kit for Probes, 1864022; Bio-Rad). Copy numbers were calculated with a regression curve from control RNA transcripts. SIV total gag DNA (SIV gag total DNA [tDNA]) was measured by qPCR using Multiplex PCR Kit (206143; Qiagen).
Primers/probes were SIV21 forward, 5′-GTCTGCGTCATCTGGTGCATTC-3′; SIV22 reverse, 5′-CACTAGGTGTCTCTGCACTATCTGTTTTG-3′; SIV23, 5′ FAM/3′-Black hole quencher-labeled probe 5′-CTTCCTCAGTGTGTTTCACTTTCTCTTCTG-3′ (Integrated DNA Technologies).
Two replications were performed for each sample and multiplexed with macaque β interferon (mac-IFN-β) 2319 Forward FGCC TCA AGG ACA GGA TGA ACT T, mac-IFN-β 2294 Reverse GCG TCC TCC TTC TGG AAC TG, and mac-IFN-β probe CAT CCC TGA GGA AAT TAA GCA GCC GC for the quantitation of mac-IFN-β. Reaction mixtures were analyzed using a CFX96 Real-Time PCR Detection System (Bio-Rad): 95°C/10 minutes, 45 cycles of 95°C/15 seconds, 55°C/15 seconds, and 60°C/30 seconds. The number of cells per reaction was calculated by quantitating IFN-β DNA (2 copies per cell) and used to normalize SIV gag RNA and tDNA from the same reaction.
Small RNA Sequencing
Small RNA (sRNA) libraries (D-Plex Small RNA-seq, C05030001, Diagenode) were made from bdEV RNA (8 of 40 μL RNA) or 20 ng BH RNA, using D-Plex Single Indexes for Illumina (Set A). After quality control by Fragment Bioanalyzer (DNA 1000, 5067–1505; Agilent), 170–230 bp libraries were selected by BluePippin (HTG3010; Sage Science). Multiplexed libraries were equally pooled to 1 nM and sequenced by NovaSeq 6000/SP Reagent Kit version 1.5 (100 cycles; 20028401; Illumina).
sRNA Sequencing Data Analysis
PolyA-tails and Illumina adapter sequences were removed by cutadapt (version 3.4) and PCR duplicates were removed by collapsing identical sequences with seqkit. Unique molecular identifiers and template-switch motifs were removed further by cutadapt version 3.4. All sequences shorter than 15 nt were discarded. The resulting reads were aligned to hg38 reference transcriptomes in a sequential manner using bowtie (version 1.2.2, maximum 1 mismatch). Specifically, all reads were first mapped to the mitochondrial chromosome (mtRNA) and house-keeping small noncoding RNAs with low sequence complexity, including rRNA, tRNA, RN7S, snRNA, sno/scaRNA, vault RNA, and RNY. The unmapped reads were aligned sequentially to mature miRNA, pre-miRNA, protein-coding mRNA transcripts (mRNA), and long noncoding RNA. The raw counts for each transcript were extracted using eXpress (1.5.1) package. Scaled data (DESeq2) were visualized with principal component analysis (PCA). Differentially expressed (DE) sequences were defined as identified by both DESeq2 [19] and edgeR [20] with false discovery rate (FDR)-adjusted P < .05. RefFinder [21] was used to find internal reference genes. mRNA interaction/function prediction and cellular component annotations were from STRING [22], hierarchical clustering by Heatmapper [23], and miRNA-mRNA interactions by TargetScan [24] and miRDB [25]. Pearson correlation was used to evaluate correlations. Two-tailed P < .05 was considered statistically significant. Analysis was conducted in R 4.2.1 and GraphPad Prism.
Total Transcriptome Sequencing
BH RNAs (1 µg) was incubated with 1 U/µg RNase R (RNR07250; Lucigen) at 37°C, 30 minutes and purified by RNA Clean&Concentrator-5 (R1014; Zymo). cDNA libraries (100 ng RNA, with/without RNase R) were made with “IDT for Illumina RNA UD” indices by Stranded Total RNA Prep Ligation w/Ribo-Zero Plus (20072063; Illumina). Yield/size distribution were assessed by Fragment Bioanalyzer (DNA 1000, 5067-1505; Agilent). Libraries were pooled/sequenced as above.
Whole-Transcriptome Sequencing Data Analysis
Illumina adapter sequences along with the first nucleotide of every read were removed with cutadapt version 3.4, and fragments shorter than 15 nt were discarded. The trimmed and size-selected reads were aligned (Bowtie2 version 2.3.4, default settings) to a manually curated M. mulatta mRNA reference (Mmul_10 Ensembl release 103) containing a single (main) transcript per gene (designated with gene symbols). Unaligned reads were mapped to combined M. mulatta mDNA/ncRNA references. Raw read counts aligned to each reference transcript were extracted using eXpress (version 1.5.1) [26].
Custom circRNA Sequential Alignment
Trimmed and size-selected reads were first aligned to the M. mulatta reference transcriptome (Mmul_10, Ensembl release 103) as well as genomic DNA (Mmul_10 assembly) with bowtie (version 1.2.2, default settings). After filtering noncircularized RNA fragments, reads were aligned to CircAtlas version 2 reference transcripts (http://circatlas.biols.ac.cn) containing putative circRNA junctions within each transcript. Raw read counts per transcript were then extracted using eXpress (version 1.5.1) [26] (Supplementary Figure 2).
circExplorer2
Raw files were genome-aligned to the University of California, Santa Cruz genome (BCM Mmul_8.0.1/rheMac8) using STAR, chimSegmentMin = 10, and chimeric junction files were used to count circRNAs (circExplorer2). circRNAs identified by both our custom circRNA sequential alignment (CiRISeqA) and circExplorer2 were included in the analysis.
circRNA Data Analysis
DE circRNAs were identified by edgeR (FDR < 0.05 = significant). miRanda [27] was used to predict circRNA-miRNA interactions (912 macaque miRNAs, miRBase).
miRNA qPCR
qPCRs (Thermo Fisher) were performed [12] for miRs-19a-3p (Assay 000395), 29a-3p (002112), 146a-5p (000468), 449a-5p (001030), and let-7a-5p (000377). Data were adjusted to the geomean of internal reference quantification cycle (Cq) (as identified by RefFinder,miRs-124-3p (003188_mat), 125b-5p (000449), and 23b-3p (245306_mat)).
circRNA qPCR
cDNA from 1 µg BH RNA or 5 µL bdEV RNA (iScript Reverse Transcription Supermix, 1708840; Bio-Rad) was amplified with iTaq Universal SYBRGreen Supermix (1725120; Bio-Rad). Divergent primers were designed (primer3, default parameters [28]) for circRNA junctions. Housekeeping reference was GAPDH for BH (forward 5’-CCATGGGGAAGGTGAAGGTC-3’, reverse 5’-TGAAGGGGTCATTGATGGCA-3’), geomean Cq of the miRNAs listed above for bdEVs.
Statistical Analysis, Data Availability, and EV-TRACK
Statistical significance was determined by Brown-Forsythe or Welch ANOVA tests. Sequencing data were deposited with GEO (transcriptome, GSE236937; sRNA, GSE236656). EV experimental details are found in EV-TRACK (EV230365) [29].
RESULTS
Occipital cortext bdEVs of uninfected and SIV-infected subjects (Figure 1 and Table 1) were separated and characterized. sRNA-Seq was done for bdEVs and BH, while transcriptome sequencing was done for BH.
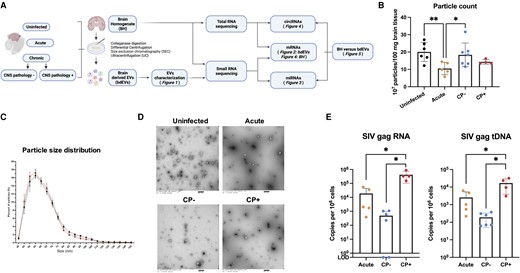
Enrichment and characterization of bdEVs from uninfected and SIV-infected brain. A, Workflow for bdEV enrichment and RNA sequencing. bdEVs and BH were subjected to sRNA-Seq, while BH was subjected to transcriptome RNA-Seq. Created with BioRender.com. B, Particle concentrations of bdEVs from uninfected, acute, CP−, and CP+ samples (NFCM) normalized by tissue mass (per 100 mg). Data are presented as mean ± SD. *P ≤ .05, **P ≤ .01 by 2-tailed Welch t test. C, bdEV size distributions (NFCM) presented in 5-nm size bins versus total detected particles/sample (percentage). D, bdEVs visualized by negative staining transmission electron microscopy, representative of 10 images taken of each fraction from 3 independent tissue samples (scale bar = 500 nm). E, SIV viral Gag RNA and tDNA as copy number/106 cells in occipital cortex. Data are presented as mean ± SD. *P ≤ .05 by 2-tailed Welch t test. Abbreviations: bdEVs, brain tissue-derived extracellular vesicles; BH, brain homogenate; circRNA, circular RNA; CNS, central nervous system; CP, CNS pathology; LOD, limit of detection; miRNA, microRNA; mRNA, messenger RNA; NFCM, nanoflow cytometry; SIV, simian immunodeficiency virus; sRNA-Seq, small RNA sequencing; tDNA, total DNA.
Particle Counts, Sizes, and Morphology and Brain SIV Levels
bdEV preparation particle counts and size distributions suggested recovery of fewer particles from acute-phase samples versus uninfected and chronic infection without CNS pathology (SIV-encephalitis) (CP−; Figure 1B). Size distributions were similar (Figure 1C), while oval/round particles consistent with EV morphology were revealed by transmission electron microscopy (Figure 1D). EV-associated CD81, CD63, and CD9 were detected by SP-IRIS (Supplementary Figure 1). For infected subjects, SIV gag RNA and tDNA were detected in occipital cortex (Figure 1E), with more RNAs and tDNAs in CP+ versus CP−/acute.
bdEV sRNAs in SIV Infection and CP +
Ligation-independent sRNA-Seq of bdEVs yielded 38.7 million (SD, 5.4 million) reads/sample. 85.04% (SD, 1.81%) of processed bdEV reads mapped to the human genome. PCA (Figure 2A) indicated a clear separation of the acute group. For CP+ (n = 4), 3 bdEV samples were separated from the other groups, while 1 was close to CP−. DE analysis of SIV versus uninfected and CP+ versus CP− (Table 2) found most differences between acute and uninfected (71 more, 6 less abundant), followed by CP+/uninfected (46 more, 2 less) and CP+/CP− (2 more abundant). No DE sRNAs were identified in CP−/uninfected. Thirty-eight DE sRNAs were consistently dysregulated in acute and CP+ versus uninfected; 2 were also dysregulated in CP+/CP− (Figure 2B). All 38 sRNAs were mapped to mRNAs, of which 30 had a high interaction confidence score (STRING, 0.7 on a scale of 0–1; Figure 2C). Gene ontology (GO) enrichment indicated involvement in immune regulation pathways (Figure 2D). Ten DE sRNAs (CP+ vs uninfected exclusively; Figure 2B, upper right) were visualized by unsupervised clustering (Figure 2E). Subjects in CP+ and uninfected groups clustered together (Figure 2E). Although no significant GO enrichment was found for these sRNAs, many have involvement in immune regulation based on DAVID [30], including protein tyrosine phosphatase (PTPRC), complement C7 (C7), IFI6 interferon α-inducible protein 6 (IFI6), CD74, and HLA-DRA.
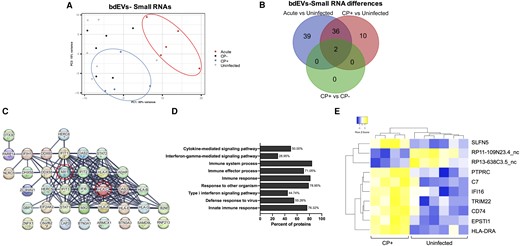
bdEV sRNAs with differential expression in SIV infection. A, PCA using bdEV sRNA profiles of uninfected, acute, CP−, and CP+ groups. Animal No. 299 in the CP− group was defined as an outlier and is not shown. B, Venn diagrams of DE sRNAs in acute and CP+ versus uninfected and CP+ versus CP−. C, STRING protein interaction network analysis: 30 of 38 mRNAs dysregulated in both acute and CP+ groups had a high interaction confidence score (0.7 on a scale of 0–1). D, Top 10 biological processes (GO enrichment) ranked by false discovery rate-corrected P value for 38 mRNAs dysregulated in both acute and CP+ groups. E, Unsupervised hierarchical clustering of 10 DE bdEV sRNAs (CP+ vs uninfected). Abbreviations: bdEV, brain tissue-derived extracellular vesicle; CP, central nervous system pathology; DE, differentially expressed; GO, gene ontology; mRNA, messenger RNA; PCA, principal component analysis; SIV, simian immunodeficiency virus; sRNAs, small RNA.
Numbers of Differentially Expressed Small RNAs in Group Comparisons
| Comparison | Up | Down |
|---|---|---|
| Acute vs uninfected | 71 | 6 |
| CP− vs uninfected | 0 | 0 |
| CP+ vs uninfected | 46 | 2 |
| CP+ vs CP− | 2 | 0 |
| Comparison | Up | Down |
|---|---|---|
| Acute vs uninfected | 71 | 6 |
| CP− vs uninfected | 0 | 0 |
| CP+ vs uninfected | 46 | 2 |
| CP+ vs CP− | 2 | 0 |
Group comparisons based on adjusted P < .05 by both DESeq2 and edgeR.
bdEV miRNA Dysregulation in SIV and CP+
Because of relatively small sample size and our previous findings of miRNA dysregulation in biofluids during retroviral infection [12, 31], we further ranked DE bdEV miRNAs based on unadjusted P value. As for other sRNAs, there were more miRNA differences in acute versus uninfected (n = 24) than for CP+/uninfected (n = 14) or CP+/CP− (n = 9) (Figure 3A and 3B). Only 3 miRNAs were dysregulated in both acute and CP+ versus uninfected, while 3 miRNAs were dysregulated in both CP+/uninfected and CP+/chronic (Figure 3B). Unsupervised clustering of 20 CP+ associated miRNAs suggested 2 miRNA clusters differed in CP+ and uninfected (Figure 3C). miRNA profiles of CP− are intermediate, with greater variance. qPCR confirmed that miR-19a-3p, let-7a-5p, and miR-29a-3p were less abundant during SIV infection (acute), and that miRs-146a-5p and -449a-5p were dysregulated in CP+ (Figure 3D).
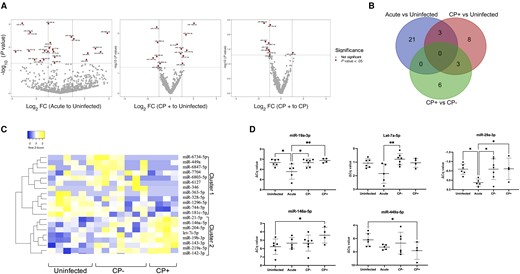
DE bdEV miRNAs in SIV infection. A, Volcano plots of bdEV miRNA log2FC and P value for acute/uninfected (left), CP+/uninfected (middle), and CP+/CP− (right). Dashe lines are thresholds for 2-fold change and P < .05. Significance of miRNAs was indicated based on non-adjusted P < .05. B, Venn diagrams of DE miRNAs (nonadjusted P < .05) in acute and CP+ versus uninfected and CP+ versus CP−. C, Unsupervised hierarchical clustering of 20 DE bdEV miRNAs of CP+ versus CP− and uninfected. D, qPCR validation for bdEV miR-19a-3p, let-7a-5p, miR-29a-3p, miR-146a-5p, and miR-449a-5p. ΔCq values were normalized to the geometric mean Cq value of internal references: miR-124-3p, miR-125b-5p, and miR-23b-3p. Data are presented as mean ± SD. *P ≤ .05, **P ≤ .01 by 2-tailed Welch t test. Abbreviations: CP, central nervous system pathology; Cq, quantification cycle; DE, differentially expressed; FC, fold change; miRNA, microRNA; qPCR, quantitative polymerase chain reaction; SIV, simian immunodeficiency virus.
BH circRNA Dysregulation in SIV Infection and CP +
BH RNAs were sequenced with and without RNase R treatment to identify mRNAs and circRNAs. PCA of both mRNA and circRNA profiles (Figure 4A) showed separation of acute BH from other groups, and uninfected from the 3 infection groups, indicating an influence of SIV infection (Figure 4A). Mirroring bdEV findings, most DE mRNAs in BH were found in acute versus uninfected (n = 245), followed by CP+/uninfected (n = 78, Figure 4B). No DE mRNAs were identified in CP+/CP− or CP−/uninfected. Sixty-nine mRNAs were consistently dysregulated in acute and CP+ versus uninfected (Figure 4B). The most DE circRNAs in BH were also found in the comparison of acute and uninfected (n = 19), followed by CP+ versus uninfected (n = 10), CP− versus uninfected (n = 10), and CP+ versus CP− (n = 4) (Figure 4B). However, only a few circRNAs were identified in more than one comparison (Figure 4B). Furthermore, linear RNAs corresponding to most DE circRNAs did not change significantly in SIV infection or CP+ (Figure 4C, grey). An exception was linear transcript IFI6, positively correlated with circ-IFI6_0001 (Figure 4C, red). qPCR confirmed dysregulation of circ-IFI6_0001, circ-EXOC2_0008, circ-PRKCE_0004, circ-PPP2R5A_0001, circ-RNF41_0003, and circ-ENC1_0001 in SIV-infected BH (Figure 4D).
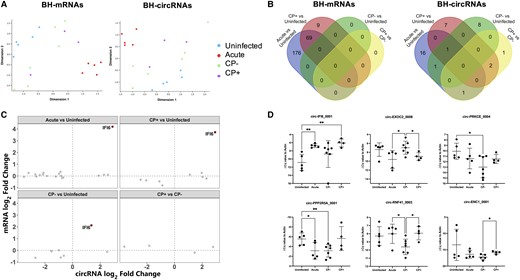
circRNA dysregulation in SIV-infected brain tissues. A, Multidimensional scaling analysis based on quantitative mRNA (left) and circRNA (right) BH profiles. B, Venn diagrams of differentially abundant mRNAs (left) and circRNAs (right) (adjusted P < .05) in acute, CP+, and CP− groups versus uninfected and CP+ versus CP−. C, Log2 fold change of circRNAs and corresponding linear mRNAs. IFI6, both circRNA and corresponding linear RNA are DE between groups, with adjusted P < .05. D, qPCR validation of BH circ-IFI6_0001, circ-EXOC2_0008, circ-PRKCE_0004, circ-PPP2R5A_0001, circ-RNF41_0003, and circ-ENC1_0001. ΔCq values were normalized to the Cq value of GAPDH. Data are presented as mean ± SD. *P ≤ .05, **P ≤ .01 by 2-tailed Welch t test. Abbreviations: BH, brain homogenate; circRNA, circular RNA; CP, central nervous system pathology; Cq, quantification cycle; mRNA, messenger RNA; qPCR, quantitative polymerase chain reaction; SIV, simian immunodeficiency virus.
bdEV Versus BH RNAs: SIV Infection
sRNAs significantly different (FDR < 0.05) in both bdEVs and BH, acute versus uninfected (n = 43; Figure 5A), and CP+ versus uninfected (n = 22; Figure 5B), were analyzed. A significant positive correlation of bdEVs and BH was observed for both acute versus uninfected (R = 0.836, P < .001) and CP+ versus uninfected (R = 0.647, P = .001) (Figures 5A and 5B). When comparing sRNA profiles between CP+ and CP−, 2 differentially abundant sRNAs, HLA-C and MX1, were identified only in bdEVs, not in BH. However, the pattern was consistent between bdEVs and BH, with a higher abundance in acute and CP+, and lower in uninfected and CP− (Supplementary Figure 3). Among 6 dysregulated BH circRNAs (Figure 4D), only circ-IFI6_0001 was found to be more abundant in CP+ for both bdEVs and BH by qPCR (Figure 5C). Its linear transcript, IFI6, was more abundant in acute and CP+ compared with uninfected (sequencing data), and for both bdEVs and BH (Figure 5C).
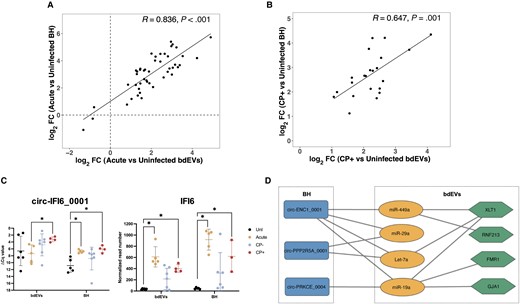
SIV-related mRNA and circRNA changes in bdEVs and BH. A, Correlations of sRNA log2FC in bdEVs and BH: acute versus uninfected. The linear regression line, pearson correlation coefficient (R), and significance (P) are shown for all DE sRNAs, acute versus uninfected. B, Correlations of sRNA log2FC in bdEVs and BH, CP+ versus uninfected. The linear regression line, pearson correlation coefficient (R), and significance (P) are shown for all DE sRNAs, CP+ versus uninfected. C, Levels of circ-IFI6_0001(left) and IFI6 (right) in bdEVs and BH. *Adjusted P < .05 per edgeR. D, Putative ceRNA network. The rectangle nodes represent circRNAs, the oval nodes represent miRNAs, and the hexagon nodes denote mRNAs. Edges are interactions between RNAs. Abbreviations: bdEVs, brain tissue-derived extracellular vesicle; BH, brain homogenate; circRNA, circular RNA; CP, central nervous system pathology; FC, fold change; mRNA, messenger RNA; SIV, simian immunodeficiency virus; sRNA, small RNA.
To identify possible ceRNA networks, qPCR-verified bdEV miRNAs (Figure 3D) and BH circRNAs (Figure 4D) were used for target prediction. miRanda predicted that 3 BH circRNAs (Figure 5D, blue) potentially bind with 4 bdEV miRNAs (Figure 5D, orange). The mRNA targets of these 4 miRNAs were predicted by TargetScan and miRDB (Supplementary Figure 4). These predicted mRNA targets were then compared with the mRNAs associated with infection, as determined by bdEVs sequencing data, resulting in the identification of 4 common mRNA targets (Figure 5D).
DISCUSSION
Roles of ceRNA networks in retrovirus-infected brain are largely undetermined. Here, we examined RNA profiles of bdEVs and BH in a model of HIV disease. Overall, sRNA and transcriptome differences were most pronounced in acute infection. However, important differences were also observed with chronic CNS pathology. Dysregulated mRNAs in bdEVs are involved in inflammation regulation and immune responses. Furthermore, ceRNA network analysis suggested that several brain circRNAs may affect bdEV miRNAs and mRNAs, warranting further investigation.
Whereas previous studies [31, 32] report more abundant plasma EVs during SIV infection, particle concentrations were lower in acute bdEV preparations. Virions themselves are unlikely to explain overall EV abundance in plasma or brain: despite coisolation with EVs [33], virions are insufficiently abundant even in acute infection to contribute to overall particle increases in plasma. Instead, cellular origins and uptake patterns in peripheral blood [6, 34] and brain [8, 35] may be responsible for the seemingly discrepant findings.
Previous studies of cell models revealed gene expression changes in HIV infection and HIV-associated neurocognitive disorders [36]. Here, acute infection and chronic pathology (CP+) samples, but not CP− samples, shared many mRNA differences, compared with uninfected. Eight signature bdEV mRNAs were dysregulated in CP+, encoding key immune system proteins, such as CD74 and HLA-DRA, involved in antigen processing and presentation [37], and interferon γ-inducible protein 16 (IFI16) [38], which modulates HIV transcription and latency reactivation [39] and senses retroviral DNA [38]. They are differentially abundant in both BH and bdEVs (Figure 5A and 5B), suggesting that CNS cells may use bdEVs to transfer antiviral elements.
miRNAs are also reportedly altered in HIV infection [40]. Here, several differences were verified by qPCR. Consistent with a previous report that let-7 miRNAs were less abundant in CD4+ T cells from HIV-1–infected progressors versus uninfected and long-term nonprogressors, less let-7a-5p was found in acute-phase bdEVs [41]. Because let-7 regulates PBMC immune responses via interleukin 10 (IL-10) [41] or other cytokines/chemokines [42], it could function similarly in CNS infection. miR-29a, previously found to be reduced in blood EVs during acute infection [31], may directly target HIV RNA to inhibit translation and replication [11], even during HIV latency [43]. Also correlated with SIV-associated CP were neuroinflammation-related miR-146a-5p [44] and brain development-related miR-449a-5p [45]. let-7a, miR-29a, and miR-449a were key components of a putative ceRNA network between BH and bdEVs (Figure 5D), indicating that levels in bdEVs, as well as those of target mRNAs, may be regulated by tissue circRNA expression.
Specific circRNAs that were DE in all infection groups compared with controls include qPCR-verified circ-PRKCE_0004, circ-PPP2R5A_0001, and circ-RNF41_0003, indicating persistent RNA dysregulation even in asymptomatic chronic infection. circ-IFI6_0001 and circ-EXOC2_0008 displayed dynamic changes during SIV infection/disease. circ-IFI6_0001 was more abundant in acute and CP+ groups but had similar levels in uninfected and CP− groups, while circ-EXOC2_0008 showed the reverse pattern. These differences indicate regulatory roles and biomarker potential in retroviral CNS infection. Among qPCR-verified circRNAs, circ-PRKCE_0004 and circ-ENC1_0001 may influence several bdEV miRNAs. Linear forms of some circRNAs have known function. IFI6 is an antiviral interferon-induced protein [46]. Exocyst complex component 2 (EXOC2) is involved in vesicle-mediated transport [47]. Both circular and linear IFI6 are consistently DE in BH and bdEVs, emphasizing that bdEVs may transfer viral infection regulators. Although several viruses reportedly affect circRNAs [48], we know of only one publication on circRNA in HIV [13]. Our findings thus provide additional evidence of circRNA dysregulation in retroviral infection. Further studies are now needed into regulatory mechanisms of these circRNAs in retroviral CNS infection and to assess biomarker and therapeutic potential.
In conclusion, we have identified mRNAs, miRNAs, and circRNAs linked to SIV infection and neuropathology, providing evidence of ceRNA network dysfunction in retroviral CNS disease. Our findings have several limitations: sample size was relatively small, the model may not recapitulate all aspects of HIV disease, not all targets were verified by qPCR, and different brain regions may be differently affected by viral infiltration and disease. Our results should thus be further explored and verified using larger cohorts, different brain regions, and in HIV infection.
Supplementary Data
Supplementary materials are available at The Journal of Infectious Diseases online (http://jid.oxfordjournals.org/). Supplementary materials consist of data provided by the author that are published to benefit the reader. The posted materials are not copyedited. The contents of all supplementary data are the sole responsibility of the authors. Questions or messages regarding errors should be addressed to the author.
Notes
Acknowledgments. The authors thank members of the Witwer Laboratory for discussions and support. We are particularly grateful to members of the Retrovirus Laboratory for access to samples from the animal models and helpful suggestions. Electron microscopy images were acquired in the Johns Hopkins University School of Medicine Institute for Basic Biomedical Sciences Microscope Facility. RNA sequencing was performed in the Johns Hopkins University School of Medicine Single Cell and Transcriptomics Core.
Author contributions. K. W. W., Y. H., and L. Z. conceived the idea. Y. H. performed most experiments and drafted and revised the manuscript text and figures. K. W. W. directed the project, obtained funding, supervised the experiments, and revised the manuscript. A. A., A. T., and M. B. performed small RNA and total RNA sequencing data analysis. S. Q. and C. M. A. processed macaque brain samples and performed Gag RNA and total DNA qPCR. A. T. and X. Z. optimized figures. All authors read and approved the final manuscript.
Financial support. This work was supported by the National Institutes of Health (NIH), National Institute on Drug Abuse (grant numbers DA040385 and DA047807 to K. W. W.); by 2 pilot grants awarded to Y. H. through the Johns Hopkins National Institute of Mental Health (NIMH) Center (supported by National Institute of Mental Health MH075673) and the Johns Hopkins University Center for AIDS Research (supported by National Institutes of Health/National Institute of Allergy and Infectious Diseases P30AI094189-01A1); and the National Science Foundation (grant number 2244127 to M. B.). The Witwer laboratory is also supported in part by National Cancer Institute/Common Fund (grant number CA241694); National Institute of Allergy and Infectious Diseases (grant number AI144997); National Institute of Mental Health (NIMH) (grant number MH118164); and the Johns Hopkins University Richman Family Precision Medicine Center of Excellence in Alzheimer’s Disease. Samples used in this study were derived in part from research supported by National Institutes of Health (NIH) (grant number U42OD013117 to Johns Hopkins pigtailed macaque breeding colony); National Institute of Neurological Disorders and Stroke (grant number NS089482 to Joseph L. Mankowski); and National Institute of Mental Health (NIMH) (grant number MH070306 to Janice E. Clements).
References
Author notes
Presented in part: International Society for Extracellular Vesicles 2023 Annual Meeting (May 20th, 2023, Seattle Convention Center, Seattle, Washington, USA).
Potential conflicts of interest. All authors: No reported conflicts. All authors have submitted the ICMJE Form for Disclosure of Potential Conflicts of Interest. Conflicts that the editors consider relevant to the content of the manuscript have been disclosed.

