


Abstract
Ebola virus (EBOV) causes lethal disease in ferrets, whereas Marburg virus (MARV) does not. To investigate this difference, we first evaluated viral entry by infecting ferret spleen cells with vesicular stomatitis viruses pseudotyped with either MARV or EBOV glycoprotein (GP). Both viruses were capable of infecting ferret spleen cells, suggesting that lack of disease is not due to a block in MARV entry. Next, we evaluated replication kinetics of authentic MARV and EBOV in ferret cell lines and demonstrated that, unlike EBOV, MARV was only capable of low levels of replication. Finally, we inoculated ferrets with a recombinant EBOV expressing MARV GP in place of EBOV GP. Infection resulted in uniformly lethal disease within 7–9 days postinfection, while MARV-inoculated animals survived until study endpoint. Together these data suggest that the inability of MARV to cause disease in ferrets is not entirely linked to GP.
The domestic ferret (Mustela putorius furo) has become increasingly popular in recent years as an animal model for characterizing filovirus pathogenesis and evaluating the efficacy of candidate vaccines and therapeutics [1]. Unlike rodent models, the ferret model provides the advantage of being susceptible to most wild-type filoviruses, eliminating the need for host adaptation [1]. Moreover, ferrets exhibit disease progression that closely recapitulates human filovirus disease (FVD). Indeed, ferrets have been shown to be highly susceptible to several ebolaviruses, namely, Ebola virus (EBOV) [2–5], Sudan virus (SUDV) [2, 6], Bundibugyo virus (BDBV) [2, 3], and Reston virus (RESTV) [7], all of which are uniformly lethal among infected animals. In contrast, Taï Forest virus is nonlethal among ferrets [8]. Unlike most ebolaviruses, however, inoculation with marburgviruses, namely, Marburg virus (MARV) and Ravn virus (RAVV), does not cause disease in ferrets [9, 10]. Although MARV-challenged ferrets have been shown to seroconvert after inoculation, none of the animals became viremic at any time point nor were there any disturbances observed in blood biochemistry or cell counts [9, 10].
The fact that ferrets are highly susceptible to lethal infection with certain ebolaviruses but not marburgviruses suggests that these viruses differ in their pathogenic mechanisms. It is likely that these differences can be attributed to variation in 1 or more aspects of the virus replication cycle, such as attachment, entry, replication, transcription, immune evasion, or egress. To investigate why MARV is non-pathogenic in ferrets, we chose to focus on the role of the glycoprotein (GP). As the sole viral protein expressed on the virion surface, GP plays an essential role in attachment to the host cell as well as entry into the cytosol via interaction with Niemann-Pick C1 (NPC1) [11]. Given its essential role in viral entry, we hypothesized that the lack of susceptibility by ferrets to lethal MARV infection is due to a block in GP-mediated viral entry.
Despite our hypothesis, we demonstrate here that MARV GP is, in fact, capable of mediating entry into ferret cells and that authentic MARV is capable of replication within these cells, albeit to lower levels than those observed for EBOV. Finally, we demonstrate that recombinant EBOV expressing MARV GP in place of EBOV GP (EBOV-mGP) is uniformly lethal among ferrets, suggesting that the inability of MARV to cause lethal disease in ferrets is not solely mediated by GP.
METHODS
Ethics Statement
All animal work involving infectious filoviruses was conducted in the containment level-4 (CL-4) facility at the Canadian Science Center for Human and Animal Health (CSCHAH) of the Public Health Agency of Canada in Winnipeg, Canada. All experiments were reviewed and approved by the Animal Care Committee of the CSCHAH in accordance with guidelines from the Canadian Council on Animal Care. Animals were acclimatized for a minimum of 7 days before infection, given food and water ad libitum, and monitored twice daily. Environmental enrichment was provided throughout the study.
Primary Culture of Ferret Cells
Male (n = 1) and female (n = 1) ferrets (Mustela putorius furo) weighing 0.65–0.7 kg were purchased commercially from Marshall BioResources (New York, USA) and acclimatized for at least 10 days before euthanasia and necropsy. Lung, heart, and spleen were harvested from each animal and stored on ice in prechilled processing media (Dulbecco's phosphate-buffered saline without calcium and magnesium [Cytiva, Marlborough, MA, USA] supplemented with penicillin [100 U/mL], streptomycin [100 μg/mL] [Thermo Fisher Scientific, Waltham, MA, USA], and 2.5 μg/mL amphotericin B [Thermo Fisher Scientific]). Adipose and necrotic tissues were excised from the harvested tissues, which were then sliced finely (∼2–3 mm) and washed twice with ice-cold processing media to remove excess blood and cell debris.
Tissue pieces from the heart and lungs were digested enzymatically with prewarmed 0.25% trypsin-EDTA (Thermo Fisher Scientific) at 37°C for 30 minutes on an orbital shaker set to ∼150–200 rpm. After digestion, tubes were placed upright for 5 minutes to allow the tissue slices to settle, and the supernatant was transferred through a 70-μm cell strainer into 2 mL heat-inactivated fetal bovine serum (HI-FBS) (VWR, Radnor, PA, USA). The resulting cell suspensions were subjected to centrifugation at 338 ×g for 5 minutes, and the cell pellet was resuspended in 2-mL culture media (Dulbecco's modified eagle medium [DMEM] high glucose [Cytiva] supplemented with penicillin [100 U/mL], streptomycin [100 μg/mL], 2.5 μg/mL amphotericin B, and 10% HI-FBS). The cell suspensions were transferred to T25 flasks and incubated at 37°C and 5% CO2. The enzymatic digestion process was repeated 2 additional times, with cell suspensions transferred to the same T25 flask each time.
Tissue pieces from the spleen were transferred through a 70-μm cell strainer into culture media to yield a single-cell suspension. The cell suspension was centrifuged at 338 ×g for 5 minutes, after which the cell pellet was resuspended in ACK lysis buffer (Thermo Fisher Scientific), incubated for 5 minutes at room temperature, and then centrifuged at 338 ×g for 5 minutes. The resulting supernatant was discarded, and the process was repeated an additional 2–3 times to eliminate red blood cells. The final cell pellet was resuspended in culture media, transferred to a T25 flask, and incubated at 37°C and 5% CO2.
Cells were washed with culture media 24 hours after initial seeding and maintained at 37°C and 5% CO2 until 80%–90% confluency, with the media changed every 2–3 days. Once confluent, cells were subcultured to a T75 flask and maintained in DMEM supplemented with 10% HI-FBS and devoid of antibiotics or antimycotic agents.
Development of Immortalized Ferret Cell Lines
Primary ferret cells were passaged at least twice before immortalization. Cells were transduced (25%–30% confluency) in the presence of 10 μg/mL polybrene with a lentivirus (multiplicity of infection [MOI] = 40) encoding the SV40 large T antigen as well as a neomycin resistance gene (Applied Biological Materials Inc., Richmond, BC, Canada). Cells were incubated for 48 hours at 37°C and 5% CO2, after which the virus inoculum was removed and cells were washed twice with DMEM. Cells were maintained in DMEM supplemented with 10% HI-FBS, and positively transduced cells were selected through multiple passages in the presence of the neomycin analogue Geneticin (G418) (Thermo Fisher Scientific) at concentrations of 1000–2000 μg/mL. Cells were incubated in the presence of G418 with selection media being changed every 3–4 days. Immortalized cells were cryopreserved in liquid nitrogen in 90% HI-FBS supplemented with 10% dimethyl sulfoxide.
Cells
Immortalized ferret spleen (mpfSpleen), heart (mpfHeart), and lung (mpfLung) cells were maintained in DMEM supplemented with 10% HI-FBS. Vero E6 cells (CRL-1586) were obtained from ATCC (Manassas, VA, USA) and maintained in DMEM supplemented with 10% HI-FBS and 1% L-glutamine. All cell lines were maintained in a humidified incubator at 37°C and 5% CO2 and tested negative for Mycoplasma contamination using the MycoAlert Mycoplasma Detection Kit (Lonza, Basel, Switzerland).
Viruses
Vesicular stomatitis virus (VSV)–EBOV, a recombinant VSV expressing GP from EBOV (variant Kikwit), and VSV-MARV, a recombinant VSV expressing GP from MARV (variant Angola), were previously rescued and used in this study for in vitro GP-permissibility studies at Passage (P)-2 and P3, respectively. The MARV variant Musoke was used for in vitro growth kinetics, and MARV variant Angola 325 was used for the in vivo ferret challenge. Both MARV stocks were used at P2, and sequence identities were confirmed by next-generation sequencing. Ebola virus (Ebola virus/H.sapiens-wt/GIN/2014/Makona-C07; GenBank accession number KT013257.3) was used in this study at P1 for in vitro growth kinetics and in vivo ferret challenge. The EBOV-mGP was rescued according to the methods described below, and a P2 working stock was used in this study for in vivo ferret challenge.
Glycoprotein-Permissibility Using Vesicular Stomatitis Virus Pseudotypes
mpfSpleen and Vero E6 cells were seeded in 24-well plates at densities of 1.75 × 10⁵, and 2.20 × 10⁵ cells/well, respectively, to achieve ∼90%–95% confluency after 24 hours. The following day, medium was aspirated, and the cells were infected at a MOI of 0.1 with either VSV-EBOV or VSV-MARV in 100 μL DMEM. Infections were incubated at 37°C and 5% CO2 for 1 hour with rocking every 15 minutes. After incubation, virus inoculums were aspirated, and cell monolayers were washed with 250 μL DMEM. After washing, 1 mL DMEM supplemented with 2% HI-FBS, 1% L-glutamine, and 1% penicillin/streptomycin was added to each well, and plates were incubated at 37°C and 5% CO2. Virus supernatants were harvested at 3, 6, 8, and 12 hours postinfection (hpi), and total ribonucleic acid (RNA) was extracted using the QIamp viral RNA minikit (QIAGEN, Hilden, Germany) according to the manufacturer's instructions. Viral RNA was quantified by reverse-transcription quantitative polymerase chain reaction (RT-qPCR) using the Lightcycler 480 RNA Master Hydrolysis probes kit (Roche, Basel, Switzerland) with primers and probes targeting VSV nucleoprotein (Table 1). The RT-qPCR reactions were done using a QuantStudio 3 Real-Time PCR system (Applied Biosystems, Waltham, MA, USA) with the following cycling conditions: 63°C for 3 minutes, 95°C for 30 seconds, followed by 45 cycles of 95°C for 15 seconds, 60°C for 30 seconds.
RT-qPCR Primer/Probe Sequences
| Target | Forward Primer (5′-3′) | Reverse Primer (5′-3′) | Probe |
|---|---|---|---|
| VSV-NP | CGGAGGATTGACGACTAATGC | TCAAACCATCCGAGCCATTC | CY5-CCGCCACAAGGCAGAGATGTGGT |
| MARV L | GCAAAAGCATTCCCTAGTAACATGA GCGAAGGCATTCCCTAGTAATATGA | CACCCCTCACTATRGCGTTYTC CACCTCTTACTATGGCATTCTC | FAM-TGGCACCAYAATTCAGCAAGCATAGG |
| EBOV L | CAGCCAGCAATTTCTTCCAT | TTTCGGTTGCTGTTTCTGTG | FAM-ATCATTGGCGTACTGGAGGAGCAG FAM-TCATTGGCGTACTGGAGGAGCAGG |
Abbreviations: EBOV, Ebola virus; MARV, Marburg virus; NP, nucleoprotein; RT-qPCR, reverse-transcription quantitative polymerase chain reaction; VSV, vesicular stomatitis virus.
Rescue of Recombinant Chimeric EBOV-mGP
The full-length complementary deoxyribonucleic acid (cDNA) clone of the EBOV-mGP chimeric virus was constructed based on the previously described rgEBOV-C07 [5] by swapping the rgEBOV-C07 GP with MARV Angola GP (GenBank accession number KY047763.1). For this purpose, 3 PCR fragments were amplified using primer pairs eGP-PmlI-IFF (5′-ACAGGATTGTGACACGTGTC-3′)/EbMARV-1R (5′-GTGGTTTTCATTGTGTTGTCGCCTCACAATATC-3′), EbMARV-2F (5′-CGACAACACAATGAAAACCACATGTCTCCTTA-3′)/EbMARV-2R (5′-CTGAAGAAAGA TTATCCAATATATTTAGTAAAAATACG-3′), and EbMARV-3F (5′-ATATATTGGATAATCTTTCTTCAGAT TGTTTCACG-3′)/eGP-SacI-IFR (5′-TTGT CGGGTTCTTGGAGCTC-3′), respectively, with the rgEBOV-C07 plasmid or MARV Angola cDNA as templates and pieced together into 1 PCR fragment using overlapping PCR, which was then ligated into PmlI/SacI-digested rgEBOV-C07 vector to replace the PmlI-SacI fragment of EBOV using In-Fusion HD cloning plus kit (Takara Bio Inc., Kusatsu, Shiga, Japan). The rescue of infectious EBOV-mGP chimeric virus was performed as previously described for rgEBOV-C07 [5] using the same helper plasmids.
Growth Kinetics on Ferret Cell Lines
Before infection, mpfSpleen, mpfHeart, mpfLung, and Vero E6 cells were seeded in 24-well plates at densities of 1.75 × 10⁵, 3.25 × 10⁵, 1.5 × 10⁵, 2.2 × 10⁵ cells/well, respectively, in the aforementioned media to achieve a confluency of ∼85%–90% after 24 hours. The following day, media was aspirated, and the cells were infected at an MOI of 0.1 with either MARV Musoke or EBOV Makona C07 in 250 μL DMEM. Infections were incubated at 37°C and 5% CO2 for 1 hour with rocking every 15 minutes to allow for virus adsorption. After 1 hour, virus inoculum was removed and replaced with 1 mL DMEM supplemented with 1% FBS, 1% penicillin/streptomycin (ferret cells), or DMEM supplemented with 1% HI-FBS, 1% L-glutamine, and 1% penicillin/streptomycin (Vero E6 cells). Supernatants were harvested at 3, 7, and 14 days postinfection (dpi) for virus quantification.
Animals
Male (n = 5) and female (n = 5) ferrets (Mustela putorius furo) ∼5–6 months old and weighing approximately 0.65–0.7 kg were purchased from Marshall BioResources and implanted with an IPTT-300 temperature and ID transponder (BioMedic Data Systems Inc., Seaford, DE, USA). After acclimatization, ferrets were randomly assigned into groups containing equal numbers of males and females and inoculated with either EBOV-mGP (n = 6), EBOV (n = 2), or MARV (n = 2) at a target dose of 1000 median tissue culture infectious dose (TCID50) via the intramuscular route. Virus inoculums were prepared in DMEM and administered equally at 2 sites (250 μL/rear quadricep). Animals were monitored daily for clinical signs of disease including changes in body weight, temperature, physical activity, and food/water intake. Animals that reached the clinical scoring criteria for humane endpoint were euthanized. Whole blood and serum were collected at −1 (blood only), 3, 5, 7, 10, and 14 dpi, as well as at time of euthanasia, to evaluate virus loads. Oral and rectal swabs, as well as nasal washes, were collected at the aforementioned time points. Tissues, including liver, spleen, kidney, heart, testes, ovaries, eyes and brain, were harvested at time of necropsy from all animals for downstream viral titration.
Quantification of Viral Ribonucleic Acid by Reverse-Transcription Quantitative Polymerase Chain Reaction
Total RNA was extracted from whole blood as well as oral/rectal swabs and nasal washes using the QIamp viral RNA minikit (QIAGEN) according to the manufacturer's instructions with the sole modification being that for whole blood a second AW1 wash was performed. Total RNA was extracted from 30 mg of homogenized tissues using the RNeasy Kit, according to the manufacturer's instructions (QIAGEN). Levels of viral RNA were quantified by RT-qPCR using the TaqPath 1-Step Multiplex Master Mix (Applied Biosystems) according to the manufacturer's protocol using primers and probes targeting either EBOV L or MARV L (Table 1). The RT-qPCR reactions were done using a QuantStudio 5 Real-Time PCR system with the following thermocycling conditions: 25°C for 2 minutes, 53°C for 10 minutes and 95°C for 2 minutes, followed by 40 cycles of 95°C for 3 seconds, and 60°C for 30 seconds.
Quantification of Infectious Virus by Median Tissue Culture Infectious Dose
Vero E6 cells were seeded in 96-well plates at a cell density of 2.0 × 10⁴ cells/well to achieve a confluency of 90%–95% after 24 hours. The following day, medium was aspirated and replaced with DMEM supplemented with 1% HI-FBS, 1% L-glutamine, and 1% penicillin/streptomycin. Tissues (liver, spleen, kidney, heart, lung, testes, and brain) were homogenized in 750 μL DMEM containing a 5-mm steel bead using the Bead Ruptor Elite (Omni International, USA) and clarified by centrifugation. Whole blood or clarified tissue homogenate (40 μL) was diluted in 360 μL DMEM supplemented with 1% HI-FBS, 1% L-glutamine, and 1% penicillin/streptomycin and serially diluted 10-fold (10−1–10−8). Diluted samples (100 μL) were added to the Vero E6 cells and incubated at 37°C and 5% CO2 for 14 days, at which time cytopathic effects were observed. The TCID50 reported as TCID50/mL for blood and TCID50/g were calculated using the Reed-Muench method.
Data Analysis
All RT-qPCR data were gathered and analyzed using the QuantStudio Design and Analysis Software (Applied Biosystems). All graphs and statistics were generated using GraphPad Prism 9.5.1. Statistical analyses for VSV and growth kinetics were performed using a two-way analysis of variance Tukey's multiple comparisons test, with individual variances computed for each comparison. P values are indicated as follows: >.05 (ns), ≤.05 (*), ≤.01 (**), ≤.001 (***), and ≤.0001 (****).
RESULTS
Ferret Spleen Cells Are Permissible to Marburg Virus Glycoprotein-Mediated Entry
Given that viral attachment and entry are the earliest stages of the filovirus replication cycle, we first set out to investigate whether ferret spleen cells were permissible to MARV GP-mediated entry. Ferret spleen cells were inoculated at an MOI of 0.1 with either VSV-EBOV or VSV-MARV, and supernatant was harvested at 3, 6, 8, and 12 hpi to quantify levels of viral RNA. Viral RNA was detectable in the supernatant of ferret spleen cells infected with VSV-MARV at all time points, indicating that MARV GP is capable of mediating entry into these cells (Figure 1). The same results were observed in Vero E6 cells (Figure 1). It is interesting to note that levels of VSV-EBOV RNA were slightly but significantly higher than VSV-MARV in the supernatant of ferret spleen cells and Vero E6 cells at 3 hpi (Figure 1), suggesting that EBOV GP may be more efficient at mediating entry during early stages of infection. No significant difference among levels of viral RNA could be seen beyond 12 hpi (data not shown), which was expected given the rapid replication kinetics of VSV.
Quantification of viral ribonucleic acid (RNA) in supernatant of cells inoculated with vesicular stomatitis virus (VSV) pseudotypes. Ferret spleen (mpfSpleen) and Vero E6 cells were inoculated with either VSV–Ebola virus (EBOV) or VSV–Marburg virus (MARV) at a multiplicity of infection of 0.1 and levels of viral RNA quantified at 3, 6, 8, and 12 hours postinfection (hpi) in supernatant. Mean levels ± standard deviation of viral RNA in genome equivalents per mL (GEQ/mL) are depicted as histograms, with the individual technical replicates depicted as dots.
Marburg Virus Is Capable of Replicating in Ferret Cells
Although ferret spleen cells were found to be permissible to MARV GP-mediated viral entry, we wanted to investigate whether ferret cells could support replication of authentic MARV. Ferret spleen, lung, and heart cells, along with Vero E6 cells, were inoculated at an MOI of 0.1 with MARV or EBOV, and levels of viral RNA and infectious virus were quantified in supernatant at 3, 7, and 14 dpi. Not surprisingly, peak levels of virus RNA and infectious virus were highest among Vero E6 cells, which are highly permissive to both EBOV and MARV. All ferret cell lines supported replication of EBOV, with levels of viral RNA reaching ∼9 log10 genome equivalents (GEQ)/mL after 14 dpi (Figure 2A). Infectious EBOV could also be detected across all ferret cell lines, which showed an increase in titers from 3 to 14 dpi (Figure 2C). For MARV, viral RNA was detected in all ferret cell lines at all time points, although the increases over time were modest, particularly for the spleen cells (Figure 2B). Indeed, with the exception of a single replicate at 3 dpi, no infectious MARV was recovered from the spleen cells, suggesting that this cell line does not support MARV replication (Figure 2D). In contrast, ferret lung cells showed significantly elevated levels of infectious MARV at 14 dpi relative to 3 dpi (Figure 2B). Despite ferret heart cells showing an increase in MARV viral RNA over time, the increase in infectious titers was much less pronounced (Figure 2D).
Replication kinetics of Ebola virus (EBOV) and Marburg virus (MARV) in ferret cell lines. A–D, Ferret spleen (mpfSpleen), lung (mpfLung), heart (mpfHeart), and Vero E6 cells were inoculated with EBOV (A and C) or MARV (B and D) at an multiplicity of infection of 0.1; virus ribonucleic acid (RNA) within the supernatant was quantified by RT-qPCR (A and B), and infectious virus within the supernatant was quantified by median tissue culture infectious dose (TCID50) (C and D) at 3, 7, and 14 days postinfection (dpi). Mean levels ± standard deviation of viral RNA in genome equivalents per mL (GEQ/mL) or mean tissue culture infectious dose per mL (TCID50/mL) are depicted as histograms, with the individual technical replicates depicted as dots.
EBOV-mGP Is Uniformly Lethal Among Infected Ferrets
With our in vitro data confirming that MARV GP is capable of mediating entry into ferret cells and that authentic MARV can replicate (albeit modestly) in at least 2 different ferret cell lines, we next set out to evaluate the role of MARV GP in virus pathogenesis. To begin, we generated a recombinant EBOV-mGP. All ferret cell lines and Vero E6 cells were confirmed to support genome replication of EBOV-mGP in vitro, with levels of viral RNA reaching ∼9 log10 GEQ/mL after 14 dpi (Supplementary Figure 1). It is interesting to note that these levels were slightly—albeit significantly—lower than those observed for EBOV at 3, 7, and 14 dpi across all cell lines, suggesting that EBOV-mGP may have slower growth kinetics than EBOV.
To confirm the involvement of MARV GP in vivo, ferrets (n = 6) were inoculated with EBOV-mGP. A group of control ferrets were inoculated with EBOV (n = 2) or MARV (n = 2). The target inoculation dose was 1000 TCID50, and back titration revealed actual doses to be 734, 500, and 2180 TCID50 for EBOV-mGP, EBOV, and MARV, respectively. EBOV-mGP resulted in uniform lethality, with most animals (5 of 6) reaching the humane endpoint on 7 dpi and 1 animal found dead on 9 dpi (Figure 3A). By comparison, all control animals inoculated with EBOV reached the humane endpoint on 4 dpi (Figure 3A). Ferrets challenged with EBOV-mGP developed severe disease that paralleled what was observed in the EBOV-challenged ferrets, with all animals exhibiting weight loss, elevated temperatures (Figure 3B and C), decreased activity, and ruffled fur. A petechial rash, which represents a hallmark feature of FVD within the ferret model, was also observed among EBOV-mGP animals, consistent with what was observed in the EBOV-challenged control animals. Conversely, none of the animals inoculated with MARV succumbed to disease nor did they manifest any clinical signs of disease, with temperatures remaining within the normal range and a net gain in weight (Figure 3). Nonetheless, these 2 control animals seroconverted, with mean MARV GP-specific immunoglobulin G endpoint titers of 1:800 at 14 dpi.
Clinical parameters of infected ferrets. (A) Survival curves, (B) percent weight change, and (C) temperature. Data shown as group means with error bars reflecting standard deviation. Pre, preinfection.
To assess the progression of disease, blood samples, oral and rectal swabs, and nasal washes were collected from animals and subjected to RT-qPCR to quantify levels of viral RNA. Animals challenged with EBOV-mGP first exhibited virus RNA in the blood at 5 dpi, with a mean level of 3.10 log10 GEQ/mL that increased to 6.79 log10 GEQ/mL on 7 dpi (Figure 4A). A blood sample was not obtained from the single animal that succumbed to disease on 9 dpi. The swabs and nasal washes were all negative for virus RNA in EBOV-mGP infected animals at 3 and 5 dpi (Figure 4B–D). At 7 dpi, oral swabs from 3 of 6 animals exhibited low levels of viral RNA, with a mean level of 3.03 log10 GEQ/mL (Figure 4B). Similarly, rectal swabs from 4 of 6 animals were positive at 7 dpi, with a mean viral RNA level of 3.51 log10 GEQ/mL, whereas RNA was detected in the nasal washes of only a single animal at a level of 3.41 log10 GEQ/mL (Figure 4C and D). Oral swabs (2.54 log10 GEQ/mL), rectal swabs (6.28 log10 GEQ/mL), and nasal washes (2.54 log10 GEQ/mL) were all positive for viral RNA in the single animal found dead on 9 dpi (Figure 4B and D). By comparison, the control animals challenged with EBOV had very high levels of virus RNA in the blood, with a mean level of 7.79 log10 GEQ/mL at 3 dpi that increased to 9.95 log10 GEQ/mL a day later at the time of euthanasia (Figure 4A). Swabs and nasal washes were all negative at 3 dpi but positive at 4 dpi, with mean values of 4.14, 6.00, and 3.25 log10 GEQ/mL, respectively (Figure 4B and D). As expected, no virus RNA was detected at any time point in any sample from the control animals challenged with MARV.
Viral RNA levels in blood, oral/rectal swabs, and nasal washes of infected ferrets. (A) Whole blood, (B) oral swabs, (C) rectal swabs, and (D) nasal washes were collected from each animal at 3, 5, 7, 10, and 14 days postinfection (dpi) as well as at time of euthanasia to evaluate viremia and viral shedding by reverse-transcription quantitative polymerase chain reaction. Results are depicted in genome equivalents per mL (GEQ/mL) for each animal (indicated by a square, triangle, or circle), with mean values depicted by a line.
Tissues harvested at time of euthanasia, including liver, spleen, kidney, heart, lung, testes, ovaries, brain, and eye, were assessed for the presence of viral RNA and infectious virus to evaluate viral dissemination. All tissues from animals infected with EBOV-mGP or EBOV were positive for both viral RNA and infectious virus (Figure 5). In most cases, RNA and virus levels were higher among the EBOV-challenged control animals than among those challenged with EBOV-mGP (Figure 5A), with the highest overall levels of virus observed in the liver and spleen (Figure 5A). Ovaries and eyes were not evaluated for the presence of infectious virus due to insufficient tissue material. All tissues collected from MARV-inoculated animals were negative for both viral RNA and infectious virus (Figure 5).
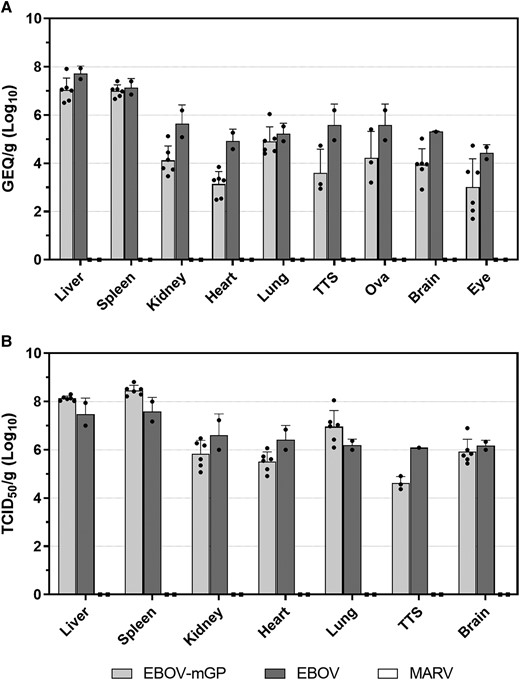
Viral load in tissues of infected ferrets. (A and B) Liver, spleen, kidney, heart, lung, testes (TTS), ovaries (Ova), eyes, and brain samples were harvested at time of necropsy; virus RNA was quantified by reverse-transcription quantitative polymerase chain reaction (A) and infectious virus was quantified by mean tissue culture infectious dose (TCID50) (B). Mean levels ± standard deviation of viral RNA in genome equivalents per gram (GEQ/g) or TCID50/g are depicted as histograms, with data from each animal depicted as dots.
DISCUSSION
Despite the ferret being uniformly susceptible to infection with several different ebolaviruses—namely, EBOV, SUDV, BDBV, and RESTV—repeated studies have demonstrated that the same is not true for the closely related marburgviruses, MARV and RAVV. This is surprising given that ebolaviruses and marburgviruses cause severe, often fatal, disease in both humans and nonhuman primates that is at least superficially similar. Given the key role that MARV and EBOV GP plays in the virus replication cycle, we sought to investigate MARV GP as a potential contributing factor to the absence of MARV pathogenesis in the ferret.
Using pseudotyped recombinant VSVs, ferret spleen cells were found to be permissible to EBOV GP-mediated entry. This was not unexpected given that ferrets are highly susceptible to infection with EBOV, and it therefore follows that ferret cells should be permissible to VSV pseudotyped with EBOV GP. It is interesting to note that the ferret spleen cells were also found to support entry of VSV-MARV, suggesting that MARV GP is capable of not only interacting with host cell attachment factors but also mediating entry into the host cell, presumably via binding to ferret NPC1, which shares ∼90% identity with human NPC1 (Supplementary Figure 2). It is notable that at only 3 hpi, we did observe VSV-EBOV RNA levels that were slightly—but significantly—higher than VSV-MARV RNA levels in both ferret spleen cells and Vero E6 cells. It is possible that this is due to a difference in the efficiencies with which these 2 GPs interact with potential host cells, and it is tempting to speculate that a less efficient MARV GP could, in part, contribute to the lack of disease observed in ferrets. Indeed, this interpretation is in line with previous work demonstrating that filovirus GPs differ in their ability to mediate entry into cell lines of various species based on a differential ability to engage diverse host-cell entry factors [12]. Nevertheless, we also cannot rule out the possibility that the difference in viral RNA levels we observed was an artifact linked to residual input virus. In the future, it will be of particular interest to directly evaluate the differences in binding efficiencies of various filovirus GPs to ferret NPC1 as well as host-cell attachment factors.
Although VSV pseudotyped with MARV GP was capable of entering and replicating in ferret spleen cells, the same cells did not seem to support replication of authentic MARV. We observed a modest increase in MARV RNA over the course of a 14-day infection in ferret spleen cells, yet essentially no infectious virus was detected. These results were even more striking given that ferret lung cells had nearly identical levels of virus RNA (particularly at 3 and 7 dpi) but also supported the production of infectious MARV. Like the lung cells, the ferret heart cells also supported MARV replication and the production of infectious virus, suggesting that the block in virus replication was exclusive to the spleen cells. The fact that the spleen cells were permissive to MARV GP-mediated entry and supported modest genome replication/transcription despite not producing infectious MARV suggests that a block exists later in the virus replication cycle, perhaps affecting virus immune evasion or virion egress. Whether our observations in the ferret spleen cells are linked to the absence of disease caused by MARV in ferrets is unclear and will require additional investigation. However, it is also worth noting that, in general, MARV replicated more poorly in all 3 ferret cell lines than did EBOV, which is in line with in vivo observations and may suggest that the reasons for the differences in ferret pathogenesis between EBOV and MARV are multifactorial.
All ferrets infected with EBOV-mGP succumbed to disease, providing unequivocal evidence that MARV GP is capable of mediating entry into ferret cells. It is interesting to note, however, that the onset of viremia in EBOV-mGP-challenged animals was delayed compared with the EBOV-challenged animals, and peak levels of EBOV-mGP RNA were also much lower. Similar trends were observed in the oral/rectal swabs and nasal washes, which showed consistently lower and later RNA levels among animals challenged with EBOV-mGP than those challenged with EBOV. Furthermore, the majority of tissue samples taken from EBOV-mGP-challenged animals showed levels of virus RNA and infectious virus that were lower than what was observed in EBOV-challenged animals. In addition, the delays observed in vivo reflected the in vitro growth properties of EBOV-mGP, which exhibited slower replication kinetics compared with EBOV. Thus, although MARV GP may not be the sole factor responsible for the lack of disease in MARV-challenged ferrets, these data support the possibility that it is a contributing factor.
It is important to note that our study has a few key limitations. In general, dissecting the ferret host response to filovirus infection is difficult, both in vitro and in vivo, primarily because of a lack of commercially available reagents. For our in vitro analyses, we recognize that the ferret cells we used in this study—although derived from ferrets—have yet to be fully characterized. A better understanding of these cell lines would improve our ability to make specific conclusions about our data, but work to characterize the cell lines in depths is ongoing. For our in vivo analyses, we currently lack the tools and reagents to perform a more comprehensive analysis of the host response to infection, but we hope that continued work in the ferret model, by us and others, will improve the capabilities of the field.
Taken together, our in vitro and in vivo data provide insight into the role that MARV GP plays in the context of a ferret infection. First, it is evident that MARV GP is capable of mediating entry into ferret cells. This ultimately indicates that ferret cells support all stages of filovirus GP-mediated entry including attachment, uptake, cleavage of GP via cysteine proteases, binding with NPC1 and subsequent fusion with the host cell endosomal membrane. Second, MARV infection appears to be hindered—at least to some degree—in ferret cells, a conclusion supported both by the cell-type specific restriction of MARV and the delayed kinetics of EBOV-mGP infection in ferrets. Third, the absence of disease among MARV-challenged ferrets cannot be exclusively linked to GP. Therefore, if GP is not the only factor involved in the absence of disease in ferrets, what other factors may play a role? Based on our data, we speculate that the most obvious factors are related to innate immune evasion or virion egress. In particular, both EBOV and MARV inhibit the JAK-STAT signaling pathway, which is responsible for upregulating the expression of numerous antiviral proteins in response to type I interferons; however, each virus uses a distinct inhibitory mechanism [13]. In the case of EBOV, VP24 blocks the nuclear import of STAT1, whereas in the case of MARV, VP40 blocks the upstream activation of JAK1. Perhaps the inability of MARV, but not EBOV, to cause disease in ferrets is linked to the mechanistic differences in the innate immune evasion tactics between these 2 viruses. Although the lack of ferret-specific reagents complicates investigations into these cell signaling pathways, future investigations should focus on elucidating the role of MARV VP40 in viral pathogenesis within the ferret model.
Finally, as expected, all animals challenged with MARV survived the duration of the study with no observable signs of disease nor any detectable viremia. This is consistent with previous studies that have demonstrated that ferrets do not develop disease regardless of MARV challenge route, variant, and dose [9, 10]. Recent evidence has demonstrated that filoviruses can persist in immune privileged niches [14], and as such we investigated ovaries/testes, eyes, and brain for the presence of MARV in case virus existed in these niches despite not being present in the blood, swabs, or tissues. No evidence of infectious MARV or MARV RNA was detected. These results confirm, again, that MARV is incapable of causing disease in ferrets, and they further suggest that ferrets may not even be susceptible to productive MARV infection.
CONCLUSIONS
Overall, these findings provide additional insight into the critical differences between the pathogenic mechanisms of EBOV and MARV. Future investigations into these differences could prove useful for identifying novel therapeutic targets as well as advancing our understanding of filovirus biology.
Supplementary Data
Supplementary materials are available at The Journal of Infectious Diseases online. Consisting of data provided by the authors to benefit the reader, the posted materials are not copyedited and are the sole responsibility of the authors, so questions or comments should be addressed to the corresponding author.
Notes
Author contributions. ZS, LB, and WC conceptualized and designed the study. ZS, LG, KNT, LB, JES, SH, and WC conducted in vivo experiments in containment level (CL)-4. KT and KA conducted animal husbandry. WC cloned and rescued EBOV-mGP. ZS developed ferret cell lines and conducted vesicular stomatitis virus experiments in CL-2. ZS, LG, KNT, and KE conducted sample processing. ZS and LB conducted data analysis. ZS wrote and prepared the original manuscript draft. All authors participated in review and editing of the manuscript.
Financial support. This research was funded by the Public Health Agency of Canada.
Supplement sponsorship. This article appears as part of the supplement “10th International Symposium on Filoviruses.”
References
Author notes
Potential conflicts of interest. All authors: No reported conflicts of interest.

