


Abstract
Human immunodeficiency virus type 1 (HIV-1) infection is treated with antiretroviral therapy (ART), usually consisting of 2–3 different drugs, referred to as combination ART (cART). Our recent randomized clinical trial comparing a switch to dolutegravir monotherapy with continuation of cART in early-treated individuals demonstrated sustained virological suppression over 48 weeks. Here, we characterize the longitudinal landscape of the HIV-1 reservoir in these participants, with particular attention to potential differences between treatment groups regarding evidence of evolution as a proxy for low-level replication. Near full-length HIV-1 proviral polymerase chain reaction and next-generation sequencing was applied to longitudinal peripheral blood mononuclear cell samples to assess proviral evolution and the potential emergence of drug resistance mutations (DRMs). Neither an increase in genetic distance nor diversity over time was detected in participants of both treatment groups. Single proviral analysis showed high proportions of defective proviruses and low DRM numbers. No evidence for evolution during dolutegravir monotherapy was found in these early-treated individuals.
After infection with human immunodeficiency virus type 1 (HIV-1), an HIV-1 reservoir is established, mainly in CD4+ T cells [1, 2]. The reservoir is established early after infection and persists lifelong despite antiretroviral therapy (ART), making it the main barrier to cure [3, 4]. In addition to the longevity of infected cells, 2 mechanisms for HIV-1 reservoir maintenance have been intensely discussed: low-level replication and/or clonal expansion [5, 6]. Low-level replication under suppressive ART leading to virus evolution has been debated as a maintenance mechanism for the HIV-1 reservoir and was investigated in several studies with conflicting results: Numerous studies showed no proviral diversity increase over time, no decrease of persistent viremia after treatment intensification, and rebound virus originating from homogenous populations present before ART, indicating that HIV evolution caused through low-level replication is arrested during successful ART [7–9]. In contrast, other studies show evidence for persistent HIV-1 replication in the lymphatic tissue and potential subsequent trafficking into the blood despite ART [10, 11]. The second mechanism, clonal expansion, is thought to be one of the principal mechanisms that maintain the reservoir [9, 12]. Clonally expanded cells can account for a large proportion of latently infected cells and can carry replication-competent provirus [5, 13, 14]. Clonal expansion and immune-mediated cell death lead to a dynamic reservoir landscape but no “directional” evolution under suppressive treatment [15]. Landscape analysis of the HIV-1 reservoir revealed that the majority of integrated proviruses are defective, with only 2%–12% of proviruses being intact and replication-competent [16, 17]. Defective proviruses have more intensely been characterized in the last years, revealing that different defects lead to replication incompetency. Defects include hypermutations caused by APOBEC, packaging signal deletions or mutations, inversions or nonsense mutations, and large internal deletions [16, 17]. However, the HIV-1 reservoir appears stable over time with a very slow decay rate in the majority of (but not all) individuals, which necessitates lifelong treatment [4, 7, 18].
Combination ART (cART) using 3 drugs to treat HIV-1 infection has been the standard of care for the last 25 years [19]. Toxicity, side effects, drug–drug interactions, and high costs to the health system have led to various simplification strategies being tested, among them dolutegravir (DTG) dual therapy [20–23] or monotherapy [23–26]. DTG belongs to the integrase strand transfer inhibitor (INSTI) drug class, has a favorable pharmacokinetic profile, and—most important—is highly potent with a high barrier to genetic resistance [27]. In our randomized clinical trial (RCT), the Early Simplified Study (ESS), we assessed DTG monotherapy in selected individuals who were treated early (<180 days) after infection with cART and were virologically suppressed for at least 48 weeks before switching to DTG monotherapy. We found that DTG monotherapy was noninferior to cART, presenting no viral failure in the per-protocol analysis after 48 and up to 192 weeks [26, 28]. In contrast, 3 RCTs enrolling individuals who were chronically infected when ART was started found DTG monotherapy to be inferior to cART [29–31]. In contrast to the 3 RCTs that failed, individuals in our study initiated ART during primary infection and thus had a smaller reservoir size and a more homogenous virus population compared with individuals who initiated ART in the chronic phase. These criteria were associated with success of DTG monotherapy in a meta-analysis of the 4 RCTs [32]. Our aim was to investigate the landscape, dynamics, and persistence of the HIV-1 reservoir including assessment of potential low-level replication and emergence of drug resistance mutations (DRMs) when comparing DTG monotherapy to cART.
METHODS
ESS and Peripheral Blood Mononuclear Cell Samples
The ESS (NCT00537966) enrolled 101 people with HIV (PWH) from the Zurich Primary HIV Infection Study and Swiss HIV Cohort Study. Inclusion criteria and details are published elsewhere and written informed consent was obtained for all study participants [26]. We used peripheral blood mononuclear cells (PBMCs) or co-culture virus from 4 different time points: (i) at ART start (as), obtained as previously described [33, 34]; (ii) 1 year after ART start (1yaas); (iii) ESS week 0 (ESS wk0); and (iv) ESS week 48 (ESS wk48) (Figure 1A).
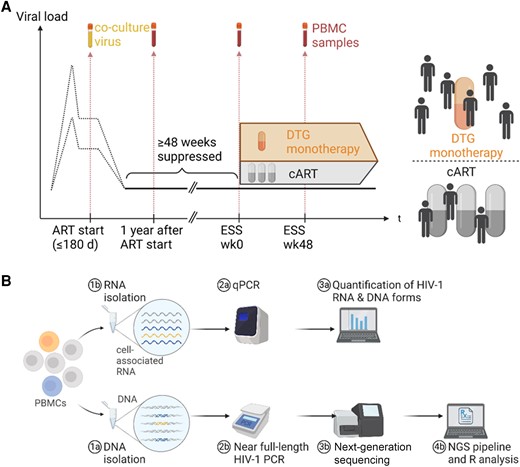
Study design and establishment of near full-length polymerase chain reaction (PCR) and next-generation sequencing. A, Longitudinal viral load and sample time points used for sequencing. At Early Simplified Study (ESS) week 0, participants were randomly assigned to dolutegravir monotherapy or combination antiretroviral therapy (cART). The 4 selected time points were: ART start, 1 year after ART start, ESS week 0, and ESS week 48. B, Workflow showing DNA and RNA isolation from peripheral blood mononuclear cells (PBMCs) with subsequent steps until data analysis. From 5 million PBMCs, an estimated input of 10–420 infected cell equivalents for bulk proviral sequencing and 3–120 infected cell equivalents for quantitative PCR was used. Abbreviations: ART, antiretroviral therapy; cART, combination antiretroviral therapy; DTG, dolutegravir; ESS wk0, Early Simplified Study week 0; ESS wk48, Early Simplified Study week 48; HIV-1, human immunodeficiency virus type 1; NGS, next-generation sequencing; PBMCs, peripheral blood mononuclear cells; qPCR, quantitative polymerase chain reaction.
DNA and RNA Isolation, Complementary DNA Synthesis, and HIV-1 Quantification
DNA and RNA was simultaneously isolated from 5 million PBMCs using AllPrep Mini kit (Qiagen) according to the manufacturer's instructions followed by complementary DNA synthesis. Quantification of HIV-1 unspliced RNA, HIV-1 multiply spliced RNA, and HIV-1 2-LTR circles was performed as previously described [35] (Supplementary Appendix 1).
Near Full-Length HIV-1 Proviral Polymerase Chain Reaction and Next-Generation Sequencing
Near full-length HIV-1 proviral polymerase chain reaction (PCR) was performed as previously published [36] with 2 additional approaches using the same experimental conditions to increase amplification success: approach 2 (a first and second hemi-length PCR amplifying a 5′ and a 3′ amplicon) and approach 3 (a first and second nested near full-length PCR) (Supplementary Figure 1, Supplementary Table 1). For each sample, the PCR approach with a positive result was used for next-generation sequencing (NGS). DNA isolation, PCR, and NGS for participants’ different time points were performed stricktly separately, as a precaution to avoid contamination.
Single HIV-1 Genome Dilution and Amplification
Individuals for single HIV-1 genome analysis were selected (Supplementary Appendix 2) and DNA was isolated from 5 million cells, using the DNeasy blood and tissue kit (Qiagen), according to the manufacturer's instructions. DNA was diluted to single provirus according to droplet digital PCR results [26] and Poisson distribution, and whole genome amplification was performed using the REPLIg Midi Kit (100) (Qiagen), according to the manufacturer's instructions. Each well with amplified DNA was subjected to PCR, and HIV-1 PCR-positive wells were sequenced as described above.
NGS Analysis
All subsequent analysis, if not otherwise specified, was performed using R version 4.0.4 software. Logistic mixed-effects models were used to assess influence of different factors on NGS success. Majority consensus sequences assembly from NGS reads was done with SmaltAlign [37]. SmaltAlign consists of an initial de novo alignment followed by mapping to the HIV-1 reference sequence HXB2 (GenBank accession number K03455 [38]). Sample quality was checked for >40% completeness with >100 reads coverage. For single proviruses, hypermutated sequences were detected using the hypermut 2.0 online tool [39], whereas for bulk sequences the hypermut 2.0 tool [39] was adapted to the individual NGS read level (Supplementary Appendix 3). Alignments were created using MUSCLE (v.3.8.31_i86darwin32) [40], and phylogenetic trees were constructed using FastTree [41] as previously described [42]. Genetic distance was calculated for pairwise sequence overlaps >100 bp length using the T92 model. Average pairwise diversity was calculated as previously described [33] and additionally extended to env. For single proviruses, intactness was assessed with the Proviral Sequence Annotation and Intactness Test (ProSeq-IT) tool [43]. DRMs were detected with MinVar [44] using a frequency threshold of 2% and further filtered for relevant mutations (Supplementary Appendix 4, Supplementary Table 2). Statistical analysis was performed using paired (within treatment groups) or unpaired (between treatment groups) Wilcoxon test with .05 significance threshold.
RESULTS
Study Design and Near Full-Length HIV-1 Proviral PCR and NGS
PCR and NGS for bulk sequences was performed for the 3 time points of the 101 individuals participating in the ESS, resulting in a total of 297 NGS sequences (Figure 1). After quality-based sample selection, a consensus sequence was obtained for 71% (210/297) of samples despite the small reservoir size of the ESS participants, which was shown to be approximately 1 log10 lower when compared to chronically infected individuals [30]. One hundred sixty-three NGS sequences from 43 participants (25 on DTG monotherapy and 18 on cART) were selected, as all of these 43 had 3 time points with successful consensus sequences (1yaas, ESS wk0, ESS wk48), and 34 of those also had a sequence from the ART start time point (Supplementary Figure 2). Logistic regression revealed that sequencing success depends on reservoir size, DNA concentration after nucleic acid isolation, and DNA concentration after PCR (Supplementary Figure 3).
No Increased Genetic Distance in the DTG Monotherapy Versus the cART Group
Hypermutations in the provirus induced by the host enzyme APOBEC (APOBEC3G/F) frequently occur and can potentially be misinterpreted as signs of proviral evolution, and were therefore excluded from our bulk sequences. Reads above our defined strict hypermutation threshold were detected in all samples (Supplementary Figure 4). To investigate clustering of participants and possible viral evolution, maximum-likelihood phylogenetic and pairwise genetic distance analyses were performed on these APOBEC filtered sequences. Phylogenies showed close clustering of participants with exception of individual 336 at week 0 (see Supplementary Appendix 5) and no signs of viral evolution over the course of the ESS period (ESS wk0 to ESS wk48) and no difference between the 2 treatment groups through visual inspection (Figure 2A and 2B). Due to filtering out hypermutated reads, genetic distance could only be calculated for 35 of 43 participants for the ESS period. The median pairwise genetic distance of proviral sequences within each individual over the ESS period was 0.5% (interquartile range [IQR], 0.06%–1.5%) with no significant difference between the 2 treatment groups (0.3% [IQR, 0.05%–1.5%] for DTG monotherapy and 0.8% [IQR, 0.18%–1.5%] for cART; Wilcoxon test P = .56). Furthermore, genetic distance within each individual before (1yaas–ESS wk0) and after (1yaas–ESS wk48) DTG monotherapy did not significantly change in either treatment group (DTG monotherapy: P = 1, cART: P = .265; Figure 2C). Interestingly, overall median pairwise genetic distance was significantly higher with 1.5% (IQR, 0.32%–2.8%) in non-APOBEC-filtered sequences compared to APOBEC-filtered sequences (P < .001, Figure 2C). Furthermore, genetic distance does not correlate with number of days between 1yaas and ESS wk48 (P = .48), reinforcing that genetic distance does not increase over time (Figure 2D). Viral blips did not have an effect on genetic distance and were not found more frequently in the DTG monotherapy (P = 1) (Supplementary Figure 5). Furthermore, different HIV-1 RNA and DNA forms that arise during HIV-1 transcription were measured for all 101 participants for time points 1yaas, ESS wk0, and ESS wk48. No unspliced RNA, multiply spliced RNA or 2-LTR circles were detected, with no differences between the DTG monotherapy and the cART group (Supplementary Figure 6).
![Phylogenetic and distance analysis of near full-length HIV-1 proviral sequences of 43 early-treated individuals over 4 time points. A and B, Unrooted phylogenetic tree of proviral bulk consensus sequences of participants in the dolutegravir (DTG) monotherapy (n = 25, A) or combination antiretroviral therapy (cART) (n = 18, B) treatment group. For individual 190, Early Simplified Study (ESS) week 48, no consensus sequence was obtained after APOBEC filtering. Proviral sequences of the different time points (ART start [as], 1 year after ART start [1yaas], ESS week 0 [wk0], and ESS week 48 [wk48]) are labeled accordingly. Sequences of the same individual are shown in the same color, and HIV-1 subtype references are shown in black. C, Pairwise genetic distance between the sequences of 3 time points (1yaas, ESS wk0, and ESS wk48) for each individual for DTG monotherapy (orange) and cART (gray) for APOBEC-filtered (left) and not filtered (right) sequences. For hypermutated reads filtered out: wk0–wk48: n = 35, 1yaas–wk0: n = 40, 1yaas–wk48: n=39; for hypermutated reads not filtered out: wk0–wk48: n = 38, 1yaas–wk0: n = 41, 1yaas–wk48: n = 41. Unpaired Wilcoxon test was performed to compare treatment groups and distance over time. D, Correlation plot between pairwise distance and number of days between the time point 1yaas and ESS wk48 for 23 DTG monotherapy–treated participants. Gray area represents 95% confidence interval.](https://oup.silverchair-cdn.com/oup/backfile/Content_public/Journal/jid/228/7/10.1093_infdis_jiad292/1/m_jiad292f2.jpeg?Expires=1747934307&Signature=3I8R1AYVz5SvVZ7767OC7IWxRtRPp6e9NNe3gj9gxMAn~iodFTXyqYJETKtnJdjNApqODXDSM-otPeXAqsO2BWrcknIYM~KrViRl6ZkHBYkXwCYqVXeqEFgv1Gg36NY1Xq-A3WJkUCUv7~uzFl5Lz1Fzm0RjMbI7HVbSe-mgkOk3ibKC-M4CnX7~ZNIyBep-0gvo6hSDqPZZrC5yP~FfBC5td69oYMjiwOgvP8s~49vwLX-C~cKWyxKsTVbUsKMPCWAx75NJ9nqtg9-UglfUQjIEZPulseXPh0FsPQY~WTo9mPTBXxFUz9wqYsOF-d0gh3XoMDF95-59xm87qtqOMg__&Key-Pair-Id=APKAIE5G5CRDK6RD3PGA)
Phylogenetic and distance analysis of near full-length HIV-1 proviral sequences of 43 early-treated individuals over 4 time points. A and B, Unrooted phylogenetic tree of proviral bulk consensus sequences of participants in the dolutegravir (DTG) monotherapy (n = 25, A) or combination antiretroviral therapy (cART) (n = 18, B) treatment group. For individual 190, Early Simplified Study (ESS) week 48, no consensus sequence was obtained after APOBEC filtering. Proviral sequences of the different time points (ART start [as], 1 year after ART start [1yaas], ESS week 0 [wk0], and ESS week 48 [wk48]) are labeled accordingly. Sequences of the same individual are shown in the same color, and HIV-1 subtype references are shown in black. C, Pairwise genetic distance between the sequences of 3 time points (1yaas, ESS wk0, and ESS wk48) for each individual for DTG monotherapy (orange) and cART (gray) for APOBEC-filtered (left) and not filtered (right) sequences. For hypermutated reads filtered out: wk0–wk48: n = 35, 1yaas–wk0: n = 40, 1yaas–wk48: n=39; for hypermutated reads not filtered out: wk0–wk48: n = 38, 1yaas–wk0: n = 41, 1yaas–wk48: n = 41. Unpaired Wilcoxon test was performed to compare treatment groups and distance over time. D, Correlation plot between pairwise distance and number of days between the time point 1yaas and ESS wk48 for 23 DTG monotherapy–treated participants. Gray area represents 95% confidence interval.
Viral Diversity in DTG Monotherapy Group Does Not Increase Over ESS Period
Average pairwise diversity was calculated and longitudinally assessed for the 3 main genomic regions, for 139 (85%) samples for gag, 147 (90%) for pol, and 123 (75%) for env, as other samples contained deletions in the respective genes. Diversity decreased slightly after filtering for APOBEC-induced hypermutations (Figure 3A, Supplementary Figure 7). At ESS wk48, median average pairwise diversity for participants on DTG monotherapy and cART, respectively, was 0.06% and 0.006% for gag, 0.02% and 0.09% for pol, and 0.005% and 0% for env, with no significant differences between the treatment groups in either gene (gag P = .13, pol P = .34, env P = .32) (Figure 3A). Longitudinal diversity was variable between participants; however, mean diversity in participants on DTG monotherapy did not increase over the study period in gag, pol, or env (gag: 0.04% at ESS wk0, 0.06% at ESS wk48, P = .67; pol: 0.05% at ESS wk0, 0.02% at ESS wk48, P = .42; env: 0.01% at ESS wk0, 0.005% at ESS wk48, P = .56) and was similar to diversity in participants on cART (gag: 0.10% at ESS wk0, 0.006% at ESS wk48, P = .16; pol: 0.05% at ESS wk0, 0.09% at ESS wk48, P = .69; env: 0.01% at ESS wk0, 0% at ESS wk48, P = .08) (Figure 3A, Supplementary Table 3). Median slope of the diversity before and during study period was zero in both treatment groups (Figure 3B).
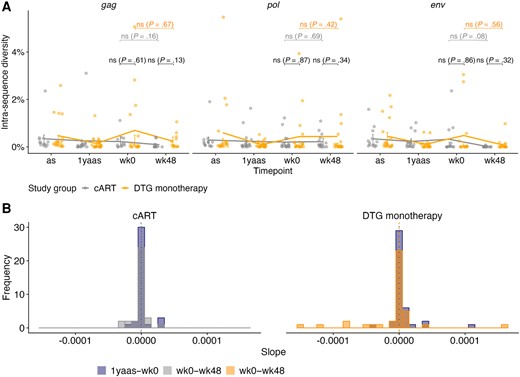
Average pairwise diversity of near full-length HIV-1 proviral sequences of 43 early-treated individuals over the observation period after APOBEC filtering. A, Average pairwise diversity within gag (n = 139), pol (n = 147), and env (n = 123) after APOBEC filtering for distinct participants on dolutegravir (DTG) monotherapy (orange) and combination antiretroviral therapy (cART; gray) (dots); median with interquartile range (line and bars) is shown. Wilcoxon tests were performed. B, Slope of diversity before study, ie, from 1 year after ART start (as) to Early Simplified Study week 0 (1yaas–wk0) (blue) and during the study, ie, from ESS week 0 to ESS week 48 (wk0–wk48) for DTG monotherapy (orange) and cART (gray) participants’ sequences after APOBEC filtering. Slopes for all 3 genes are shown in the same graph. Median slope before study (dotted) and during study (dashed) is shown with a vertical line.
Absence of Detection of Concerning DRMs After APOBEC Filtering
DRM detection was done with MinVar [44] using a frequency threshold of 2% to detect minor variants, as opposed to the usually accepted clinically relevant threshold of 15% [45]. Transmitted DRMs were present in 19% (n = 8) of all 43 participants as detected by Sanger sequencing in genotypic resistance test from initial plasma before undergoing cART. All transmitted DRMs were detected with proviral NGS as well, and APOBEC filtering did not influence detection frequency (Supplementary Figure 8). Four DRMs (E138K, G140R, G140S, and R263K) were detected for the first time at ESS wk48 in 5 participants (4 cART and 1 DTG monotherapy) (Supplementary Figure 9). However, all 4 detected DRMs are APOBEC signature mutations and were no longer detected after APOBEC filtering (Figure 4). However, APOBEC-filtered DRM detection showed 1 emerging DRM (G140R) at ESS wk48 at 100% in DTG monotherapy individual 302 (Figure 4A). According to the Stanford database, G140R has not been found in people receiving DTG. In general, over the ESS period, between 0 and 3 DRMs were found per sample. No rise in the median number of DRMs per sample was detected in either treatment group, and there were no significant differences between the treatment groups at ESS wk48 (unpaired Wilcoxon test: reverse transcriptase [RT] P = .18, integrase P = .407) (Figure 4B). The highest number of DRMs was detected in RT with a median of 1 and 0 DRMs per sample for DTG monotherapy and cART, respectively, whereas in integrase and protease a median of 0 DRM was observed.
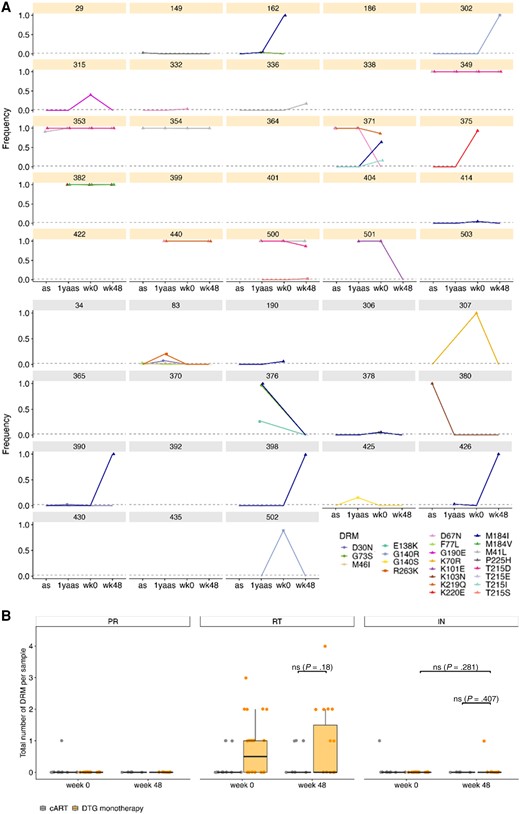
Drug resistance mutations (DRMs) in 43 individuals after APOBEC filtering. A, Frequency of each detected DRM over the 4 time points for each dolutegravir (DTG) monotherapy (orange) and combination antiretroviral therapy (gray) individual with a detection threshold of 2%. DRMs for integrase are depicted with squares, for protease with circles, and for reverse transcriptase with triangles. Time points with no information about frequency of DRMs have no point but a connecting line to the next time point. B, Total number of DRMs per gene and treatment group for Early Simplified Study (ESS) week 0 and ESS week 48. Depicted are individual numbers and boxplots with median and standard deviation. Wilcoxon test between DTG monotherapy and cART and for DTG monotherapy ESS week 0 vs ESS week 48 is shown if applicable. Abbreviations: 1yaas, 1 year after ART start; as, antiretroviral therapy start; cART, combination antiretroviral therapy; DRM, drug resistance mutation; DTG, dolutegravir; IN, integrase; PR, protease; RT, reverse transcriptase; wk0, Early Simplified Study week 0; wk48, Early Simplified Study week 48.
Cluster of Extremely Hypermutated Sequences in 2 Individuals Treated With DTG Monotherapy
To characterize HIV-1 reservoir and its landscape before and after DTG monotherapy in more detail, single-genome analysis was performed for 10 participants. Individuals were selected based on bulk NGS success and high reservoir size to optimize single sequencing success and showed similar characteristics (Supplementary Figure 10). One hundred sixty-nine single proviruses were obtained, evenly distributed over treatment groups and time points with a mean of 8 single proviruses per individual per time point (Supplementary Figures 10 and 11). Phylogenetic analysis showed clustering of sequences within each individual and no clear pattern of sequence evolution (Figure 5). Interestingly, 1 sequence from individual 503 clustered closest together with 3 sequences from individual 353 (box in Figure 5). These 4 sequences form a cluster of extremely hypermutated sequences with 46%–49% A base composition as compared to the other hypermutated sequences with 38%–40% A content, suggesting that the phylogenetic clustering was caused by hypermutation resulting in similar mutational patterns. Although careful precautions were taken to avoid contamination, contamination of individual 503's sample cannot be ruled out.
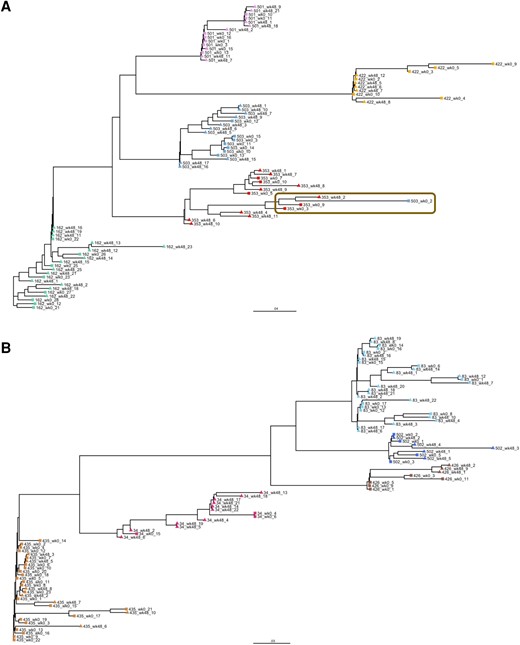
Maximum-likelihood phylogenetic tree of single proviruses for 10 participants. A and B, Unrooted phylogenetic tree of single proviruses from participants on dolutegravir monotherapy (n = 5, A) or combination antiretroviral therapy (n = 5, B). Single proviruses of Early Simplified Study (ESS) week 0 are shown with squares and ESS week 48 with triangles. All sequences of the same individual are shown in the same color. Cluster of extremely hypermutated sequences is shown in the brown box.
Single Proviruses Carry DRMs Only on Defective Sequences
As participants are on DTG monotherapy, DRM detection in single proviruses was focused on integrase. The integrase DRMs E138K, G140S, R263K, and E138K/G140S combination were found on 11 of 169 (7%) single proviruses, with no significant differences in DRM numbers between the treatment groups at ESS wk48 (P = .16) (Figure 6A). The detected mutations confer potential low-level or intermediate resistance against DTG; however, they were exclusively found on defective single proviruses. All of these 11 single proviruses were defective through hypermutations, suggesting that the found DRMs could have been created through APOBEC rather than selective pressure from ART.
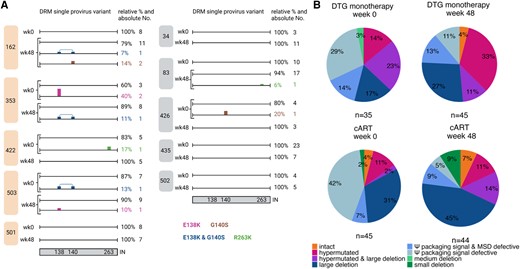
Single provirus analysis of 10 participants. A, Single proviruses with individual drug resistance mutation (DRM) pattern in integrase (IN) is shown for each found variant for the 5 dolutegravir (DTG) monotherapy (left, orange) and 5 combination antiretroviral therapy (cART) (right, gray) participants at Early Simplified Study (ESS) week 0 (wk0) and ESS week 48 (wk48). DRMs are shown color-coded on the sequence. Relative and absolute numbers of single proviruses on which the mutation was found are shown on the right of the sequence. Integrase is depicted schematically at the bottom with the numbers indicating the position of the found DRMs. B, Proviral landscape of 169 single proviruses for participants treated with DTG monotherapy (top) and cART (bottom). ESS wk0 is shown on the left (DTG monotherapy n = 35, cART n = 45) and ESS wk48 on the right (DTG monotherapy n = 45, cART n = 44). Shown are percentages of single proviruses with intact, hypermutated, hypermutated and large deletion (>2000 bp), large deletion, Ψ packaging and major splice donor (MSD) defects, Ψ packaging signal defects, and medium deletions (100–2000 bp) and small deletions (<100 bp) in the genome.
Landscape analysis revealed 4% (7/169) of total single proviruses were intact with 0%–4% in the DTG monotherapy group and 4%–7% in the cART group (Figure 6B). Large internal deletions, deletions in the packaging signal, and hypermutations were most common defects. Large internal deletions were found at ESS wk0 and ESS wk48 with similar frequencies in the DTG monotherapy group (17% [95% confidence interval {CI}, 5%–29%] and 27% [95% CI, 14%–40%], respectively) and cART group (31% [95% CI, 17%–45%] and 45% [95% CI, 30%–60%], respectively), whereas hypermutations were found less frequently (DTG monotherapy: 14% [95% CI, 3%–25%] and 33% [95% CI, 19%–47%]; cART: 11% [95% CI, 2%–20%] and 11% [95% CI, 2%–20%]) but were also similarly distributed between treatment groups and time points. Varying proportions (2%–23%) of single proviruses with large internal deletions were additionally also hypermutated. Off note, hypermutated sequences were found in all 10 participants except for individual 34 (cART). Interestingly, at ESS wk0, in both treatment groups a large proportion of single proviruses had defects in the packaging signal that declined in the DTG monotherapy group from 43% (95% CI, 27%–59%) to 24% (95% CI, 12%–36%; P = .13) and in the cART group from 49% (95% CI, 34%–64%) to 14% (95% CI, 4%–24%; P = .0008) at ESS wk48 (Figure 6B).
DISCUSSION
Understanding HIV-1 reservoir dynamics in PWH undergoing ART simplification will be an important aspect for further clinical treatment strategies and HIV reservoir studies. We performed an analysis of the HIV-1 reservoir over a period of 48 weeks in early-treated participants on successful DTG monotherapy. Overall, no low-level replication, sequence evolution, or emergence of concerning DRMs was detected in 43 participants from the ESS within 1 year of treatment simplification. If replication were to occur under monotherapy, we would expect genetic distances and diversity to increase over the course of DTG monotherapy. However, we showed that distance and diversity do not increase during DTG monotherapy, are almost identical to the diversity and distance before ESS start, and are similar in individuals on DTG monotherapy and those on cART. The low intra-sequence diversity observed in our study is in line with another study that observed 1.5% average pairwise difference in cell-associated DNA from PBMCs of participants on suppressive ART [46]. In addition, we showed no detection of transcriptional HIV-1 RNA forms in either of our treatment groups; however, very low numbers of transcripts might have been missed because our assay was not highly sensitive or because of the inherent difficulty of detecting a rare event. Additionally, we previously showed profound depletion of viral RNA in early-treated participants [30], possibly explaining the absence of viral RNA that was found in the current study. Landscape analysis showed no apparent differences between DTG monotherapy and cART groups, as the fraction of intact and hypermutated sequences was comparable. Overall, we found 4% intact single proviruses, which is in line with previous findings ranging between 2% and 12% [16, 17, 47]. DRM detection showed that most DRMs are APOBEC signature mutations and either appear on hypermutated single proviruses or are removed after APOBEC filtering, indicating that drug pressure probably plays a minor role in developing these mutations. Bulk DRM analysis revealed emergence of G140R in 1 DTG monotherapy–treated individual. G140R is a revertant mutation from the original G140S/A/C but only confers intermediate DTG resistance when in combination with Q148H/R/K, which was not found in this individual. Furthermore, this individual did not show viral failure on DTG monotherapy over an additional 3 years; thus, this mutation was most likely not selected by DTG monotherapy [28]. In contrast, 3 other clinical trials investigated DTG monotherapy in individuals mostly treated during the chronic stage of infection. They showed 17 of 204 individuals with viral failure, 6 of which developed DRMs, most commonly N155H, which was not detected in any of our participants [23–25]. Early ART start, leading to smaller reservoir size, seems to be a key factor in the success of DTG monotherapy [26, 28], as also assessed in a meta-analysis [32].
APOBEC-induced hypermutations increase diversity and genetic distances and result in nonsense DRMs; thus, filtering out APOBEC-hypermutated reads is a necessary step. In contrast to HIV-1 RNA genomes, proviruses can contain large numbers of APOBEC-induced hypermutations, many being key DRMs, which complicates DRM detection in proviral sequences [48]. Before APOBEC filtering, we found a larger number of DRMs over all time points in protease, RT, and integrase. After APOBEC filtering, several DRMs were not detected anymore, especially M184I (nucleotide reverse transcriptase inhibitor), a classic APOBEC target site. This is in line with a recent study which suggested that DRMs found in proviral sequences are mostly due to hypermutations and that real DRMs are only revealed after hypermutated proviral sequences are removed [49]. Careful removal of hypermutated reads or positions from sequencing data is therefore of great importance for accurate sequence analysis and interpretation. In the absence of more sophisticated tools to remove hypermutations from bulk proviral NGS data, our analysis used a stringent threshold, aiming for a high sensitivity with the cost of low specificity, for APOBEC filtering; therefore, almost 70% of reads were classified as hypermutated. This is in contrast to single-genome studies, in which approximately 30% of sequences are considered hypermutated [47]. However, classification of short NGS reads from bulk sequencing as opposed to near full-length single genomes tends to be more difficult and uncertain. Development of adequate tools to detect and remove hypermutated reads with high certainty from bulk proviral NGS data is therefore urgently needed.
Filtering for APOBEC-induced hypermutations in bulk sequences with our developed method has a low specificity, thus limiting our analysis; however, tools addressing hypermutation filtering from proviral data are not yet available.
Our study has strength and limitations. Strengths are that we studied the HIV-1 reservoir in well-characterized participants from an RCT with highly sensitive methods. Limitations are the limited number of PBMCs with a low infection frequency available for analysis as well as limited sequencing success, probably due to the small reservoir size of early-treated individuals that compromises sequencing endeavors and sensitivity of RNA assays. Nevertheless, this study includes almost half of all study participants and sequencing success was proportionally similar between treatment groups. In addition, our analysis was limited to PBMCs. However, this compartment is the only one that can longitudinally be accessed in a larger number of individuals within a clinical trial.
Altogether, our data reveal absence of detectable sequence changes, respective of viral evolution, suggestive of ongoing residual viral replication in proviral sequences under successful DTG monotherapy in individuals who were switched to DTG after cART initiation during primary HIV infection. As monotherapy is not recommended as a general treatment option, it should only be revisited in carefully designed trials enrolling selected participants with adherent treatment history, low HIV-1 reservoir size, and potential additional parameters to reduce drug burden in PWH.
Supplementary Data
Supplementary materials are available at The Journal of Infectious Diseases online. Consisting of data provided by the authors to benefit the reader, the posted materials are not copyedited and are the sole responsibility of the authors, so questions or comments should be addressed to the corresponding author.
Notes
Acknowledgments. We thank Gabriela Ziltener (Diagnostics, Institute for Medical Virology, University of Zurich) for technical sequencing assistance. Furthermore, we thank Adrian Schemel for his support in database management. The following reagent was obtained through the National Institutes of Health (NIH) AIDS Reagent Program, Division of AIDS, National Institute of Allergy and Infectious Diseases: ACH-2 cells from Dr Thomas Folks (catalog number 349) [50]. Figure 1, Figure 6A, Supplementary Figure 1, and Supplementary Figure 11A were created with BioRender.com.
Author contributions. Conceived and designed experiments: L. J., C. D. S., K. J. M., and H. F. G. Principal investigator of the Early Simplified Study (ESS): H. F. G. Sample collection and processing: H. K., D. L. B., H. F. G., and C. G. Performed experiments: L. J., J. T., C. L., and K. N. Prepared, analyzed, and interpreted sequencing data: L. J., J. T., N. N.-J., M. Ze., R. K., and K. J. M. Contributed to data analysis: S. E. C., M. Za., and P. F. Supervision of data analysis: K. J. M., R. K., and H. F. G. Prepared figures and tables: L. J. and J. T. Wrote and edited the manuscript: L. J., K. J. M., and H. F. G. All authors have read and agreed to the published version of the manuscript.
Data availability. Data availability is described in Supplementary Appendix 6.
Disclaimer. Roche had no role in study design, data collection and analysis, decision to publish, or preparation of the manuscript.
Financial support. This study was supported by the Swiss National Science Foundation (SNF) (grant number 179571 to H. F. G.) and the University of Zurich's Clinical Research Priority Program Viral Infectious Diseases: Zurich Primary HIV Infection Study (to H. F. G. and D. L. B). R. K. was supported by the SNF (grant numbers PZ00P3-142411 and BSSGI0_155851). Roche Diagnostics Ltd (Switzerland) provided free-of-charge 480 tests of the CAP/CTM HIV version 2.
References
Author notes
Presented in part: 9th Swiss Virology Meeting, Bern, Switzerland, 31 January–1 February 2023.
K. J. M. and H. F. G. contributed equally to this work.
Potential conflicts of interest. D. L. B. reports honoraria for advisory boards from Gilead, Merck, and ViiV, outside the present work. K. J. M. has received travel grants and honoraria from Gilead Sciences, Roche Diagnostics, GlaxoSmithKline, Merck Sharp & Dohme, Bristol Myers Squibb, ViiV, and Abbott, and has received advisory board honoraria from Gilead Sciences and ViiV. The University of Zurich received research grants from Gilead Sciences, Novartis, Roche, and Merck Sharp & Dohme for studies for which K. J. M. serves as principal investigator. H. F. G. has received grants from the SNF, Swiss HIV Cohort Study, Yvonne Jacob Foundation, University of Zurich's Clinical Research Priority Program, Zurich Primary HIV Infection, Systems.X, NIH, Gilead Sciences, and Roche; personal fees from Merck, Gilead Sciences, ViiV, Janssen, GSK, Johnson & Johnson, and Novartis for consultancy or data and safety monitoring board membership; and a travel grant from Gilead. All other authors report no potential conflicts.
All authors have submitted the ICMJE Form for Disclosure of Potential Conflicts of Interest. Conflicts that the editors consider relevant to the content of the manuscript have been disclosed.

