


Abstract
Anticoagulation (AC) utilization patterns and their predictors among hospitalized coronavirus disease 2019 (COVID-19) patients have not been well described.
Using the National COVID Cohort Collaborative, we conducted a retrospective cohort study (2020–2022) to assess AC use patterns and identify factors associated with therapeutic AC employing modified Poisson regression.
Among 162 842 hospitalized COVID-19 patients, 64% received AC and 24% received therapeutic AC. Therapeutic AC use declined from 32% in 2020 to 12% in 2022, especially after December 2021. Therapeutic AC predictors included age (relative risk [RR], 1.02; 95% confidence interval [CI], 1.02–1.02 per year), male (RR, 1.29; 95% CI, 1.27–1.32), non-Hispanic black (RR, 1.16; 95% CI, 1.13–1.18), obesity (RR, 1.48; 95% CI, 1.43–1.52), increased length of stay (RR, 1.01; 95% CI, 1.01–1.01 per day), and invasive ventilation (RR, 1.64; 95% CI, 1.59–1.69). Vaccination (RR, 0.88; 95% CI, 84–.92) and higher Charlson Comorbidity Index (CCI) (RR, 0.98; 95% CI, .97–.98) were associated with lower therapeutic AC.
Overall, two-thirds of hospitalized COVID-19 patients received any AC and a quarter received therapeutic dosing. Therapeutic AC declined after introduction of the Omicron variant. Predictors of therapeutic AC included demographics, obesity, length of stay, invasive ventilation, CCI, and vaccination, suggesting AC decisions driven by clinical factors including COVID-19 severity, bleeding risks, and comorbidities.
Coronavirus disease 2019 (COVID-19) has been responsible for over 99 million confirmed cases, nearly 6 million hospitalizations, and 1 million deaths in the United States as of December 2022 [1]. A clinical feature of severe COVID-19 is coagulopathy, which is associated with increased risk of venous thromboembolism, critical care admission, and mortality [2–4]. Thromboembolic complications have been reported in 10%–47% of hospitalized COVID-19 patients [5–7]. As a response, in February 2021, several organizations including the American Society of Hematology (ASH) [8] and the National Institutes of Health (NIH) [9] released guidelines suggesting that at a minimum, hospitalized patients with COVID-19 should receive a prophylactic dose of anticoagulation (AC).
Recommendations for prophylactic and therapeutic AC dosing have changed over time based on expert opinion and evidence from trials including RAPID, HEP-COVID, and ACTION. Among moderately ill COVID-19 patients, clinical trials showed therapeutic dosing of heparin reduced all-cause mortality or increased organ support-free days compared to prophylactic dosing [10–12]. In contrast, critically ill patients had no significant mortality benefit associated with therapeutic versus prophylactic heparin dosing [10]. Various studies tested different dosing criteria and outcome end points, making objective recommendations difficult to ascertain with guidelines largely based on expert opinion and consensus statements [13]. Nevertheless, ASH and NIH updated their guidelines in early 2022 to support therapeutic dosing among acutely ill patients not requiring intensive care unit (ICU) admission and prophylactic dosing among critically ill patients in the ICU [14].
In addition, amidst the COVID-19 pandemic, many factors have arisen that may affect the potential thromboembolic risk of disease. The first vaccine was approved for emergency use authorization in December 2020 and the Food and Drug Administration approved in August 2021 [15]. New variants of concerns also emerged including Delta (B.1.617.2 lineage) in May 2021 and Omicron (B.1.1.529 lineage) in November 2021 [16]. While the landscape continues to evolve, evidence from large observational studies encompassing multiple institutions in the United States assessing AC utilization patterns over time and how clinical trial evidence has translated into practice remains limited. Thus, using data from the National COVID Cohort Collaborative (N3C), we conducted a study to (1) understand AC utilization patterns throughout the pandemic and (2) identify predictors associated with therapeutic AC use.
METHODS
Data Source and Processing
The N3C from the NIH is one of the largest US electronic health care record repositories for COVID-19 research. It captures detailed demographic and clinical patient-level data for a diverse group of individuals and as of April 2022, had 5 million COVID-19–positive patients across 72 sites [9]. We leveraged N3C-determined macrovisit and critical visit methodology to define a single hospitalization per patient related to their COVID-19 diagnosis [14]. Utilizing concept sets in the standardized common data model, we identified laboratory results, vital signs, diagnoses, procedures, and medications (Supplementary Table 1). All concept sets were reviewed by subject matter experts including authors (B. B., S. S.) or others in N3C.
Study Patients
We identified adult patients (≥18 years old) hospitalized with COVID-19 between 1 April 2020 and 30 April 2022. Inclusion criteria for COVID-19 diagnosis included (1) polymerase chain reaction (PCR) or antigen laboratory confirmation of severe acute respiratory syndrome coronavirus 2 (SARS-CoV-2) or (2) COVID-19 diagnosis code using N3C guidelines. Additional study criteria included (1) hospitalization defined as one of the following visit types: emergency room and inpatient visit, inpatient hospital, inpatient visit, intensive care, and inpatient critical care facility; (2) COVID-19 diagnosis within 7 days prior or 2 days after the hospitalization start date to increase likelihood that the visit was related to COVID-19; (3) no diagnosis prior to hospitalization supporting an indication of AC, including venous thromboembolism, stroke, long-term AC, atrial fibrillation, or valve replacement; and (4) data from N3C data partners who provided sufficient detail on medication as described below.
Among data partners available in N3C, we retained data from those with high-quality medication records. For each patient, we required dosage information, drug date records within the hospitalization period, and drug start dates occurring at the same time or prior to the end dates (when available). We further reviewed patient records occurring on the same day to remove potential duplicates of medication records.
AC and its Intensity
ACs of interest included enoxaparin, heparin, apixaban, and rivaroxaban. For those receiving AC, we categorized patients into prophylaxis and therapeutic groups based on body mass index (BMI), weight, estimated glomerular filtration rate (eGFR), and average daily dose received during hospitalization (Supplementary Table 2). We calculated eGFR using the Chronic Kidney Disease Epidemiology Collaboration equation with serum creatinine, sex, and race [17].
Among patients on enoxaparin, we categorized them into 3 AC intensity groups: standard prophylaxis, high prophylaxis, and treatment. Standard prophylaxis was defined as an average daily dose ≤60 mg when BMI < 40 or ≤80 mg when BMI ≥ 40. Any patients with missing BMI were grouped based on BMI < 40. Patients were categorized as high prophylaxis if they exceeded standard prophylaxis criteria and had an average daily dose <1.5 mg/kg. Treatment group included patients with an average daily dose ≥1.5 mg/kg for eGFR > 30 mL/min/1.73 m2 or missing eGFR and an average daily dose ≥1 mg/kg for any patients with eGFR ≤ 30 mL/min/1.73 m2. In analyses using 2 dosage categories (prophylaxis and therapeutic), we considered standard prophylaxis as the prophylaxis group and combined high prophylaxis and treatment categories as the therapeutic group. In patients taking heparin, we defined prophylaxis as an average daily dose between 1000 units (UNT) and 20 000 UNT and an average daily dose ≥20 000 UNT as therapeutic. We excluded a dose ≤1000 UNT to avoid capturing any heparin flush solutions used to maintain intravenous catheter lines. Patients taking a direct oral anticoagulant (apixaban or rivaroxaban) were categorized into the therapeutic group.
High-Risk Subgroup Based on D-dimer and Platelet Count
We used D-dimer and platelet values to identify patients with high D-dimer and greater than normal platelet (D-dimer ≥ 1 µg/mL and platelet ≥50 000/µL). We focused on this high D-dimer and greater than normal platelet subgroup due to their likely indication for therapeutic AC.
Conditions and Laboratory Values
We identified demographic characteristics and additional factors including BMI, Charlson Comorbidity Index (CCI), and preexisting medical conditions. Comorbidities were defined as diagnoses occurring prior to hospitalization. We also described select laboratory data at the time of admission relevant to COVID-19 hospitalization and grouped them based on elements in a complete blood count, complete metabolic panel, coagulation study, and additional inflammatory and related tests.
Statistical Analysis
We conducted all analyses among 2 cohorts: (1) all hospitalized COVID-19 patients, and (2) high D-dimer and not-low platelet count subgroup. For both cohorts, we explore baseline characteristics, presenting continuous measurements with mean and standard deviations, and categorical variables with counts and percentage of the population.
We assessed the rate of AC utilization over time and performed a descriptive assessment across multiple time periods, divided into 5-month intervals throughout the 2-year study period (April-August 2020, September 2020-January 2021, February-June 2021, July-November 2021, and December 2021-April 2022). We defined the Delta variant period between July and November 2021, while the Omicron variant period was between December 2021 and April 2022.
Based on initial observations of the AC use trend, we performed an ad hoc interrupted time series (ITS) analysis to evaluate the effect of the Omicron variant emergence. We aggregated data to monthly AC utilization and defined the intervention to occur after November 2021, when Omicron was first detected in the United States. The ITS model resulted in a time coefficient indicating the AC trend prior to intervention, a treatment coefficient indicating the change immediately after intervention, and a time since treatment coefficient indicating the trend after the intervention. All 3 coefficients had a corresponding P value.
We assessed several factors that may affect AC use and estimated relative risk of receiving therapeutic AC compared to no AC or prophylaxis dose using a Poisson regression with robust error estimation [18]. Statistical significance was defined as P < .05. For the analysis, BMI was grouped into underweight (<18.5), healthy weight (18.5–25), overweight (25.0–30), and obesity (30+). We determined vaccination status to be positive if the patient had received at least 1 dose prior to hospital admission.
All analyses were performed in the N3C enclave using SQL and R. The study protocol was approved by the Rutgers University Institutional Review Board.
RESULTS
Cohort Overview
Overall
We included 162 842 hospitalized COVID-19 patients from 25 hospital systems (mean age 56 years, 49% male, 50% non-Hispanic white, mean BMI 31; Figure 1 and Table 1). More than one-third of the patients were from the Midwest (35%) followed by the South (27%) and Northeast (25%). Patients receiving therapeutic dosing trended older (mean 61 years) and had a longer length of stay (mean 13 days) than those not receiving AC (49 years and 5 days length of stay).
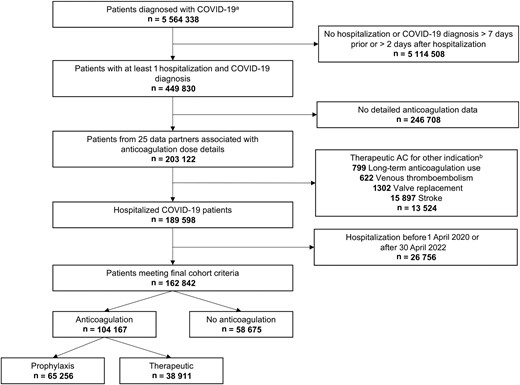
Flowchart depicting selection of COVID-19 hospitalized patients with exclusion criteria.aPatients with a PCR or antigen laboratory confirmation of SARS-CoV-2 or COVID-19 positive diagnosis. bPatients may have more than 1 indication. Abbreviations: AC, anticoagulation; COVID-19, coronavirus disease 2019; PCR, polymerase chain reaction; SARS-CoV-2, severe acute respiratory syndrome coronavirus 2.
Characteristics for all Adult Hospitalized COVID-19 Patients by Anticoagulation Status
| Characteristic | Overall | No Anticoagulation | Prophylaxis | Therapeutic |
|---|---|---|---|---|
| Total population, No. | 162 842 | 58 675 | 65 256 | 38 911 |
| Demographics | ||||
| Age, y, mean (SD) | 56 (19) | 49 (20) | 58 (18) | 61 (17) |
| Male sex | 79 401 (49) | 24 895 (42) | 32 532 (50) | 21 974 (56) |
| Race and ethnicitya | ||||
| Asian | 5356 (3.5) | 1706 (3.1) | 2412 (3.9) | 1238 (3.4) |
| Hispanic or Latino | 33 713 (22) | 12 076 (22) | 13 785 (22) | 7852 (22) |
| Native Hawaiian or other Pacific Islander | 251 (0.2) | 88 (0.2) | 116 (0.2) | 47 (0.1) |
| Non-Hispanic black | 36 957 (24) | 14 933 (27) | 13 074 (21) | 8950 (25) |
| Non-Hispanic white | 75 948 (50) | 25 775 (47) | 31 974 (52) | 18 199 (50) |
| Other | 880 (0.6) | 303 (0.6) | 362 (0.6) | 215 (0.6) |
| Regionb | ||||
| Midwest | 47 430 (35) | 17 136 (36) | 19 348 (37) | 10 946 (32) |
| Northeast | 33 278 (25) | 11 242 (23) | 12 407 (24) | 9629 (28) |
| South | 36 797 (27) | 14 715 (31) | 13 083 (25) | 8999 (26) |
| West | 17 557 (13) | 5087 (11) | 7902 (15) | 4568 (13) |
| Length of stay, d, mean (SD) | 9 (13) | 5 (9) | 9 (12) | 13 (16) |
| Comorbidities | ||||
| BMI, kg/m2, mean (SD)c | 31 (9) | 30 (8) | 31 (9) | 32 (9) |
| Charlson Comorbidity Index, mean (SD) | 1 (2) | 1 (2) | 1 (2) | 1 (2) |
| Cancer | 10 733 (6.6) | 3563 (6.1) | 4488 (6.9) | 2682 (6.9) |
| Chronic pulmonary disease | 21 046 (13) | 6972 (12) | 9247 (14) | 4827 (12) |
| Congestive heart failure | 9455 (5.8) | 2842 (4.8) | 3893 (6.0) | 2720 (7.0) |
| Dementia | 3527 (2.2) | 896 (1.5) | 1865 (2.9) | 766 (2.0) |
| Diabetes mellitus with complications | 11 884 (7.3) | 3573 (6.1) | 5269 (8.1) | 3042 (7.8) |
| Diabetes mellitus | 27 760 (17) | 7910 (13) | 12 711 (19) | 7139 (18) |
| HIV | 830 (0.5) | 348 (0.6) | 339 (0.5) | 143 (0.4) |
| Liver disease, mild | 7790 (4.8) | 2830 (4.8) | 3366 (5.2) | 1594 (4.1) |
| Liver disease, severe | 1384 (0.8) | 620 (1.1) | 523 (0.8) | 241 (0.6) |
| Metastases | 2281 (1.4) | 770 (1.3) | 909 (1.4) | 602 (1.5) |
| Myocardial infarction | 4615 (2.8) | 1282 (2.2) | 2096 (3.2) | 1237 (3.2) |
| Paralysis | 849 (0.5) | 258 (0.4) | 401 (0.6) | 190 (0.5) |
| Peptic ulcer disease | 1544 (0.9) | 571 (1.0) | 663 (1.0) | 310 (0.8) |
| Peripheral vascular disease | 8580 (5.3) | 2686 (4.6) | 3674 (5.6) | 2220 (5.7) |
| Renal disease | 13 898 (8.5) | 4815 (8.2) | 5630 (8.6) | 3453 (8.9) |
| Rheumatologic disease | 4836 (3.0) | 1511 (2.6) | 2179 (3.3) | 1146 (2.9) |
| Laboratory tests, mean (SD) | ||||
| CBC | ||||
| Hemoglobin, g/dL | 13.04 (2.21) | 12.69 (2.32) | 13.23 (2.10) | 13.17 (2.20) |
| MCV, fL | 88 (7) | 88 (7) | 88 (7) | 89 (7) |
| Platelet count, ×10E3/µL | 229 (97) | 229 (95) | 228 (96) | 232 (100) |
| Neutrophils, absolute, ×10E3/µL | 88 (7) | 88 (7) | 88 (7) | 89 (7) |
| Lymphocytes, absolute, ×10E3/µL | 1.91 (1.54) | 2.06 (2.10) | 1.76 (1.22) | 2.02 (1.47) |
| CMP | ||||
| Glucose, mg/dL | 147 (78) | 135 (74) | 148 (77) | 158 (84) |
| BUN, mg/dL | 21 (19) | 22 (22) | 20 (17) | 24 (20) |
| Creatinine, mg/dL | 1.34 (1.67) | 1.50 (2.09) | 1.22 (1.38) | 1.37 (1.54) |
| BUN/creatinine ratio | 18 (9) | 17 (9) | 18 (8) | 19 (9) |
| Albumin, g/dL | 3.53 (0.61) | 3.65 (0.67) | 3.52 (0.57) | 3.39 (0.57) |
| ALT, SGPT | 50 (163) | 49 (221) | 49 (127) | 52 (140) |
| AST, SGOT | 63 (256) | 62 (327) | 60 (188) | 69 (271) |
| Coagulation | ||||
| D-dimer, mg/L FEU | 2.11 (3.59) | 2.08 (3.90) | 1.85 (3.09) | 2.70 (4.24) |
| International Normalized Ratio | 1.20 (0.62) | 1.29 (0.95) | 1.13 (0.39) | 1.21 (0.58) |
| Fibrinogen, pg/mL | 521 (191) | 441 (188) | 531 (182) | 543 (195) |
| Inflammatory and other | ||||
| ESR, mm/h | 56 (34) | 51 (35) | 56 (33) | 58 (33) |
| IL-6, pg/mL | 96 (876) | 223 (2596) | 75 (239) | 97 (535) |
| LDH, units/L | 454 (586) | 417 (878) | 417 (356) | 533 (692) |
| Lactate, mM | 1.91 (1.54) | 2.06 (2.10) | 1.76 (1.22) | 2.02 (1.47) |
Continuous variables presented as mean (standard deviation), as indicated, and categorical variables as frequency, No. (%).
Abbreviations: ALT, SGPT, alanine aminotransferase, serum glutamic-pyruvic transaminase; AST, SGOT, aspartate aminotransferase, serum glutamic-oxaloacetic transaminase; BMI, body mass index; BUN, blood urea nitrogen; CBC, complete blood count; CMP, comprehensive metabolic panel; COVID-19, coronavirus disease 2019; ESR, erythrocyte sedimentation rate; FEU, fibrinogen equivalent unit; HIV, human immunodeficiency virus; IL-6, interleukin 6; LDH, lactate dehydrogenase; MCV, mean corpuscular volume.
Missing, 9737.
Missing, 27 780.
Missing, 12 864.
The most common comorbidities of hospitalized COVID-19 patients included diabetes mellitus with or without complications (24%), chronic pulmonary disease (13%), and renal disease (9%). Approximately 5% were previously diagnosed with peripheral vascular disease and 3% had a prior myocardial infarction.
High D-Dimer, Greater Than Normal Platelet Count Subgroup
Among 162 842 patients, 15 977 had recorded D-dimer level and platelet counts with 7907 patients having high D-dimer and greater than normal platelet counts. The mean age was 63 years, 53% male, and mean BMI 30 (Supplementary Table 3). Race distribution was similar to the overall cohort with regional representation highest in the South (52%) followed by Northeast (30%). Mean length of stay was 14 days. Frequency of comorbidities were also similar to the overall cohort.
AC Utilization and Intensity Over Time
Overall
Among hospitalized COVID-19 patients, 64% received some level of AC (40% prophylactic and 24% therapeutic dosing). The utilization of prophylactic and therapeutic dosing remained stable from April 2020 through November 2021 at 42% and 25%, respectively (Figure 2). In the months after emergence of the Omicron variant between December 2021 and April 2022, AC use decreased to 51% overall with 31% and 20% for prophylaxis and therapeutic dosing, respectively.

Rate of anticoagulation usage by month showing estimated Delta and Omicron emergence time periods among (A) all hospitalized COVID-19 patients and (B) high D-dimer and greater than normal platelet subgroup. Delta variant predominance noted from July 2021 to November 2021; Omicron variant predominance noted from December 2021 to April 2022 in Panel A and March 2022 in Panel B; Dashed line represents indicator of 50% of patients for reference.
The ad hoc ITS analysis estimated AC use of 68% at the beginning of the pandemic, with a stable trend prior to the emergence of Omicron (Supplementary Table 4, Supplementary Figure 1). We found a 7.1% decrease in AC use immediately after Omicron, which was not statistically significant. However, there was a significant change in the trend from pre-Omicron emergence, showing 3.0% reduction in AC use per month after Omicron emergence (P < .05).
High D-Dimer, Greater Than Normal Platelet Count Subgroup
Among hospitalized COVID-19 patients with high D-dimer and greater than normal platelet count, 86% received some level of AC with 54% prophylactic and 31% therapeutic dosing. Use of prophylaxis and therapeutic AC showed modest decline with limited change throughout the study period, despite the introduction of the Omicron variant. The ITS analysis confirmed the observation with an estimated AC usage of 82% at the beginning of the pandemic (P < .01) and a monthly decreasing trend of 0.3% (P < .05) (Supplementary Table 4).
Predictors of any AC Use and Intensity
Overall
Many factors were associated with higher intensity dosing of AC. In univariate modified Poisson analyses, increased age (relative risk [RR], 1.02; 95% confidence interval [CI], 1.02–1.02), male sex compared to female (RR, 1.36; 95% CI, 1.34–1.39), overweight (RR, 1.15; 95% CI, 1.11–1.18) or obesity (RR, 1.32; 95% CI, 1.28–1.36) BMI compared to healthy weight, length of stay (RR, 1.01; 95% CI, 1.01–1.01), and invasive ventilation (RR, 2.16; 95% CI, 2.12–2.20) were associated with increased risk of receiving therapeutic AC, while Hispanic or Latino compared to non-Hispanic white (RR, 0.97; 95% CI, .95–.99), vaccination (RR, 0.82; 95% CI, .79–.86), and treatment during subsequent 5-month time periods compared to April 2020-August 2020 were associated with decreased risk (Table 2).
Relative Risk Estimates and 95% Confidence Intervals based on Univariate and Multivariable Model of Receiving Therapeutic Dose Anticoagulation Among All Hospitalized COVID-19 Patients and High D-dimer and Greater Than Normal Platelet Subgroup
| Variable | Relative Risk (95% CI) | |||
|---|---|---|---|---|
| All Hospitalized COVID-19 Patients | High D-Dimer and Greater Than Normal Platelet Group | |||
| Univariate | Multivariable | Univariate | Multivariable | |
| Age | 1.02 (1.02–1.02) | 1.02 (1.02–1.02) | 1.00 (1.00–1.00) | 1.00 (1.00–1.00) |
| Malea | 1.36 (1.34–1.39) | 1.29 (1.27–1.32) | 1.27 (1.19–1.36) | 1.25 (1.16–1.34) |
| Race and ethnicityb | ||||
| Non-Hispanic black | 1.01 (.99–1.03) | 1.16 (1.13–1.18) | 0.90 (.83–.97) | 0.97 (.89–1.05) |
| Asian | 0.96 (.92–1.01) | 1.07 (1.02–1.12) | 1.10 (.92–1.32) | 1.09 (.91–1.32) |
| Hispanic or Latino | 0.97 (.95–.99) | 1.12 (1.09–1.15) | 0.82 (.75–.89) | 0.81 (.74–.88) |
| Native Hawaiianc | 0.78 (.60–1.01) | 0.88 (.69–1.13) | … | … |
| Other | 1.02 (.91–1.15) | 1.09 (.97–1.22) | 0.68 (.35–1.30) | 0.69 (.37–1.30) |
| BMI, kg/m2d | ||||
| 30+ | 1.32 (1.28–1.36) | 1.48 (1.43–1.52) | 1.27 (1.15–1.40) | 1.22 (1.10–1.36) |
| 25–30 | 1.15 (1.11–1.18) | 1.16 (1.12–1.19) | 1.11 (.99–1.23) | 1.06 (.95–1.18) |
| 0–8.5 | 0.94 (.88–1.02) | 0.88 (.81–.95) | 0.82 (.63–1.06) | 0.89 (.69–1.16) |
| Vaccination | 0.82 (.79–.86) | 0.88 (.84–.92) | 0.78 (.66–.92) | 0.80 (.67–.96) |
| Length of stay | 1.01 (1.01–1.01) | 1.01 (1.01–1.01) | 1.01 (1.01–1.01) | 1.01 (1.01–1.01) |
| Charlson Comorbidity Index | 1.00 (1.00–1.01) | 0.98 (.97–.98) | 0.93 (.90–.95) | 0.93 (.90–.95) |
| Invasive Ventilation | 2.16 (2.12–2.20) | 1.64 (1.59–1.69) | 1.63 (1.53–1.75) | 1.48 (1.36–1.60) |
| Time periode | ||||
| Sep 2020 to Jan 2021 | 0.92 (.90–.95) | 0.94 (.91–.96) | 1.03 (.95–1.12) | 1.07 (.98–1.17) |
| Feb 2021 to Jun 2021 | 0.87 (.85–.90) | 0.97 (.94–.99) | 0.98 (.88–1.09) | 0.98 (.88–1.10) |
| Jul 2021 to Nov 2021 | 0.91 (.88–.93) | 1.00 (.97–1.03) | 1.18 (1.07–1.30) | 1.10 (.99–1.22) |
| Dec 2021 to Apr 2022 | 0.75 (.72–.77) | 0.87 (.85–.90) | 1.09 (.97–1.23) | 1.07 (.95–1.22) |
Abbreviations: BMI, body mass index; CI, confidence interval; COVID-19, coronavirus disease 2019.
Reference range, female.
Reference range, race—non-Hispanic white.
Includes other Pacific Islander.
Reference range, BMI 18.5–25 kg/m2.
Reference range, April 2020 to August 2020.
In the multivariable analysis, age, male sex, overweight and obesity BMI, longer length of stay, and invasive ventilation remained significantly associated with increased risk of therapeutic AC. non-Hispanic black, Asian, and Hispanic or Latino race/ethnicity became significantly associated with increased therapeutic AC, while an underweight BMI and increased CCI were associated with decreased risk of therapeutic AC dose. The Delta variant time period of July 2021-November 2021 was also no longer significant.
High D-Dimer, Greater Than Normal Platelet Count Subgroup
In the subgroup of patients with high D-dimer and greater than normal platelet count, therapeutic AC utilization was also associated with several factors. In univariate analyses, male sex compared to female (RR, 1.27; 95% CI, 1.19–1.36), BMI in the obesity range compared to healthy weight (RR, 1.27; 95% CI, 1.15–1.40), longer length of stay (RR, 1.01; 95% CI, 1.01–1.01), invasive ventilation (RR, 1.63; 95% CI, 1.53–1.75), and July-November 2021 time period (reference, April-August 2020) (RR, 1.18; 95% CI, 1.07–1.30) were associated with increased risk of therapeutic AC (Table 2). Non-Hispanic black compared to non-Hispanic white (RR, 0.90; 95% CI, .83–.97), vaccination (RR, 0.78; 95% CI, .66–.92), and higher CCI (RR, 0.93; 95% CI, .90–.95) were associated with decreased risk of therapeutic AC. In multivariable analysis, male sex, BMI in obesity range, length of stay, and invasive ventilation remained significantly associated with increased risk of therapeutic AC. Vaccination and higher CCI remained significantly associated with decreased risk of therapeutic AC.
Sensitivity Analysis
In addition to looking at utilization trends across calendar month and year, we normalized the time scale by starting time 0 at each data partner's first exposure month to COVID-19 to account for their level of experience in treating these patients. Results remained similar to the primary analyses (Supplementary Figure 2).
DISCUSSION
In this large, multicenter, longitudinal cohort study of hospitalized COVID-19 patients, we found that two-thirds received AC, with utilization remaining consistent until the introduction of the Omicron variant and decreasing afterward. In contrast, the high D-dimer and greater than normal platelet subgroup experienced a consistent rate of AC use throughout the 2-year period. Male sex, BMI in obesity range, longer length of stay, and invasive ventilation use significantly predicted therapeutic AC, while vaccination and higher CCI predicted decreased therapeutic AC.
To our knowledge, this study represents the largest population and longest observation period to evaluate AC use among hospitalized COVID-19 patients in the United States. The decreasing trend of AC use followed the emergence of the Omicron variant, which has shown to have substantially lower risk of severe outcomes, including mortality, compared to prior variants [19]. In the high D-dimer and greater than normal platelet subgroup, we found a significant increase in use of therapeutic dose AC as Delta became the dominant variant in the United States in June 2021, peaking in September 2021 [20, 21]. While this observation did not remain significant in multivariable analysis, we speculated that increased hospitalizations during the Delta surge may have affected physician decision making toward higher AC dosing.
Prior studies have identified male sex, obesity, and lack of vaccination as risk factors for poor COVID-19 outcomes [22–25]. In a US single-center study, 83% of patients who received invasive mechanical ventilation were men [26]. Proposed mechanisms for increased severity risk in men suggest hormone differences in inflammatory processes and lifestyle differences such as increased smoking, another risk factor for poorer outcomes [22]. Previous viral pandemics have also shown obesity to be associated with increased risk of hospitalization, ICU admission, and mortality with similar patterns emerging with COVID-19 [25, 27–29]. Similarly, death or invasive ventilation among hospitalized COVID-19 patients were more likely in those unvaccinated [30]. In our study, these characteristics were associated with increased therapeutic dose AC, indicating that clinicians may be making decisions for therapeutic AC by targeting patients at higher risk for poor COVID-19 outcomes.
Our study also demonstrated increased therapeutic AC dosing among patients with higher disease severity, including invasive ventilation use and longer length of stay. Invasive ventilation and length of stay were metrics associated with critically ill patients [31, 32]. Multimorbidity, determined by a higher CCI, was associated with decreased therapeutic AC. We found limited use of therapeutic dosing among patients with many comorbidities, including those with peptic ulcer disease, renal insufficiency, and liver disease, which may all increase risk of bleeding [33]. These finding suggests that frailty and bleeding risks were considered in clinical decision to determine appropriate AC dose for each patient.
The observed trends in AC use coupled with findings from the predictor analyses suggest that practice of AC use may not necessarily follow guidelines but rather are driven by clinicians’ assessment of risk and benefit. While professional guidelines on AC use for COVID-19 patients exist, clinicians may not have consensus on the optimal AC strategy due to changing landscape of COVID-19 prevention (vaccines) and treatment as well as emergence of new variants and low certainty of evidence [13]. Despite the NIH's and ASH's conditional recommendations of therapeutic-intensity over prophylactic-intensity AC in patients with acute illness who do not have suspected or confirmed venous thromboembolism, several studies including ATTACC/ACTIV-4a/REMAP-CAP showed limited benefit of therapeutic AC among all COVID-19 hospitalized patients as the pandemic progressed [34]. Scientific judgment based on clinical trials in addition to physicians’ experience may have influenced decision making to continue therapeutic AC among those who are critically ill in practice. With the observed continuation of decreasing AC utilization, further research to support updated dosing recommendations is needed to provide guidance that is useful in the changing COVID-19 landscape.
Our study has several limitations worth noting. First, due to data collection and aggregation from multiple health systems in N3C, granularity of AC dosing was not available across all institutions. To address this challenge, we excluded sites without recorded dose details. While this strategy decreased our cohort size, our assessment of medication dosing allowed for high positive predictive value in determining prophylactic and therapeutic AC dosing in patients. Second, COVID-19 hospitalization was determined using diagnosis codes and positive laboratory tests and could not be differentiated as the primary cause for admission. We limited timing of COVID-19 diagnosis near the start of admission to maximize the likelihood of a COVID-19–related visit. However, we recognize that hospitalized patients may have been admitted for an unrelated diagnosis and incidentally found to test positive for COVID-19, especially during later periods of the pandemic. Our results may also not generalize to community-based hospitals, as there is a relative lack of data among nonacademic medical centers. However, the overall distribution of age, sex, race, and ethnicity in N3C indicates a representative sample of many segments of the US population [35, 36]. Lastly, given the mass distribution of COVID-19 vaccines in the United States, which was decoupled from many electronic health record systems, COVID-19 vaccination coverage was under ascertained, and the effects of vaccination may be underestimates.
CONCLUSION
Overall, two-thirds of hospitalized COVID-19 hospitalized patients received some level of AC, while about a quarter received therapeutic dosing. There was an observed decline in any AC use coinciding with the introduction of the Omicron variant. Male sex, increased BMI, longer length of stay, and invasive ventilation predicted therapeutic AC, while vaccination was associated with reduced AC use. Our results suggest that the practice of AC use may not necessarily be influenced by guidelines but may be driven by clinicians’ assessment of risk and benefit based on patient characteristics, including vaccine status and comorbidities, COVID-19 severity, and potential variants. Further research to update dosing recommendations in the guidelines is needed to provide recommendations that are useful in the changing COVID-19 landscape.
Supplementary Data
Supplementary materials are available at The Journal of Infectious Diseases online. Consisting of data provided by the authors to benefit the reader, the posted materials are not copyedited and are the sole responsibility of the authors, so questions or comments should be addressed to the corresponding author.
Notes
Acknowledgments. This research was possible because of the patients whose information is included within the data from participating organizations (https://covid.cd2h.org/dtas) and the organizations and scientists (https://covid.cd2h.org/duas) who have contributed to the on-going development of this community resource (https://doi.org/10.1093/jamia/ocaa196). The analyses described in this publication were conducted with data or tools accessed through the National Center for Advancing Translational Sciences (NCATS) N3C Data Enclave (https://covid.cd2h.org/enclave).
We gratefully acknowledge the following core contributors to N3C: Adam B. Wilcox, Adam M. Lee, Alexis Graves, Alfred (Jerrod) Anzalone, Amin Manna, Amit Saha, Amy Olex, Andrea Zhou, Andrew E. Williams, Andrew Southerland, Andrew T. Girvin, Anita Walden, Anjali A. Sharathkumar, Benjamin Amor, Benjamin Bates, Brian Hendricks, Brijesh Patel, Caleb Alexander, Carolyn Bramante, Cavin Ward-Caviness, Charisse Madlock-Brown, Christine Suver, Christopher Chute, Christopher Dillon, Chunlei Wu, Clare Schmitt, Cliff Takemoto, Dan Housman, Davera Gabriel, David A. Eichmann, Diego Mazzotti, Don Brown, Eilis Boudreau, Elaine Hill, Elizabeth Zampino, Emily Carlson Marti, Emily R. Pfaff, Evan French, Farrukh M Koraishy, Federico Mariona, Fred Prior, George Sokos, Greg Martin, Harold Lehmann, Heidi Spratt, Hemalkumar Mehta, Hongfang Liu, Hythem Sidky, J.W. Awori Hayanga, Jami Pincavitch, Jaylyn Clark, Jeremy Richard Harper, Jessica Islam, Jin Ge, Joel Gagnier, Joel H. Saltz, Joel Saltz, Johanna Loomba, John Buse, Jomol Mathew, Joni L. Rutter, Julie A. McMurry, Justin Guinney, Justin Starren, Karen Crowley, Katie Rebecca Bradwell, Kellie M. Walters, Ken Wilkins, Kenneth R. Gersing, Kenrick Dwain Cato, Kimberly Murray, Kristin Kostka, Lavance Northington, Lee Allan Pyles, Leonie Misquitta, Lesley Cottrell, Lili Portilla, Mariam Deacy, Mark M. Bissell, Marshall Clark, Mary Emmett, Mary Morrison Saltz, Matvey B. Palchuk, Melissa A. Haendel, Meredith Adams, Meredith Temple-O'Connor, Michael G. Kurilla, Michele Morris, Nabeel Qureshi, Nasia Safdar, Nicole Garbarini, Noha Sharafeldin, Ofer Sadan, Patricia A. Francis, Penny Wung Burgoon, Peter Robinson, Philip R.O. Payne, Rafael Fuentes, Randeep Jawa, Rebecca Erwin-Cohen, Rena Patel, Richard A. Moffitt, Richard L. Zhu, Rishi Kamaleswaran, Robert Hurley, Robert T. Miller, Saiju Pyarajan, Sam G. Michael, Samuel Bozzette, Sandeep Mallipattu, Satyanarayana Vedula, Scott Chapman, Shawn T. O'Neil, Soko Setoguchi, Stephanie S. Hong, Steve Johnson, Tellen D. Bennett, Tiffany Callahan, Umit Topaloglu, Usman Sheikh, Valery Gordon, Vignesh Subbian, Warren A. Kibbe, Wenndy Hernandez, Will Beasley, Will Cooper, William Hillegass, Xiaohan Tanner Zhang. Details of contributions available at https://covid.cd2h.org/core-contributors. N3C Consortium: G. Caleb Alexander, Christopher G. Chute, Farrukh M. Koraishy, Richard A. Moffitt, Jasvinder Singh.
Availability of data and materials. We also acknowledge the following institutions whose data are released or pending in N3C:
Available: Advocate Health Care Network—UL1TR002389: The Institute for Translational Medicine (ITM) • Boston University Medical Campus—UL1TR001430: Boston University Clinical and Translational Science Institute • Brown University—U54GM115677: Advance Clinical Translational Research (Advance-CTR) • Carilion Clinic—UL1TR003015: iTHRIV Integrated Translational health Research Institute of Virginia • Charleston Area Medical Center—U54GM104942: West Virginia Clinical and Translational Science Institute (WVCTSI) • Children's Hospital Colorado—UL1TR002535: Colorado Clinical and Translational Sciences Institute • Columbia University Irving Medical Center—UL1TR001873: Irving Institute for Clinical and Translational Research • Duke University—UL1TR002553: Duke Clinical and Translational Science Institute • George Washington Children's Research Institute—UL1TR001876: Clinical and Translational Science Institute at Children's National (CTSA-CN) • George Washington University—UL1TR001876: Clinical and Translational Science Institute at Children's National (CTSA-CN) • Indiana University School of Medicine—UL1TR002529: Indiana Clinical and Translational Science Institute • Johns Hopkins University—UL1TR003098: Johns Hopkins Institute for Clinical and Translational Research • Loyola Medicine—Loyola University Medical Center • Loyola University Medical Center—UL1TR002389: The Institute for Translational Medicine (ITM) • Maine Medical Center—U54GM115516: Northern New England Clinical & Translational Research (NNE-CTR) Network • Massachusetts General Brigham—UL1TR002541: Harvard Catalyst • Mayo Clinic Rochester—UL1TR002377: Mayo Clinic Center for Clinical and Translational Science (CCaTS) • Medical University of South Carolina—UL1TR001450: South Carolina Clinical & Translational Research Institute (SCTR) • Montefiore Medical Center—UL1TR002556: Institute for Clinical and Translational Research at Einstein and Montefiore • Nemours—U54GM104941: Delaware CTR ACCEL Program • NorthShore University HealthSystem—UL1TR002389: The Institute for Translational Medicine (ITM) • Northwestern University at Chicago—UL1TR001422: Northwestern University Clinical and Translational Science Institute (NUCATS) • OCHIN—INV-018455: Bill and Melinda Gates Foundation grant to Sage Bionetworks • Oregon Health & Science University—UL1TR002369: Oregon Clinical and Translational Research Institute • Penn State Health Milton S. Hershey Medical Center—UL1TR002014: Penn State Clinical and Translational Science Institute • Rush University Medical Center—UL1TR002389: The Institute for Translational Medicine (ITM) • Rutgers, The State University of New Jersey—UL1TR003017: New Jersey Alliance for Clinical and Translational Science • Stony Brook University—U24TR002306 • The Ohio State University—UL1TR002733: Center for Clinical and Translational Science • The State University of New York at Buffalo—UL1TR001412: Clinical and Translational Science Institute • The University of Chicago—UL1TR002389: The Institute for Translational Medicine (ITM) • The University of Iowa—UL1TR002537: Institute for Clinical and Translational Science • The University of Miami Leonard M. Miller School of Medicine—UL1TR002736: University of Miami Clinical and Translational Science Institute • The University of Michigan at Ann Arbor—UL1TR002240: Michigan Institute for Clinical and Health Research • The University of Texas Health Science Center at Houston—UL1TR003167: Center for Clinical and Translational Sciences (CCTS) • The University of Texas Medical Branch at Galveston—UL1TR001439: The Institute for Translational Sciences • The University of Utah—UL1TR002538: Uhealth Center for Clinical and Translational Science • Tufts Medical Center—UL1TR002544: Tufts Clinical and Translational Science Institute • Tulane University—UL1TR003096: Center for Clinical and Translational Science • University Medical Center New Orleans—U54GM104940: Louisiana Clinical and Translational Science (LA CaTS) Center • University of Alabama at Birmingham—UL1TR003096: Center for Clinical and Translational Science • University of Arkansas for Medical Sciences—UL1TR003107: UAMS Translational Research Institute • University of Cincinnati—UL1TR001425: Center for Clinical and Translational Science and Training • University of Colorado Denver, Anschutz Medical Campus—UL1TR002535: Colorado Clinical and Translational Sciences Institute • University of Illinois at Chicago—UL1TR002003: UIC Center for Clinical and Translational Science • University of Kansas Medical Center—UL1TR002366: Frontiers: University of Kansas Clinical and Translational Science Institute • University of Kentucky—UL1TR001998: UK Center for Clinical and Translational Science • University of Massachusetts Medical School Worcester—UL1TR001453: The UMass Center for Clinical and Translational Science (UMCCTS) • University of Minnesota—UL1TR002494: Clinical and Translational Science Institute • University of Mississippi Medical Center—U54GM115428: Mississippi Center for Clinical and Translational Research (CCTR) • University of Nebraska Medical Center—U54GM115458: Great Plains IDeA-Clinical & Translational Research • University of North Carolina at Chapel Hill—UL1TR002489: North Carolina Translational and Clinical Science Institute • University of Oklahoma Health Sciences Center—U54GM104938: Oklahoma Clinical and Translational Science Institute (OCTSI) • University of Rochester—UL1TR002001: UR Clinical & Translational Science Institute • University of Southern California—UL1TR001855: The Southern California Clinical and Translational Science Institute (SC CTSI) • University of Vermont—U54GM115516: Northern New England Clinical & Translational Research (NNE-CTR) Network • University of Virginia—UL1TR003015: iTHRIV Integrated Translational health Research Institute of Virginia • University of Washington—UL1TR002319: Institute of Translational Health Sciences • University of Wisconsin-Madison—UL1TR002373: UW Institute for Clinical and Translational Research • Vanderbilt University Medical Center—UL1TR002243: Vanderbilt Institute for Clinical and Translational Research • Virginia Commonwealth University—UL1TR002649: C. Kenneth and Dianne Wright Center for Clinical and Translational Research • Wake Forest University Health Sciences—UL1TR001420: Wake Forest Clinical and Translational Science Institute • Washington University in St. Louis—UL1TR002345: Institute of Clinical and Translational Sciences • Weill Medical College of Cornell University—UL1TR002384: Weill Cornell Medicine Clinical and Translational Science Center • West Virginia University—U54GM104942: West Virginia Clinical and Translational Science Institute (WVCTSI).
Submitted: Icahn School of Medicine at Mount Sinai—UL1TR001433: ConduITS Institute for Translational Sciences • The University of Texas Health Science Center at Tyler—UL1TR003167: Center for Clinical and Translational Sciences (CCTS) • University of California, Davis—UL1TR001860: UCDavis Health Clinical and Translational Science Center • University of California, Irvine—UL1TR001414: The UC Irvine Institute for Clinical and Translational Science (ICTS) • University of California, Los Angeles—UL1TR001881: UCLA Clinical Translational Science Institute • University of California, San Diego—UL1TR001442: Altman Clinical and Translational Research Institute • University of California, San Francisco—UL1TR001872: UCSF Clinical and Translational Science Institute.
Pending: Arkansas Children's Hospital—UL1TR003107: UAMS Translational Research Institute • Baylor College of Medicine—None (Voluntary) • Children's Hospital of Philadelphia—UL1TR001878: Institute for Translational Medicine and Therapeutics • Cincinnati Children's Hospital Medical Center—UL1TR001425: Center for Clinical and Translational Science and Training • Emory University—UL1TR002378: Georgia Clinical and Translational Science Alliance • HonorHealth—None (Voluntary) • Loyola University Chicago—UL1TR002389: The Institute for Translational Medicine (ITM) • Medical College of Wisconsin—UL1TR001436: Clinical and Translational Science Institute of Southeast Wisconsin • MedStar Health Research Institute—UL1TR001409: The Georgetown-Howard Universities Center for Clinical and Translational Science (GHUCCTS) • MetroHealth—None (Voluntary) • Montana State University—U54GM115371: American Indian/Alaska Native CTR • NYU Langone Medical Center—UL1TR001445: Langone Health's Clinical and Translational Science Institute • Ochsner Medical Center—U54GM104940: Louisiana Clinical and Translational Science (LA CaTS) Center • Regenstrief Institute—UL1TR002529: Indiana Clinical and Translational Science Institute • Sanford Research—None (Voluntary) • Stanford University—UL1TR003142: Spectrum: The Stanford Center for Clinical and Translational Research and Education • The Rockefeller University—UL1TR001866: Center for Clinical and Translational Science • The Scripps Research Institute—UL1TR002550: Scripps Research Translational Institute • University of Florida—UL1TR001427: UF Clinical and Translational Science Institute • University of New Mexico Health Sciences Center—UL1TR001449: University of New Mexico Clinical and Translational Science Center • University of Texas Health Science Center at San Antonio—UL1TR002645: Institute for Integration of Medicine and Science • Yale New Haven Hospital—UL1TR001863: Yale Center for Clinical Investigation.
Disclaimer. The content is solely the responsibility of the authors and does not necessarily represent the official views of the National Institutes of Health or the N3C program.
Financial support. This work was supported by the National Center for Advancing Translational Sciences (grant number U24TR002306). K. M. A. was supported by the National Heart, Lung and Blood Institute Pharmacoepidemiology T32 Training Program (grant number T32HL139426).
References
Author notes
Potential conflicts of interest. E. L. was a part-time co-op employee at Janssen Pharmaceutical Companies of Johnson & Johnson at the time of involvement in this work. K. M. A. joined Pfizer, Inc as a full-time employee after the completion of her involvement in this work. S. S. discloses having received research funding from NIH, Cystic Fibrosis Foundation, Pfizer, Inc, Pfizer Japan, BMS, and Daiichi Sankyo; and served as a consultant for Pfizer Japan, Merck Co, Inc, and Medtronic, Inc. All other authors report no potential conflicts.
All authors have submitted the ICMJE Form for Disclosure of Potential Conflicts of Interest. Conflicts that the editors consider relevant to the content of the manuscript have been disclosed.

