


Abstract
Each year, approximately 1.1 million children are exposed in utero to human immunodeficiency virus antiretrovirals, yet their safety is often not well characterized during pregnancy. The Tsepamo study reported a neural tube defect signal in infants exposed to the integrase strand transfer inhibitor (InSTI) dolutegravir from conception, suggesting that exposure during early fetal development may be detrimental
The effects of InSTIs on 2 human embryonic stem cell (hESC) lines were characterized with respect to markers of pluripotency, early differentiation, and cellular health. In addition, fetal resorptions after exposure to InSTIs from conception were analyzed in pregnant mice.
At subtherapeutic concentrations, second-generation InSTIs bictegravir, cabotegravir, and dolutegravir decreased hESC counts and pluripotency and induced dysregulation of genes involved in early differentiation. At therapeutic concentrations, bictegravir induced substantial hESC death and fetal resorptions. It is notable that first-generation InSTI raltegravir did not induce any hESC toxicity or differentiation, at any concentration tested.
Exposure to some InSTIs, even at subtherapeutic concentrations, can induce adverse effects in hESCs and pregnant mice. Given the increasingly prevalent use of second-generation InSTIs, including in women of reproductive age, it is imperative to further elucidate the effect of InSTIs on embryonic development, as well as their long-term safety after in utero exposure.
More than half of the estimated 36 million adults with human immunodeficiency virus (HIV) are women [1]. With increasing access to combination antiretroviral therapy (cART), 85% of pregnant women with HIV worldwide now receive cART during pregnancy. This has successfully reduced vertical transmission rates to <2% globally [1]. Although most antiretrovirals (ARVs) can cross the placenta [2], the short- and long-term safety of exposure in the context of conception and pregnancy have not been fully characterized. Given how common in utero ARV exposure is, this represents an important knowledge gap identified by many researchers and care providers [2–4].
Recommended first-line cART for pregnant women typically include a nucleoside reverse-transcriptase inhibitor backbone with a base drug consisting of either the nonnucleoside reverse-transcriptase inhibitor efavirenz (EFV), the protease inhibitors ritonavir-boosted darunavir (DRVr), or ritonavir-boosted atazanavir (ATVr), or one of the integrase strand transfer inhibitors (InSTIs) dolutegravir (DTG), or raltegravir (RAL) [5, 6]. Owing to their efficacy and generally favorable tolerability, InSTIs have gained popularity and mass use [5]. Both DTG and RAL effectively suppress HIV viremia during pregnancy [7, 8], but the use of first-generation InSTI RAL is much less common than DTG, owing in part to its requirement for twice-daily administration and lack of a fixed-dose combination. Regarding other InSTIs, standard dosing of cobicistat-boosted elvitegravir (EVGc) during pregnancy results in lessened drug exposure due to reduced placental transfer [9, 10]. Data during pregnancy are limited for the more recently approved InSTIs bictegravir (BIC) and cabotegravir (CAB), but one ex vivo study suggests that both have lower than expected placental transfer [11].
Results from the Tsepamo study suggest a concerning association between exposure to DTG from conception and increased prevalence of neural tube defects [12, 13]. Other smaller cohorts have not detected any associations between DTG and rare birth defects [14–16], potentially due to a lack of power [17]. A large mouse study reported rates of neural tube defects similar to those of the Tsepamo study, from therapeutic levels of DTG administered with a nucleoside backbone [18].
Subsequent in vitro and in vivo research investigating the role of DTG has yielded conflicting results [18–22]. In vitro model systems, such as pluripotent stem cells, are a useful tool to identify early developmental drug toxicity [23–25]. For example, a recent study investigating developmental toxicity of single InSTIs in mouse and human stem cell-based third-dimensional (3D) morphogenesis models noted adverse morphological and gene expression changes after exposure to DTG [21]. Another group failed to detect any DTG effects on rat whole embryo cultures, but exposure was initiated on gestational day (GD) 9, beyond early stages of neurulation [26, 27].
A knowledge gap clearly remains around the possible effects of several cART regimens in the context of early pregnancy, especially newer InSTI-based regimens. In this study, we sought to assess the effects of InSTIs on cell viability and early differentiation potential in 2 human embryonic stem cell (hESC) lines, as well as their effect on fetal resorptions in a pregnant mouse model.
METHODS
Ethics Statement
All cell culture experiments were approved by the University of British Columbia Human Research Ethics Board (H07-03136) and the Canadian Institute of Health Research Stem Cell Oversight Committee. All animal experiments were approved by the University Health Network Animal Use Committee (protocol no. 2575.26) and performed according to the policies and guidelines of the Canadian Council on Animal Care.
Cell Culture
We used 2 model hESC lines in this study, CA1S and H9. We elected to use 2D in vitro stem cell models to allow for homogeneous drug exposure without the influence of drug transport gradients or inner cell necrosis. All cell culture experiments were conducted at 37°C in a humidified atmosphere of 5% CO2. For each independent replicate, CA1S and H9 hESCs cryopreserved in mFreSR (STEMCELL Technologies) were washed and plated on a Matrigel (Corning)-coated plate in mTeSR Plus (STEMCELL Technologies). More details are provided in the Supplementary Data. In brief, for CA1S, cells were passaged when reaching approximately 80% confluency (3–4 days), with 5 × 10⁴cells plated in each well of a Matrigel-coated 6-well plate, and the media (2 mL) changed once halfway between passages. Cells were passaged enzymatically as single cells using TrypLE Express (Invitrogen) and collected, and live cell count was determined via Trypan Blue (Bio-Rad). All culture methods were consistent between the CA1S and H9 lines except for maintenance passaging, whereby the H9 cells were passaged as cell aggregates using Versene (Invitrogen), counted via the Cell Aggregate Count Method (STEMCELL Technologies), and seeded in a 6-well plate at a density of 800 aggregates per well.
The STEMdiff Trilineage Differentiation Kit (STEMCELL Technologies) was used to produce the trilineage endoderm, mesoderm, and ectoderm differentiation controls. Cells were handled as per the kit protocol, but harvest occurred on day 3 rather than day 5 (endoderm and mesoderm) and day 7 (ectoderm).
Cell Treatments
For the cultured hESC experiments, when possible ARVs were obtained from the National Institutes of Health AIDS Reagent Program operated by the American Type Culture Collection. Bictegravir, CAB, DTG, and EVGc were purchased from Selleckchem. For additional experiments, BIC was also obtained as a powder from Cayman Chemicals and prepared from a crushed Biktarvy tablet. All ARVs were reconstituted in tissue culture grade dimethyl sulfoxide ([DMSO] Sigma-Aldrich), then diluted in mTeSR Plus media to their experimental concentration, while maintaining a final 0.1% DMSO concentration. Maximum plasma concentration (1× Cmax) used for all ARVs studied are presented in Table 1.
Maximum Plasma Concentration (1× Cmax) of ARVs Used in This Study
| Class | ARVs | In Vitro Cmax(µM)a | In Vivo Cmax(mg/kg)b |
|---|---|---|---|
| NRTI | ABC | 4.47 | |
| 3TC | 6.54 | ||
| FTC | 7.28 | ||
| TDF | 0.52 | ||
| TAF | 0.47 | ||
| NNRTI | EFV | 12.9 | |
| RPV | 0.60 | ||
| PI | LPV | 15.59 | |
| DRV | 9.17 | ||
| RTV | 1.23 | ||
| InSTI | BIC | 13.69 | 4.2 |
| CAB | 9.74 | 5.0 | |
| DTG | 8.32 | 2.5 | |
| RAL | 6.53 | 66.7 | |
| EVG | 3.77 | ||
| CYP3A | COBI | 1.52 |
Abbreviations: ABC, abacavir; ARVs, antiretrovirals; BIC, bictegravir; CAB, cabotegravir; COBI, cobicistat; DRV, darunavir; DTG, dolutegravir; EFV, efavirenz; EVG, elvitegravir; FTC, emtricitabine; InSTI, integrase strand transfer inhibitor; LPV, lopinavir; NNRTI, nonnucleoside reverse-transcriptase inhibitor; NRTI, nucleoside reverse-transcriptase inhibitor; PI, protease inhibitor; RAL, raltegravir; RPV, rilpivirine; RTV, ritonavir; TAF, tenofovir alafenamide; TDF, tenofovir disoproxil fumarate; 3TC, lamivudine.
Values are obtained from the US Food and Drug Administration (https://www.accessdata.fda.gov).
Values selected to yield dam plasma levels equivalent to those reported in pregnant women, as determined in pilot studies.
For all experiments, the n indicates independent replicates. CA1S hESCs (n = 5) were cultured for 3.5 days in the presence of 0.1% DMSO control or 1× Cmax of the after cART regimens: BIC, DTG, EVGc, RAL, or EFV on a tenofovir disoproxil fumarate (TDF)/emtricitabine (FTC) backbone; BIC, DTG, EVGc, RAL, or rilpivirine (RPV) on a tenofovir alafenamide fumarate (TAF)/FTC backbone; DTG, RAL, or DRVr on an abacavir (ABC)/lamivudine (3TC) backbone; CAB/RPV. H9 hESCs (n = 6) were cultured as described above with only the most clinically relevant regimens: DTG, RAL, or EFV on a TDF/FTC backbone; BIC or RPV on a TAF/FTC backbone; DRV on an ABC/3TC backbone; CAB/RPV. Second-generation InSTIs (DTG, BIC, CAB) were also tested at 0.5× Cmax due to the substantial cytotoxicity noted at 1× Cmax.
The dose response experiments were conducted similarly, with CA1S hESCs (n = 3) exposed to BIC, CAB, DTG, EVG, or RAL at 10 doses ranging from 0.001× to 3× Cmax and H9 hESCs (n = 6) exposed to BIC, CAB, DTG, or RAL at 4 doses ranging from 0.01× Cmax to 1× Cmax. For the reverse-transcription quantitative polymerase chain reaction (RT-qPCR) experiments, CA1S and H9 single InSTIs (BIC, CAB, DTG, and RAL) were cultured (n = 3) at 0.5× Cmax.
Flow Cytometry
Cells were stained with DAPI (BD Biosciences), Annexin V-BV711 (BD Biosciences), anti-SSEA-3-PE-Cy7 (BioLegend), and anti-TRA-1-60-BV510 (BD Biosciences) for viability, apoptosis, and pluripotency, respectively. More detailed methods are available in the Supplementary Data. Flow cytometry was conducted on the BD LSRII-561 analyzer (BD Biosciences) or the Attune NxT Flow Cytometer (Invitrogen) at the University of British Columbia flow cytometry core facility, and data were analyzed with FlowJo software v10.7.2.
Gene Expression by Reverse-Transcription Quantitative Polymerase Chain Reaction
Cells were homogenized via QIAShredder (QIAGEN) and ribonucleic acid was isolated as per the RNeasy Mini Kit protocol. Ribonucleic acid was transcribed to complementary deoxyribonucleic acid (cDNA) via RT2First Strand Kit (QIAGEN). The cDNA template was combined with RT2SYBR Green qPCR master mix (QIAGEN) and aliquoted into a custom RT2Profiler PCR array (GeneGlobeID CLAH39858; QIAGEN). More detailed methods can be found in the Supplementary Data. Information on the pluripotency and trilineage markers included in this array can be found in Supplementary Table 1. The LightCycler 480 (Roche) platform was used and data were analyzed by the -ΔΔCt method [28].
Pregnancy Mouse Model
C57BL/6J mice, bred in-house (original breeders from Jackson Laboratory), were maintained under a 12-hour light/dark cycle, with ad libitum access to food and water. Mice were fed a standard folate-sufficient laboratory diet containing 7 mg/kg folate (Teklad LM-485 Mouse/Rat Sterilizable Diet). Animals were acclimated to their surroundings for 1 week before experiment initiation. Female mice (7–12 weeks) were mated with males at a ratio of 2:1 or 3:1. Presence of vaginal plug was denoted as GD 0.5. Plugged females were randomly assigned to a control or treatment arm (BIC, CAB, DTG, or RAL). Pregnancy was confirmed by weight gain on GD 9 (>1.5 g). Fetuses were photographed and assessed for major anomalies blinded to treatment allocation.
Mice Treatment
Dolutegravir and RAL were purchased as prescription drugs, whereas BIC and CAB were purchased in powdered form (MedChemExpress). Pills were crushed, suspended in distilled water, and administered once daily by oral gavage (100 µL/mouse). Drug suspensions were prepared fresh each morning. Drug dosing was selected to yield dam plasma levels equivalent to those reported in pregnant women, as determined in pilot studies [29]. Experimental mouse groupings received either 2.5 mg/kg DTG, 66.67 mg/kg RAL, 4.17 mg/kg BIC, or 5.0 mg/kg CAB per day. Control mice received 100 µL/mouse distilled water by gavage once daily. On the day of plug detection (GD 0.5), plugged mice were randomly allocated to control (water; n = 20 dams), DTG (n = 10 dams), RAL (n = 11 dams), BIC (n = 9 dams), and CAB (n = 9 dams) and were treated once daily by oral gavage until dams were euthanized at GD 15.5.
Mice Outcome Measures
The uterus was surgically removed, and the number and location of fetuses and resorptions (residues from early fetal demise, equivalent to spontaneous abortion) were recorded. The uterus was cut to separate each conceptus, and each fetus and placenta were collected and weighed using a digital scale, and their weights were presented as litter averages. Fetal to placenta weight ratio was calculated. Fetal viability was assessed by pedal reflex. Litter size was calculated, and the number of fetuses did not include the number of resorptions.
Statistical Analyses
All hESC measurements are presented normalized to the 0.1% DMSO vehicle control within the same experiment. Before normalization, paired t tests were used to compare cART treatments in both cell lines. Specifically, the regimens were grouped according to base ARV and compared with DMSO control. Paired t tests were also used to compare the dose response of the 4 InSTIs in the H9 cell line with DMSO control. For the mouse model, comparisons were assessed between groups using analysis of variance, Kruskal-Wallis, or Fisher’s exact test. All tests were 2-tailed with significance set to P < .05. All statistical analyses were conducted using GraphPad Prism version 9.3.
RESULTS
Bictegravir- and Dolutegravir-Containing Combination Antiretroviral Therapy Show Human Embryonic Stem Cell Cytotoxicity
To examine cytotoxicity after exposure to cART, we assessed cellular health (cell count, viability, and apoptosis) and pluripotency of 2 hESC lines of opposite sex, CA1S (male), and H9 (female), via flow cytometry (Supplementary Figure 1). Exposure to BIC-, DTG-, CAB-, and EFV-containing cART reduced cell counts in both cell lines (Figure 1A and B). In addition, BIC-containing cART regimens reduced viability (Figure 1C and D) and increased levels of apoptosis (Figure 1E and F) in both cell lines. Dolutegravir-containing cART at 1× Cmax exerted a negative impact on all markers of cellular health in the H9 line. No significant impacts on cellular health were detected after exposure to combinations containing RAL, EVGc, RPV, or DRVr (Figure 1).
![Bictegravir (BIC)- and dolutegravir (DTG)-containing combination antiretroviral therapy (cART) are cytotoxic to CA1S and H9 human embryonic stem cells (hESCs). Cell count (A and B), viability (C and D), and apoptosis (E and F) after exposure to no treatment (culture media without 0.1% dimethyl sulfoxide [DMSO], Ø), or 1× Cmax (unless indicated) cART regimens, normalized to corresponding 0.1% DMSO vehicle controls (dashed lines) in CA1S (left, n = 5) and H9 (right, n = 6 with an additional n = 4 at 0.5× Cmax) cells, respectively. Cell count collected via Trypan blue; viability and apoptosis obtained via flow cytometry. Each data symbol represents an independent replicate of the indicated base drug in combination with 1 of 4 backbones distinguished by their shape (see legend). Regimens were grouped according to base drug and compared with the 0.1% DMSO vehicle control by paired t test. *, P < .05; **, P < .01; ***, P < .001.](https://oup.silverchair-cdn.com/oup/backfile/Content_public/Journal/jid/226/11/10.1093_infdis_jiac386/5/m_jiac386f1.jpeg?Expires=1749883046&Signature=y~pkwoe7T32rAiRepM3VVwf4XFf2yDd-eSWCA4XGKQ-HTfw7LXPd1JhAZT1-m3462Jt3zfPfJdOg703T3M3mdq4VwqE8wARvasP0HbYNlqnp27JlWCt3~uea5bQrJ2mQgLHDsaWvMpZjPjhoynja~-QzlHaaa3gr7RUweMg~cUDwyg~FcPQo~ZdtFWv-BJ4ySWGk2aeSg63UQOUs93tHqTK2wjm8CNLO-mvoj6bDILOLGRs7sfKJ0lJO2qqgVmbToIwGiuJoN5LDoZjCKJPTE5286R9MRaGvIqjZ04TDFLY3M42zdhAWuSB-5VPsy4pNVu4DEsNUv2ImvO8fV6IO0A__&Key-Pair-Id=APKAIE5G5CRDK6RD3PGA)
Bictegravir (BIC)- and dolutegravir (DTG)-containing combination antiretroviral therapy (cART) are cytotoxic to CA1S and H9 human embryonic stem cells (hESCs). Cell count (A and B), viability (C and D), and apoptosis (E and F) after exposure to no treatment (culture media without 0.1% dimethyl sulfoxide [DMSO], Ø), or 1× Cmax (unless indicated) cART regimens, normalized to corresponding 0.1% DMSO vehicle controls (dashed lines) in CA1S (left, n = 5) and H9 (right, n = 6 with an additional n = 4 at 0.5× Cmax) cells, respectively. Cell count collected via Trypan blue; viability and apoptosis obtained via flow cytometry. Each data symbol represents an independent replicate of the indicated base drug in combination with 1 of 4 backbones distinguished by their shape (see legend). Regimens were grouped according to base drug and compared with the 0.1% DMSO vehicle control by paired t test. *, P < .05; **, P < .01; ***, P < .001.
Exposure to Bictegravir-, Cabotegravir-, and Dolutegravir-Containing Combination Antiretroviral Therapy Results in Loss of Pluripotency Markers
CA1S cells exposed to CAB- and DTG-containing cART exhibited a >75% decrease in SSEA-3 expression (Figure 2A). H9 cells also showed significantly reduced SSEA-3 expression after exposure to CAB-containing cART at 1× Cmax; however, our power to detect a difference in the DTG-containing cART group was reduced due to cell toxicity, because 4 of 6 replicates had too few live cells remaining for flow cytometry (Figure 2B). In CA1S, there was minimal effect on TRA-1-60 levels, except for BIC-containing cART (Figure 2C). However, H9 cells exposed to both CAB- and BIC-containing cART exhibited loss of TRA-1-60 at 1× Cmax (Figure 2D). Again, power was reduced for DTG-containing regimens.

Exposure to bictegravir (BIC)-, cabotegravir (CAB)-, and dolutegravir (DTG)-containing combination antiretroviral therapy (cART) results in loss of pluripotency markers. SSEA-3+ (A and B) and TRA-1-60+ (C and D) expression normalized to corresponding 0.1% dimethyl sulfoxide (DMSO) vehicle controls (dashed lines), after exposure to no treatment (culture media without 0.1% DMSO, Ø), or 1× Cmax (unless indicated) cART regimens, in CA1S (left, n = 5) and H9 (right, n = 6, with an additional n = 4 at 0.5× Cmax) cells, respectively. Data collected via flow cytometry. Each data symbol represents an independent replicate of the indicated base drug in combination with 1 of 4 backbones distinguished by their shape (see legend). Regimens were grouped according to base drug and compared to the 0.1% DMSO vehicle control by paired t test. *, P < .05; **P < .01; ***, P < .001.
Bictegravir, Cabotegravir, and Dolutegravir Effects on Human Embryonic Stem Cell Cytotoxicity Occur in a Dose-Dependent Manner
To further investigate the effects of second-generation InSTIs on the 2 hESC lines, we conducted a dose-response study with single exposure of the 5 InSTIs. Exposure to BIC, CAB, and DTG resulted in a dose-dependent decline in live cell counts for both CA1S and H9 (Figure 3A and B). Both cell lines exposed to ≥0.5× Cmax BIC showed reduced viability (Figure 3C and D) and increased apoptosis (Figure 3E and F). H9 cells exposed to BIC exhibited 2-fold and 6-fold increases in apoptosis at 0.5× and 1× Cmax, respectively (Figure 3F), whereas exposure to 1× Cmax DTG similarly reduced cell viability (Figure 3D) and increased (7-fold) apoptosis (Figure 3F).
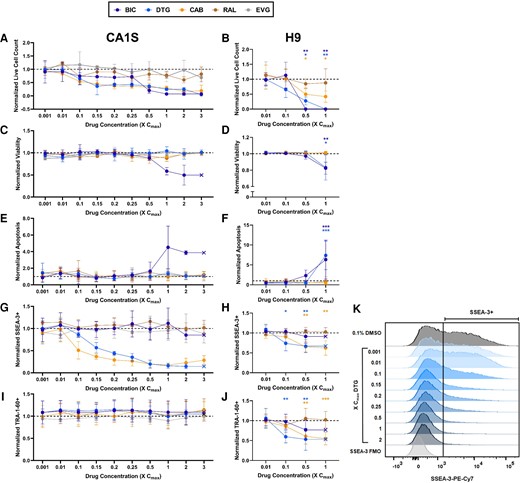
Bictegravir (BIC), cabotegravir (CAB), and dolutegravir (DTG) human embryonic stem cell (hESC) toxicity and differentiation occur in a dose-dependent manner. Live cell count (A and B), viability (C and D), apoptosis (E and F), SSEA-3+ (G and H), and TRA-1-60+ (I and J) normalized to 0.1% dimethyl sulfoxide (DMSO) control in CA1S (left, n = 3) and H9 (right, n = 6) hESCs treated with 5 (4 in H9) different integrase strand transfer inhibitors at various doses for 3.5 days. Representative SSEA3 + flow plot of DTG dose response in CA1S hESCs compared with the fluorescence minus 1 (FMO) and 0.1% DMSO controls; vertical line denotes SSEA-3 positivity (K). Cell count collected via Trypan blue; all other variables obtained via flow cytometry. Data are presented as mean and standard deviation (A, C, E, G, and I) or as mean and 95% confidence interval (B, D, F, H, and J). Exposed H9 hESCs were compared with the 0.1% DMSO vehicle control by paired t test. *, P < .05; **, P < .01; ***, P < .001.
With respect to loss of pluripotency, both cell lines exhibited a dose-dependent decrease in SSEA-3 expression with exposure to CAB and DTG, including at concentrations as low as 0.1× Cmax (Figure 3G and H). This effect was more pronounced in CA1S (Figure 3G–K). Exposure to BIC, RAL, and EVG did not affect SSEA-3 (Figure 3G and H) in either cell line, although in H9 cells, too few live cells remained to properly evaluate SSEA-3 levels at 0.5× and 1.0× Cmax (Figure 3H). For TRA-1-60, a marker lost later during differentiation, expression was unchanged after exposure to any InSTI at any concentration tested in CA1S (Figure 3I), but H9 cells displayed a dose-dependent loss of TRA-1-60 upon exposures to BIC, CAB, and DTG, the latter showing significantly lower TRA-1-60 expression at concentrations as low as 0.1× Cmax (Figure 3J).
To confirm the pronounced cytotoxicity noted with BIC exposure in both cell lines (Figures 2 and 3), additional experiments were conducted using BIC from other suppliers, as well as crushed pills. The BIC cytotoxicity remained regardless of drug source (Supplementary Figure 2).
Bictegravir, Cabotegravir, and Dolutegravir Induce Human Embryonic Stem Cell Differentiation Dysregulation
Loss of pluripotency markers may indicate spontaneous differentiation toward 1 of the 3 embryonic germ layers: mesoderm, endoderm, or ectoderm with the first 2 originating from the precursor mesendoderm. The RT-qPCR array revealed no clear differences in gene expression were noted in the CA1S cells (Figure 4A and Supplementary Figure 3A), but a trend towards increased expression of genes related to mesendodermal commitment (CXCR4, SOX17, FOXA2, TBTX) was observed in H9 cells after exposure to BIC, CAB, and DTG (Figure 4B and Supplementary Figure S3B), with the ectoderm marker PAX6 appearing most upregulated by BIC. Once again, RAL elicited the least change in gene expression.
![Bictegravir (BIC), cabotegravir (CAB), and dolutegravir (DTG) appear to induce differentiation dysregulation of human embryonic stem cells (hESC)s. Heatmap showing the mRNA expression patterns of pluripotency and early germ layer lineage gene markers in (A) CA1S hESCs and (B) H9 hESCs. Results after exposure to 4 different integrase strand transfer inhibitors at 0.5× Cmax for 3.5 days (n = 3: drug treatments and untreated [∅] are depicted on each panel). Raw computed tomography values were obtained via reverse-transcription quantitative polymerase chain reaction and normalized to housekeeping genes (GAPDH and ACTB) followed by normalization to the experimental 0.1% DMSO control. Each integer value increase or decrease on the scale indicates a 2-fold change.](https://oup.silverchair-cdn.com/oup/backfile/Content_public/Journal/jid/226/11/10.1093_infdis_jiac386/5/m_jiac386f4.jpeg?Expires=1749883046&Signature=lQqnOGcf7gYhVYwy4C~EuHvT4BDen~lbWnANpdwQdYIgDBOsQ8070A1DQHLtTgjY4QusZluE-a3mjmhAtLNU8mQ~x-lhLc0pANj4rcTqbGecFsOfpQKKVSHE9~t-duAR-Sf4JGL30UKjeO25YjSST1JPQRRsMa3Jiz0RicxWWA--wTXU11hb2eWsfPdvykdwopW96PSIOC6~RnkILzGCUVV2WQOxRwv32slpWH10COPpp23effJrg4QpVULwMRNXFRiiJKPU1KpBCHob1eTL6ni3qUlctyGve342jUYR3Et51aqUSJe64IVl4eIaK045wuoEWsJL17dQjuJx5PsYRQ__&Key-Pair-Id=APKAIE5G5CRDK6RD3PGA)
Bictegravir (BIC), cabotegravir (CAB), and dolutegravir (DTG) appear to induce differentiation dysregulation of human embryonic stem cells (hESC)s. Heatmap showing the mRNA expression patterns of pluripotency and early germ layer lineage gene markers in (A) CA1S hESCs and (B) H9 hESCs. Results after exposure to 4 different integrase strand transfer inhibitors at 0.5× Cmax for 3.5 days (n = 3: drug treatments and untreated [∅] are depicted on each panel). Raw computed tomography values were obtained via reverse-transcription quantitative polymerase chain reaction and normalized to housekeeping genes (GAPDH and ACTB) followed by normalization to the experimental 0.1% DMSO control. Each integer value increase or decrease on the scale indicates a 2-fold change.
Bictegravir Exposure Reduces Litter Size and Induces Resorption in a Pregnancy Mouse Model
To investigate whether the toxicity noted in our hESC model translated to in vivo models, we turned to a well established mouse model of antiretroviral treatment during pregnancy [18, 29, 30]. Mated females with a vaginal plug (designated as GD 0.5) were randomly allocated to either control (water; n = 20 dams, 177 fetuses), DTG (n = 10 litters, 82 fetuses), RAL (n = 11 litters, 93 fetuses), BIC (n = 9 litters, 63 fetuses), or CAB (n = 9 litters, 68 fetuses) groups and were treated once daily by oral gavage until GD 14.5 and killed on GD 15.5 (Figure 5A and B). All InSTIs were given singly at 1× Cmax.
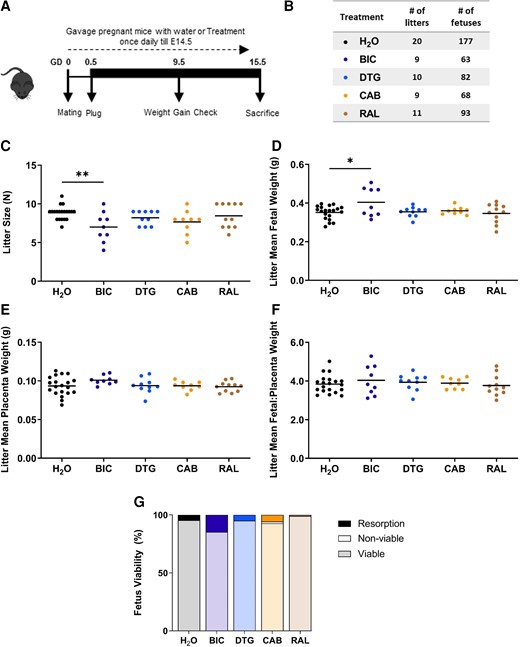
Bictegravir (BIC) exposure reduces litter size and induces resorption in a pregnancy mouse model. Schematic representation of pregnant mice treated with 1× Cmax equivalent BIC, dolutegravir (DTG) , cabotegravir (CAB), raltegravir (RAL), or H2O as a control, starting from gestational day (GD) 0.5 until the day before sacrifice GD 15.5 (A). Table representing number of litters and number of fetuses per treatment group (B). Litter size (C), litter mean fetal weight (D), litter mean placenta weight (E), litter mean fetal to placental weight ratio (F), and resorption rate (G). Data are shown as dot plots with each dot representing 1 litter and the line indicating the mean. Treatment groups were compared by analysis of variance (C, D, E, F, G) or Kruskal-Wallis. *, P < .05; **, P < .01.
Compared to the control group, litter size was significantly smaller in the BIC group (mean ± standard deviation 7.0 ± 0.9 versus 8.9 ± 1.9, P = .004) only (Figure 5C). Mean fetal weight per litter was significantly higher in the BIC treatment group compared to control (Figure 5D). The mean placental weight per litter (Figure 5E), and fetal to placenta weight ratio per litter (Figure 5F), did not differ between groups. The rate of fetal resorptions was highest in the BIC group (P = .025), mean resorptions 14.8% (standard error of the mean [SEM] = 4.9), followed by CAB at 5.6% (SEM = 3.3), DTG 4.9% (SEM = 2.0), H2O 4.6% (SEM = 1.4), and RAL 1.0% (SEM = 1.0) (Figure 5G). There was only 1 nonviable fetus (late fetal loss equivalent to stillbirth) observed in the CAB group that displayed severe deformity. One fetus in the BIC arm had mandible aplasia. Two fetuses in the RAL arm had facial clefts. These observations should be viewed with caution given the small sample size.
DISCUSSION
This study investigated the effects of exposure to InSTIs on early development using hESC and mouse models. Our results suggest that exposure to DTG and CAB at subtherapeutic concentrations can induce hESC differentiation. Overall, the hESC data further indicate that exposure to second-generation InSTIs, namely, DTG, BIC, CAB, alone or as part of a cART regimen, at or below therapeutic concentrations, exert toxic effects. These cytotoxicity effects on hESCs were most pronounced with BIC and are supported by the mouse model showing more fetal resorption and smaller litter sizes. The toxicity noted with exposure to BIC, particularly the elevated number of resorptions, is especially worrisome because they may translate in spontaneous abortions going unnoticed during early gestation, before a woman knows she is pregnant. In our models, exposure to the first-generation InSTI RAL induced essentially no effect on any measure, indicating that it is the most benign of all InSTIs.
It is imperative to determine the most pregnancy-safe cART regimens; however, children who are HIV/ARV-exposed and uninfected are not routinely followed long-term, and neurological health outcomes are relatively rare. The finding in the Botswana cohort could be a canary in a coal mine, indicating that the potential for neural implications that may arise later in life. Notably, it has been indicated that there may be an association between in utero DTG exposure and abnormal neurological outcomes from infancy to later in childhood [31]. In addition, neuropsychiatric events occur with exposure to DTG in adults [32], suggesting that exposure at any age may be detrimental to neurological health.
Our observation of decreased cell counts, although it cannot tease apart a decrease in cell proliferation versus an increase in cell death, is consistent with the decreasing 3D aggregate size reported by others with increasing DTG concentrations [21]. It is interesting to note that increased expression of mesendoderm lineage genes was also noted in their models after DTG exposure. Although their InSTI concentrations were in the same range as ours, a higher 1% DMSO drug vehicle was used for the mouse morphogenesis models [21]. We were mindful of keeping DMSO concentrations low (0.1%) because DMSO can induce spontaneous differentiation of ESCs [33].
The present study has many strengths. First, we included 2 different hESC lines of male (CA1S) and female (H9) sex and successfully replicated many of the major findings between the 2 cell lines. Second, we examined InSTIs alone, as well as in relevant cART regimens, allowing us to identify that the effects noted were due to InSTI exposure and not impacted by the cART backbone. Third, the inclusion of the mouse model allowed us to further investigate the toxicities identified in our in vitro experiments in an in vivo setting.
Although both hESC lines showed similar negative effects after exposure to InSTIs, these were often more pronounced in the H9 than in the CA1S hESC line. The CA1S cells were used to facilitate the first experiments, because they are more conducive to single-cell seeding than most hESC lines and thus are an excellent line for generating homogenous and uniform cultures [34]. This may also result in their being less prone to cell death and spontaneous differentiation. Thus, to express markers of differentiation, the CA1S cells may require longer exposure than the 3.5 days tested here.
The InSTIs are highly protein bound in vivo, and our culture media contained less protein (∼13 g/L albumin) than serum (∼40 g/L), possibly exposing cells to higher concentrations of free ARV [21, 35]. However, embryonic, and fetal exposure in utero, may be elevated relative to maternal plasma concentrations, because the drugs can accumulate in the placental tissue as seen with DTG in an ex vivo cotyledon perfusion model in which the accumulation index was 153% [36]. In addition, protein levels in fetal serum and amniotic fluid are lower than in maternal plasma, which would result in elevated unbound drug exposure [37, 38]. Furthermore, in this study, toxicity was evident at concentrations below therapeutic drug concentrations, namely, at 0.1–0.5× Cmax. Of note, despite the fact that RAL’s protein binding capacity is lower than that of the second-generation InSTIs [39], potentially translating into higher drug exposure, we did not detect any RAL cytotoxicity.
CONCLUSIONS
In conclusion, we showed evidence of cytotoxicity and loss of pluripotency in 2 hESC models after exposure to second-generation InSTIs BIC, CAB, and DTG. Exposure to BIC was especially cytotoxic and resulted in increased fetal resorptions in the mouse model. This observation is a concern that should be further investigated. In contrast, the first-generation InSTI RAL appeared benign, with a profile similar to the controls in all contexts, a reassuring finding suggesting it may be a safer alternative, warranting renewed interest in clinical investigation of RAL-based cART, particularly in women of reproductive age and those considering pregnancy. Given the rapidly increasing use of DTG and other InSTIs in first-line cART regimens, it is imperative to investigate their short- and long-term safety and determine the mechanisms responsible for the InSTI toxicity. This is particularly important in the context of exposure at conception and in early stages of embryonic development, and possible spontaneous abortions. This preclinical study provides information relevant to future trials and strategies for the treatment of women of reproductive age, because these antiretrovirals will inevitably be used during pregnancy.
Supplementary Data
Supplementary materials are available at The Journal of Infectious Diseases online. Consisting of data provided by the authors to benefit the reader, the posted materials are not copyedited and are the sole responsibility of the authors, so questions or comments should be addressed to the corresponding author.
Notes
We thank Renying Cai for critically reviewing the manuscript and the Flow Cytometry Core facility at the Life Sciences Institute of the University of British Columbia.
Author contributions. M.-S. R. S., H. M., L. S., and H. C. F. C. designed the experiments. C. S. and J. M. P. supplied the cell lines. M.-S. R. S. performed all cell culture drug exposure experiments. H. M. performed all mouse drug exposure experiments. M.-S. R. S. and L. M. performed the flow cytometry experiments. M.-S. R. S. and R. P. performed the reverse-transcription quantitative polymerase chain reaction experiments. M.-S. R. S., H. M., A. A., A. Y. Y. H., L. S., and H. C. F. C. were involved in the statistical evaluations. M.-S. R. S. and H. M. wrote the manuscript. All authors contributed edits and changes to the manuscript and approved the submitted version.
Financial support. This study was partially funded by the Canadian Institutes of Health Research (CIHR) (PJT-156007; to H. C. F. C. and L. S.) and by the Eunice Kennedy Shriver National Institute of Child Health and Human Development of the National Institutes of Health under Award Number R01HD104553 (to L. S.). M.-S. R. S. was funded by the Centre for Blood Research Graduate Award, the British Columbia Graduate Scholarship, and the CIHR Doctoral Research Award. H. M. was funded by CIHR Canadian HIV Trials Network and CIHR Postdoctoral Fellowships.
References
Author notes
Presented in part: 17th European AIDS Conference (EACS), November 2019. Basel, Switzerland; 27th Conference on Retroviruses and Opportunistic Infections (CROI), March 2020, Boston (Virtual), MA, USA; 29th Annual Canadian Conference on HIV/AIDS Research (CAHR), May 2020, Quebec (Virutal), Canada; 28th CROI, February 2022, Denver (Virtual), CO, USA; 30th CAHR, April 2022, London (Virtual), Canada.
Potential conflicts of interest. All authors: No reported conflicts of interest. All authors have submitted the ICMJE Form for Disclosure of Potential Conflicts of Interest. Conflicts that the editors consider relevant to the content of the manuscript have been disclosed.

