


Abstract
Few data exist on early-life metabolic perturbations in newborns with perinatal HIV and antiretroviral (ARV) exposure but uninfected (HEU) compared to those perinatally HIV unexposed and uninfected (HUU).
We enrolled pregnant persons with HIV (PWH) receiving tenofovir (TDF)/emtricitabine or lamivudine (XTC) plus dolutegravir (DTG) or efavirenz (EFV), and pregnant individuals without HIV, as well as their liveborn infants. Newborns were randomized to receive either zidovudine (AZT) or nevirapine (NVP) postnatal prophylaxis. Preprandial homeostasis model assessment for insulin resistance (HOMA-IR) was assessed at birth and 1 month. Linear mixed models were fit to assess the association between in utero HIV/ARV exposure and average HOMA-IR from birth to 1 month, adjusting for confounders.
Of 450 newborns, 306 were HEU. HOMA-IR was higher in newborns HEU versus HUU after adjusting for confounders (mean difference of 0.068 in log HOMA-IR, P = .037). Among newborns HEU, HOMA-IR was not significantly different between TDF/XTC/DTG versus TDF/XTC/EFV in utero ARV exposure and between AZT versus NVP newborn postnatal prophylaxis arms.
Newborns HEU versus HUU had lower insulin sensitivity at birth and at 1 month of life, raising potential concern for obesity and other metabolic perturbations later in life for newborns HEU.
NCT03088410.
Expanded access to antiretroviral treatment (ART) in pregnancy has resulted in remarkable reductions in the number of infants with perinatally acquired human immunodeficiency virus (HIV) infection [1]. Parallel to these reductions, there has also been a rise in the number of infants with perinatal HIV exposure but who are uninfected (HEU). In countries where HIV prevalence is high, the proportion of the pediatric population (0–14 years in age) that is HEU is estimated to be as high as 21%–32% [2]. Cumulative evidence supports the indisputable benefits of maternal ART in pregnancy and infant postnatal antiretroviral (ARV) prophylaxis. However, the effects of HIV and ARVs on the in utero environment and how this influences health both at the maternal-fetal intersection and through the life course of the infant needs to be understood further. In addition, the rapidly changing landscape of ARV development further widens these gaps in knowledge.
Perinatal origins of disease have been posited for many metabolic health outcomes whereby stress on the in utero environment pushes the fetus to adapt and reorganize, resulting in fetal metabolic programming that may place the child and adult at risk for adverse metabolic health [3, 4]. In utero HIV/ARV exposure may perturb metabolic pathways and represent a framework within which theories on perinatal origins of metabolic health may be studied [5–8]. Studies have shown that in utero HIV/ARV exposure is associated with altered mitochondrial DNA content and intermediary metabolism, both of which are linked to changes in insulin sensitivity and glucose metabolism [6, 7, 9–14]. Few studies have directly investigated early-life insulin sensitivity in newborns HEU compared to those perinatally HIV/ARV unexposed and uninfected (HUU) [8, 12, 15]. Furthermore, among these few studies, findings have not been consistent. The objective of our study was to assess whether in utero HIV/ARV exposure is associated with alterations in insulin sensitivity in the first month of life, and among newborns HEU, to further evaluate whether specific in utero ARV exposures or newborn postnatal ARV prophylaxis is associated with differences in early-life insulin sensitivity.
METHODS
Study Population
The Tshilo Dikotla study enrolled pregnant persons with HIV (PWH) and HIV-seronegative pregnant individuals ≥18 years of age between 16 and 36 week’s gestational age (GA) in Gaborone, Botswana from August 2016 to May 2019. Inclusion and exclusion criteria have previously been described (NCT03088410) [16]. Briefly, pregnant individuals with preexisting diabetes or multifetal gestations were excluded. All pregnant PWH received tenofovir (TDF)/emtricitabine or lamivudine (XTC) plus dolutegravir (DTG) or efavirenz (EFV); newborn postnatal ARV prophylaxis was randomized to zidovudine (AZT) or nevirapine (NVP) for the first 4 weeks of life using block randomization, and newborns received single-dose NVP at delivery per country guidelines. Botswana national guidelines recommend 4 weeks of ARV prophylaxis in all newborns at low risk for maternal-child HIV transmission, regardless of infant feeding status [17]. Newborns HEU who were considered high risk for perinatal transmission were given AZT + lamivudine (3TC) + NVP per national guidelines [17]. Pregnant PWH enrolled in our study had HIV RNA levels assessment performed at study entry, 34–39 weeks' gestation, and delivery, which additionally informed local clinical decisions on risk of perinatal transmission. This analysis included liveborn infants 1 month of age born to pregnant individuals enrolled in the Tshilo Dikotla study, without HIV infection (by HIV DNA polymerase chain reaction [PCR] testing), and with available glucose and insulin data in the first month of life. All participants provided informed consent, and institutional review boards at the Health Research and Resource Development Committee in Botswana, Ann and Robert H. Lurie Children's Hospital of Chicago, Northwestern Feinberg School of Medicine, and Massachusetts General Hospital approved the protocol.
Primary Outcomes
Insulin sensitivity was assessed using the homeostatic model assessment—insulin resistance (HOMA-IR) [18]. HOMA-IR was calculated as (fasting glucose [mg/dL]×fasting insulin [μU/mL])/405. Plasma glucose and serum insulin were measured at birth (within 72 hours of delivery) and 1 month of life. A preprandial assessment (roughly 2–3 hours after a feed and just prior to the next feed) of HOMA-IR was performed to more closely resemble a fasting state. Plasma glucose was collected in sodium fluoride EDTA collection tubes and measured within 4 hours using the enzymatic reference method with hexokinase on Roche Cobus Integra 400+ instrumentation (Roche Diagnostics), whereas serum was processed and stored at −80°C before serum insulin was measured in duplicate using an enzyme-linked immunosorbent assay (ELISA) assay (catalogue number ab278123; Abcam).
Exposure of Interest
In utero HIV/ARV exposure status was the primary exposure of interest. Secondary exposures of interest included in utero ARV exposure (TDF/XTC/DTG vs TDF/XTC/EFV) and newborn postnatal ARV prophylaxis (AZT vs NVP).
Potential Confounders
Data on sociodemographics, family history of diabetes, maternal anthropometrics, gestational diabetes, HIV immune status, and ART history, as well as newborn gestational age, anthropometrics, and exclusive breastfeeding in the first month of life were collected.
Statistical Analysis
HOMA-IR was log-transformed to more closely resemble a normal distribution. Z scores accounting for newborn age and sex were calculated for weight and length using INTERGROWTH-21st reference standards at birth and 1 month of age [19, 20]. Baseline characteristics were compared between groups using Wilcoxon or χ2 tests as appropriate. Wilcoxon rank sum tests were used to compare HOMA-IR by in utero HIV/ARV exposure at each time point (birth and 1 month). In a more robust analysis, linear mixed models were fit to assess the association between in utero HIV/ARV exposure and average log HOMA-IR from birth to 1 month of age, including fixed effects for the exposure and time point (birth and 1 month) and a random effect to account for repeated outcome measures. Models were considered with and without adjustment for confounders. Variables considered to be potential confounders were those associated with both the outcome and predictor of interest at P < .10. In addition, family history of diabetes, maternal age, education, body mass index (BMI), and gestational diabetes, as well as newborn sex, preterm birth, and birth weight Z score were considered potential confounders from a priori knowledge. Subgroup analyses were performed in newborns HEU to assess the association of in utero ARV exposure with log HOMA-IR. Models in these subgroup analyses were additionally adjusted for HIV-specific factors including maternal CD4 count, HIV RNA level, and ART use at conception. Lastly, HOMA-IR was compared between newborns randomized to AZT versus NVP postnatal ARV prophylaxis in unadjusted analyses. We performed an intention-to-treat analysis as well as a per-protocol analysis, the latter of which excluded newborns who did not receive their assigned ARV prophylaxis. To assess whether in utero ARV exposure served as an effect modifier for the relationship between newborn ARV prophylaxis and HOMA-IR, an interaction term between in utero ARV exposure and newborn ARV prophylaxis was introduced. Statistical analyses were performed using SAS Enterprise version 7.1 (SAS Institute).
RESULTS
Characteristics of Participants
A total of 450 newborns (306 HEU, 144 HUU) were included in this analysis (Figure 1). Maternal age and gravidity were higher for PWH compared to individuals without HIV (30 vs 24 years, P < .001 and 3 vs 1, P < .001 respectively; Table 1). A higher proportion of mothers of newborns HEU versus HUU achieved no more than a high school education (89.2% vs 68.8%, P < .001). Income, employment, and maternal gestational diabetes and anthropometrics, as well as newborn preterm birth (birth at <37 weeks' gestation) rates, anthropometrics, and exclusive breastfeeding in the first month of life were not significantly different between groups.
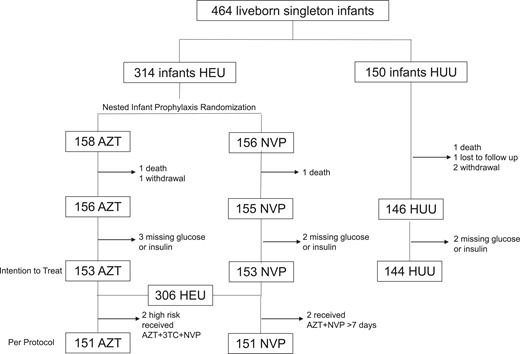
Consort diagram showing the study population enrolled and analyzed. Abbreviations: 3TC, lamivudine; AZT, zidovudine; HEU; HIV-exposed uninfected; HUU, HIV-unexposed uninfected; NVP, nevirapine.
Characteristics of Pregnant Women at Enrollment and Their Newborns by In Utero HIV/ARV Exposure
| Characteristic | Newborns HEU (n = 306) | Newborns HUU (n = 144) | P Value |
|---|---|---|---|
| Women | |||
| Sociodemographic | |||
| Age, y | 30 (25–35) | 24 (21–29) | <.001 |
| Gestational age at enrollment, wk | 28.7 (26.0–32.0) | 27.4 (25.3–30.2) | <.001 |
| Annual income, USD | .688 | ||
| >$1200 | 144 (47.1) | 73 (50.7) | |
| $240–$1199 | 32 (10.5) | 18 (12.5) | |
| <$240 | 122 (39.9) | 50 (34.7) | |
| Unsure/unknown | 8 (2.6) | 3 (2.1) | |
| Highest education secondary school or less | 273 (89.2) | 99 (68.8) | <.001 |
| Married | 18 (5.9) | 16 (11.1) | .057 |
| Employed | 157 (51.3) | 67 (46.5) | .364 |
| Past obstetric history | |||
| Gravidity | 3 (2–4) | 1 (1–3) | <.001 |
| Chronic hypertension prior to pregnancy | 18 (5.9) | 4 (2.8) | .240 |
| Family history of diabetes | 1 (0.3) | 1 (0.7) | .538 |
| Alcohol use during pregnancy | 17 (5.9) | 6 (4.6) | .652 |
| Tobacco use during pregnancy | 0 (0.0) | 1 (0.8) | .312 |
| Illicit substance use during pregnancy | 0 (0.0) | 0 (0.0) | |
| Height, cm | 161 (156–165) | 161 (156–165) | .424 |
| BMI, kg/m² | 26.5 (23.3–30.5) | 25.5 (23.0–29.6) | .112 |
| Gestational diabetes | 28 (9.2) | 10 (6.9) | .474 |
| Hypertensivea | 11 (3.6) | 3 (2.1) | .563 |
| Preeclampsia | 0 (0.0) | 0 (0.0) | … |
| HIV clinical factors | |||
| CD4 cell count >500 cells/mm³ | 143 (46.7) | … | … |
| HIV RNA level <40 copies/mL | 284 (92.8) | … | … |
| On ART prior to pregnancy | 170 (55.9) | … | … |
| ART regimen | |||
| TDF/XTC/DTG | 182 (59.3) | … | … |
| TDF/XTC/EFV | 124 (40.4) | … | … |
| Newborns | |||
| Preterm birth, <37 wks' gestational age | 47 (15.4) | 24 (16.7) | .782 |
| Gestational age at delivery, wk | 39.3 (37.9–40.3) | 39.6 (37.9–40.6) | .258 |
| Birth weight Z score | 1.2 (0.0–2.0) | 1.3 (0.0–2.4) | .126 |
| Birth length Z score | −0.2 (−0.9 to 0.6) | −0.1 (−0.8 to 0.5) | .364 |
| Exclusive breastfeeding in 1st mo of life | 216 (74.0) | 98 (77.8) | .481 |
| Preprandial glucose at birth, mg/dL | 61 (52–74) | 58 (50–70) | .050 |
| Preprandial insulin at birth, μU/mL | 2.5 (1.7–4.1) | 2.0 (1.5–3.7) | .036 |
| Preprandial glucose at 1 mo of life, mg/dL | 90 (83–97) | 88 (81–94) | .230 |
| Preprandial insulin at 1 mo of life, μU/mL | 3.4 (2.2–5.1) | 3.1 (1.8–4.4) | .010 |
Continuous variables shown as median (interquartile range) and categorical variables shown as n (%).
Abbreviations: ART, antiretroviral therapy; ARV, antiretroviral; BMI, body mass index; DTG, dolutegravir; EFV, efavirenz; HEU, HIV-exposed uninfected; HIV, human immunodeficiency virus; HUU, HIV-unexposed uninfected; TDF, tenofovir; USD, US Dollars; XTC, emtricitabine or lamivudine.
Defined as systolic blood pressure >140 mm Hg or diastolic blood pressure >90 mm Hg.
Among newborns HEU, 182 had TDF/XTC/DTG and 124 TDF/XTC/EFV in utero ARV exposure (Supplementary Table 1). Maternal age was higher for PWH receiving TDF/XTC/EFV versus TDF/XTC/DTG (32 vs 28 years, P < .001), while BMI was lower (25.6 vs 27.2 kg/m2, P = .032). In addition, a higher proportion of mothers of newborns with TDF/XTC/EFV versus TDF/XTC/DTG exposure were on ART at conception (89.5% vs 32.8%, P < .001). One hundred fifty-three newborns were randomized to receive AZT and another 153 to receive NVP postnatal prophylaxis (Supplementary Table 2). Two newborns HEU were deemed high risk at delivery and received AZT + 3TC + NVP; 2 newborns HEU received AZT + NVP erroneously for at least 7 days (Figure 1).
Overall, HOMA-IR was higher in newborns HEU at both birth and 1 month of life (0.38 vs 0.30, P = .028 and 0.76 vs 0.62, P = .019 respectively; Figure 2A and 2B). This relationship persisted even after adjusting for family history of type 2 diabetes, maternal age, education, body mass index, and gestational diabetes, as well as newborn sex, preterm birth, and birth weight Z score (mean difference of 0.068 in log HOMA-IR, P = .037; Table 2).
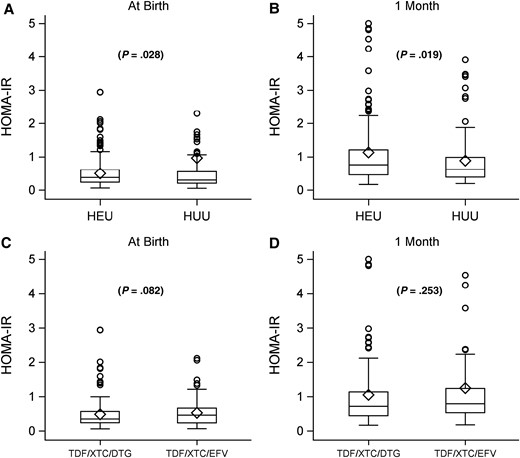
Homeostatic model assessment-insulin resistance (HOMA-IR) comparing neonates with perinatal HIV exposure who are uninfected (HEU) versus those without perinatal exposure and uninfected (HUU) at birth (A) and 1 month of life (B). HOMA-IR among neonates HEU comparing tenofovir (TDF)/lamivudine or emtricitabine (XTC)/dolutegravir (DTG) versus TDF/XTC/efavirenz (EFV) at birth (C) and 1 month of life (D). Circles represent individual participant values and diamonds mean group values; boxes cover the interquartile range and the vertical line splitting boxes represent the median.
Linear Mixed Models Showing Unadjusted and Adjusted Mean Differences in Log HOMA-IR From Birth to 1 Month of Life by Exposure of Interest
| Model | Unadjusted Mean Difference (95% CI) | P Value | Adjusted Mean Difference (95% CI) | P Value |
|---|---|---|---|---|
| Model 1, including all HEU and HUUa | ||||
| HEU versus HUU | .064 (.007 to .120) | .027 | .068 (.004 to .132) | .037 |
| Model 2, only HEUb | ||||
| In utero TDF/FTC/DTG versus TDF/FTC/EFV | −.048 (−.109 to .012) | .118 | −.021 (−.098 to .055) | .580 |
Abbreviations: CI, confidence interval; DTG, dolutegravir; EFV, efavirenz; FTC, emtricitabine; HEU, HIV-exposed uninfected; HIV, human immunodeficiency virus; HOMA-IR, homeostatic model assessment-insulin resistance; HUU, HIV-unexposed uninfected; TDF, tenofovir.
Adjusted for family history of diabetes, maternal age, education, body mass index, and gestational diabetes, as well as newborn sex, preterm birth, and birth weight Z score.
Adjusted for maternal CD4 count, HIV RNA level, and antiretroviral therapy use at conception in addition to the confounders listed above in model 1.
Among newborns HEU, HOMA-IR was similar between newborns HEU at both birth and 1 month of life with TDF/XTC/DTG versus TDF/XTC/EFV in utero ARV exposure (Figure 2C and 2D) even after additionally adjusting for maternal CD4 count, HIV RNA level, and ART use at conception (Table 2). When we compared HOMA-IR between postnatal ARV prophylaxis randomization groups, there were no significant differences between groups either by intention-to-treat analysis or by per-protocol analysis (Table 3). Lastly, in utero ARV exposure did not modify the effect of newborn postnatal ARV prophylaxis on log HOMA-IR (P = .491, data not shown).
HOMA-IR by Randomized Postnatal ARV Prophylaxis Among Newborns HEU
| AZT (n = 153) | NVP (n = 153) | P Valuea | |
|---|---|---|---|
| Birth | |||
| Preprandial glucose, mg/dL | 63 (56–76) | 59 (53–72) | .031 |
| Preprandial insulin, μU/mL | 2.32 (1.68–3.95) | 2.67 (1.66–4.26) | .346 |
| HOMA-IR | 0.36 (0.23–0.56) | 0.39 (0.24–0.65) | .573 |
| 1 month | |||
| Preprandial glucose, mg/dL | 90 (85–97) | 88 (83–95) | .479 |
| Preprandial insulin, μU/mL | 3.60 (2.22–5.04) | 3.34 (2.12–5.10) | .399 |
| HOMA-IR | 0.79 (0.49–1.19) | 0.72 (0.43–1.22) | .415 |
All values expressed as median (interquartile range) and P values from Wilcoxon test.
Abbreviations: 3TC, lamivudine; ARV, antiretroviral; AZT, zidovudine; HEU, with in utero HIV/ARV exposure and uninfected; HOMA-IR, homeostatic model assessment-insulin resistance; NVP, nevirapine.
After excluding n = 2 high-risk newborns who received AZT/3TC/NVP and n = 2 newborns who received AZT/NVP, median birth and 1-month HOMA-IR for AZT versus NVP were similar (0.37 vs 0.46, P = .147 and 0.80 vs 0.76, P = .640, respectively).
DISCUSSION
We report one of the largest studies on neonatal insulin sensitivity in sub-Saharan Africa in an era of contemporary in utero HIV/ARV exposure. In this cohort of pregnant PWH and their infants, in utero HIV/ARV exposure was associated with lower insulin sensitivity at birth and at 1 month of life. Among newborns HEU, no differences in insulin sensitivity were observed between TDF/XTC/DTG versus TDF/XTC/EFV in utero ARV exposure or AZT versus NVP newborn postnatal prophylaxis arms.
Few large studies have evaluated neonatal HOMA-IR from birth through the first month of life, but studies have reported ranges of HOMA-IR in the first few days of life in term appropriate-for-gestational age (AGA) newborns between 0.29–1.8, congruent with our findings [21–24]. Two studies in China showed comparisons between newborns with intrauterine growth restriction or small-for-gestational age (SGA) versus AGA newborns and demonstrated the former to have lower insulin sensitivity [21, 22]. Our data suggest that the pattern of insulin sensitivity observed between newborns HEU versus HUU may follow that of SGA versus AGA newborns, despite the fact that newborns HEU in our study were not more likely to have lower birth weight Z scores than newborns HUU. Because of this, we also adjusted for birth weight Z scores in final analyses and still observed a significant difference in insulin sensitivity by HEU status. Metabolic similarities between the HEU and SGA population raise speculation that HEU status may be associated with a heightened risk for future adverse metabolic health because SGA is firmly linked to both insulin resistance and risk for type 2 diabetes later in life [25, 26].
Few studies have evaluated insulin sensitivity in early life among newborns HEU. One small study in Brazil reported lower cord blood insulin in newborns HEU exposed in utero to triple drug ART or AZT monotherapy compared to newborns HUU [15]. We recently demonstrated the opposite where cord blood insulin and C-peptide were significantly higher, likely reflecting relative decreased insulin sensitivity in newborns HEU versus HUU in a US cohort [8]. While our study in Botswana did not have cord blood specimens, it is interesting to note that the findings in our Botswana and US studies share congruencies where newborns HEU had lower insulin sensitivity compared to those HUU. Differences in sample size, in utero ARV exposure, and geographical study populations may partially explain the conflicting results between the early Brazilian study and our studies in the US and in Botswana.
Lower insulin sensitivity in early life is associated with newborn and childhood adiposity and obesity [27–29]. The Hyperglycemia and Adverse Pregnancy Outcome (HAPO) Study has observed direct associations between neonatal cord C-peptide and childhood BMI and fat mass [29]. Other studies have reported similar associations of cord blood insulin or C-peptide with neonatal adiposity [27, 28], and neonatal adiposity is known to be independently predictive of childhood adiposity [29, 30]. Although insulin and HOMA-IR in our study appeared to be at levels that did not reach threshold definitions for insulin resistance in adults, the higher insulin and HOMA-IR indicative of lower insulin sensitivity in newborns HEU compared to HUU in our study raises concern for an increased risk of obesity and adiposity later in life for this population.
Among newborns HEU, we did not observe differences in early-life HOMA-IR by in utero ARV exposure (EFV vs DTG) or newborn ARV prophylaxis arms (AZT vs NVP), which is reassuring in light of expanding use of DTG in pregnancy worldwide. We previously showed data from an observational study in Cameroon that insulin sensitivity and fuel utilization were altered comparing 3 groups of infants at 6 weeks of life: infants HEU receiving AZT prophylaxis, infants HEU receiving NVP prophylaxis, and infants HUU [12]. Small numbers in the AZT infant prophylaxis group and the observational nature of this study in Cameroon prompted us to conduct our nested randomized trial in Botswana to directly compare infant prophylaxis regimens. Our results in Botswana provide some evidence that infant AZT and NVP prophylaxis are not significantly different in their association with insulin sensitivity, at least early in life immediately following completion of infant prophylaxis. This is contrary to what was observed in the Cameroon study. Potential reasons for this include differences in study design, time period of the study conduct, sample size, geographical location, and in utero ARV exposure. Differences in in utero ARV exposure between the studies are likely a function of variations in country guidelines for ART use in pregnancy and temporal differences in ART brought about by the rapid changes in ARV development and introduction of new ARVs over the time course of the 2 studies. While we had less heterogeneity in in utero ARV exposure in the Botswana study, it was important to confirm that the effect of the newborn prophylaxis arm on HOMA-IR did not differ by in utero ARV exposure, which we did when we tested for this interaction. The similarities in AZT and NVP newborn postnatal prophylaxis on early-life insulin sensitivity, particularly in a largely breastfeeding population where maternal ART was continued postpartum and beyond, is reassuring.
Our study was limited by its single-site location in Botswana, restricting overall worldwide generalizability. However, currently, the overwhelming majority of newborns HEU reside in sub-Saharan Africa, and half of the newborns HEU in our study were exposed to in utero ARVs that reflect current US and World Health Organization guidelines for the treatment of HIV infection in pregnancy [31, 32]. In addition, we were not able to employ a gold standard method for assessing insulin sensitivity such as the hyperinsulinemic-euglycemic clamp [33] in our newborns. This method is cumbersome and invasive and would not have been feasible in our population. Nonetheless, we were able to standardize measurements of insulin and glucose to calculate HOMA-IR and use variations of these 3 assessments to characterize insulin sensitivity, which has been used in the current literature for infant populations. We were also unable to disentangle the effects of in utero exposure to HIV infection from ART because the current standard of care for pregnant PWH is to treat all with ART. Lastly, there was some heterogeneity in infant feeding, which occurred due to changes in infant feeding choice by the mother after delivery or the need to mitigate perinatal HIV transmission. We did, however, adjust for exclusive breastfeeding status.
In this cohort in Botswana, newborns HEU had lower insulin sensitivity at birth and at 1 month of age compared to newborns HUU, raising the concern that there may be a propensity for increased adiposity, obesity, and other metabolic perturbations later in life for children HEU. Among newborns HEU, insulin sensitivity was not significantly different between in utero EFV and DTG exposure, as well as between AZT and NVP newborn postnatal prophylaxis, which is reassuring. Future studies to investigate further longitudinal changes in infant/child insulin sensitivity, the long-term implications of early-life alterations in insulin sensitivity, as well as the metabolic health of newborns HEU as they age into adulthood are needed to shed light on the maternal-fetal metabolic axis within the paradigm of in utero HIV/ARV exposure.
Supplementary Data
Supplementary materials are available at The Journal of Infectious Diseases online. Consisting of data provided by the authors to benefit the reader, the posted materials are not copyedited and are the sole responsibility of the authors, so questions or comments should be addressed to the corresponding author.
Notes
Author contributions. J. J., M. G., I. J. K., E. J. A., and K. P. conceptualized the study. J. J. wrote the first draft of the manuscript and had primary responsibility for the final content and approval of the paper. S. S., L. B., and K. P. made edits on the first draft. S. S. and L. B. analyzed the data. J. L. ensured data integrity for analysis. L. B. made significant edits to the “Methods/Results” sections. All authors reviewed the final manuscript.
Financial support. This work was supported by the National Institute of Diabetes and Digestive and Kidney Diseases, National Institutes of Health (NIH) (grant number R01DK109881). M. G. was supported by the National Institute of General Medical Sciences, NIH (grant number P20-GM113134). I. K. was supported by NIH grant to the Stable Isotope and Metabolomics Core Facility of the Diabetes Research and Training Center of the Albert Einstein College of Medicine (grant number P60DK020541).
References
Author notes
Presented in part: Conference on Retroviruses and Opportunistic Infections, Boston, MA, March 2021.
Potential conflicts of interest. MEG has a research contract from Novo Nordisk; serves as a consultant/advisory board member/advisor for Adrenas, Daiichi-Sankyo, Eton Pharmaceuticals, Ferring, Gilead, Neurocrine Biosciences, Novo Nordisk, Nutritional Growth Solutions, Pfizer, and QED; acts as a data safety monitoring board member for Ascendis, Millendo, and Tolmar; receives royalties from UpToDate and McGraw-Hill; and receives consultant fees from Gilead Sciences. All other authors report no potential conflicts.
All authors have submitted the ICMJE Form for Disclosure of Potential Conflicts of Interest. Conflicts that the editors consider relevant to the content of the manuscript have been disclosed.

