


Abstract
Oral preexposure prophylaxis (PrEP) in the form of tenofovir-disoproxil-fumarate/emtricitabine is being implemented in selected sites in South Africa. Addressing outstanding questions on PrEP cost-effectiveness can inform further implementation.
We calibrated an individual-based model to KwaZulu-Natal to predict the impact and cost-effectiveness of PrEP, with use concentrated in periods of condomless sex, accounting for effects on drug resistance. We consider (1) PrEP availability for adolescent girls and young women aged 15–24 years and female sex workers, and (2) availability for everyone aged 15–64 years. Our primary analysis represents a level of PrEP use hypothesized to be attainable by future PrEP programs.
In the context of PrEP use in adults aged 15–64 years, there was a predicted 33% reduction in incidence and 36% reduction in women aged 15–24 years. PrEP was cost-effective, including in a range of sensitivity analyses, although with substantially reduced (cost) effectiveness under a policy of ART initiation with efavirenz- rather than dolutegravir-based regimens due to PrEP undermining ART effectiveness by increasing HIV drug resistance.
PrEP use concentrated during time periods of condomless sex has the potential to substantively impact HIV incidence and be cost-effective.
Despite declining incidence, human immunodeficiency virus (HIV) remains a major public health challenge in South Africa. The roll-out of oral preexposure prophylaxis (PrEP) of tenofovir disoproxil fumerate (TDF) and emtricitabine (or lamivudine) to further reduce HIV incidence began with female sex workers (FSW), men who have sex with men (MSM), and adolescent girls and young women (AGYW). Model-based analyses are increasingly used to inform allocation of limited resources [1, 2]. Cost-effectiveness studies of PrEP, mainly conducted before the current universal eligibility for antiretroviral therapy (ART), have cast doubt over its cost-effectiveness, in South Africa as well as elsewhere [3–12]. There has, however, been relatively little attention given to considering that people might in practice concentrate their PrEP use only during periods of condomless sex. In addition, there is a risk of taking PrEP while unknowingly having HIV, due to starting PrEP when already infected with HIV (caused by <100% HIV test sensitivity or due to being in the primary infection window period), or becoming infected while taking PrEP, due to suboptimal adherence, less than 100% PrEP efficacy, or infection with PrEP drug-resistant virus. Use of PrEP in people with HIV is associated with a risk of resistance to lamivudine or emtricitabine and TDF, which are also used as part of first-line ART [13]. Consequently, there is a risk that efficacy of ART is undermined, with further transmission of drug-resistant virus [13]. While most cost-effectiveness evaluations have not explicitly taken this into account, modelling studies have suggested that resistance concerns should not preclude the use of PrEP [14–16]. The risk of resistance emerging is influenced by the length of time people with HIV stay on PrEP and hence by the frequency of HIV testing in people on PrEP. The World Health Organization (WHO) recommends 3-monthly testing for PrEP users [17]. Less-frequent testing may improve retention on PrEP and reduce the cost of PrEP delivery but would have the disadvantage of extending the period in which people inadvertently take PrEP while having HIV.
With these considerations in mind, we present an updated assessment of the cost-effectiveness of oral PrEP with TDF and emtricitabine in the context of the KwaZulu-Natal (KZN) province of South Africa, a province characterized by particularly high prevalence of HIV [18–22].
METHODS
We updated a previously described individual-based model of HIV transmission, progression, and the effect of ART [23, 24] calibrating to the KZN epidemiological context, and undertook 500 model runs, which are referred to as scenarios. Each time the model is run it simulates data in 3-monthly time steps on whether the person has an on-going primary condomless sex partner, the number of other condomless sex partners, HIV acquisition, and, in people with HIV, viral load, CD4 count, use of specific ART drugs (eg, use of TDF-lamivudine-efavirenz as first-line regimen up to 2019), adherence, resistance, and risk of HIV-related death. Details of the model and how it was calibrated to data from KZN are described in the Supplementary Material. The model was programmed in SAS 9.4 (SAS Institute).
We considered scale up of PrEP implementation from 2017 in either (1) FSW having multiple condomless sex partners (women who had >5 short-term condomless sex partners in a 3-month period in the past year) and AGYW (defined as women aged 15–24 years; PrEP-for-AGYW/FSW), or (2) all men and women aged 15–64 years (PrEP-for-all). We refer to these as 2 alternative policies, and we compare predicted outcomes of these 2 policies with no PrEP introduction.
Parameter values relating to many aspects of PrEP are uncertain and some will likely vary between populations and settings. We set out below our primary analysis assumptions; we explore variations in these assumptions in sensitivity analyses. Our primary analysis involves relatively high use of PrEP concentrated in periods of condomless sex, which is hypothesized to be potentially attainable by future PrEP programs that have learned from experiences, rather than the current status of programs. We assume PrEP is offered to people who have at least 1 condomless sex short-term partner in a 3-month period, or a condomless sex on-going primary partner who is diagnosed with HIV but not taking ART, and that individuals who initiated PrEP only take PrEP subsequently in 3-month periods in which they have at least 1 such condomless sex partner. We assume that the first-line ART regimen in use in new ART initiators will be dolutegravir-lamivudine-TDF in all adults from 2019 onwards, given the strong recommendation from WHO to use this regimen [25]. Results for intermediate outcomes such as HIV incidence are shown over the 20 years period 2018–2037. The primary population health outcome measure was disability-adjusted life-years (DALYs), which is a generic measure that captures both premature mortality and morbidity. Our model allows direct calculation of DALYs for each individual, which can then be summed. Disability weights are based on Salomon et al [26]. DALYs and costs are compared over a period of up to 50 years, allowing the effects of HIV prevention to play out in terms of DALYs averted in those for whom infection in earlier life was averted.
The PrEP adherence level for an individual, quantified on a scale of 0%–100% is the proportion of the drug target level that is attained for episodes of condomless sex in a given 3-month period. We assume an average adherence level per individual but with within-person variability between 3-month periods. We further assume that 50% of adolescents and young people aged 15–24 years will be half as likely to adhere to PrEP compared to the rest of the population [27]. When providing PrEP-for-AGYW/FSW the assumptions result on average in 12% of people on PrEP with <50% adherence, 33% with 50%–79% adherence, and 55% with ≥80% adherence. The corresponding values for PrEP-for-all are 10%, 28%, and 62%. PrEP efficacy, defined as the percent reduction in risk of HIV acquisition from a given HIV-positive condomless sex partner with nonresistant virus under 100% PrEP adherence is assumed to be 95%. PrEP effectiveness (what is measured in real-life conditions) is assumed to be proportional (0.95-fold) to the PrEP adherence level, so in a person with current PrEP adherence of 80% the current effectiveness would be 0.95 × 80% = 76%. Given the adherence distribution, average effectiveness as implemented was 70% for PrEP-for-AGYW/FSW (ie, average 70% protection from each infected condomless partner in a 3-month period, 73% for PrEP-for-all), which compares with effectiveness estimates of 75% and 62%, respectively, in the Partners PrEP and TDF2 studies [28, 29]. We also assume that 15% of 15–64 year olds who are not FSW (and 5% of FSW) will not consider starting PrEP even if eligible. Amongst those who would consider PrEP and for whom the condomless sex criteria are met, there is a 50% additional probability of being tested for HIV in each 3-month period (beyond background rates of testing); for those who test as HIV negative we assume an 80% chance that PrEP is initiated. After stopping PrEP due to having 1 or more 3-month periods with no condomless sex partners, PrEP can be restarted (with 95% probability) if the person tests HIV negative and again has condomless sex partners. Continuation of PrEP involves 3-monthly HIV testing. We consider that people may choose to stop PrEP despite condomless sex criteria being met (3% probability of discontinuation per 3 months, 20% chance of resumption per 3-month period of the condomless sex criteria being met). There is assumed to be no increases in condomless sex in the population as a result of PrEP being introduced. As mentioned, we recognize that in the early stages of PrEP roll-out in sub-Saharan Africa these levels of PrEP uptake and persistence of use have not been attained [30], but hypothesize that these are achievable as implementation lessons are learned [31], and we wished to explore the potential of PrEP, conditional on programs being able to achieve our implementation conditions.
PrEP is assumed to have 50% efficacy against a virus containing both M184V and K65R mutations (conferring resistance to lamivudine/emtricitabine and TDF, respectively) but fully efficacious (ie, efficacy = 95%) otherwise. We explored other assumptions in sensitivity analysis, including that K65R mutation confers reduced efficacy regardless of presence of the M184V mutation. Our primary assumptions result in outputs of resistance emergence for persons who inadvertently take PrEP having been infected with HIV of mean 38% and 7% with M184V and K65R, respectively, by 3 months of infection [13, 32]. We assume that voluntary medical male circumcision, HIV testing, and ART initiation given HIV diagnosis all continue to occur at the 2017 rate.
Costs were estimated from the provider perspective, the South African government, on the basis of resource use due to PrEP (eg, clinic visits, PrEP use, and HIV tests) as well as subsequent health care interventions (ART and treatment of HIV-related diseases) and associated unit costs at relevant South African public-sector prices for 2017 [33, 34] and converted to US dollars at an exchange rate of 13.6 ZAR/USD (Supplementary Material). The modelled cost per year for a person on PrEP is US$136 (US$36 for 4 3-monthly HIV tests as recommended, US$40 for 4 clinic visits and laboratory costs and demand generation, and US$60 for PrEP drugs, regardless of PrEP adherence) [30, 33, 34]. Our assumptions regarding unit costs result in a mean cost of clinical care (including ART costs) per year per person with HIV in care (in 2017) of US $367 in the South African setting.
In the cost-effectiveness analysis, both costs and health outcomes were discounted at 3% per annum, with a 7% local discount rate based on the South African Reserve Bank repurchase rate used in sensitivity analysis [35]. We assess cost-effectiveness using a measure called net DALYs, which account for the opportunity costs of health benefits foregone when an intervention is delivered as well as the health benefits, by use of the cost-effectiveness threshold, and are calculated as DALYs + costs/cost-effectiveness threshold. Incremental net DALYs show the difference between the health generated with the policy (compared with the no PrEP policy) and the health that would have been generated elsewhere in the health care system if the required resources were instead used for alternative purposes. The policy with the lowest net DALYs incurred is the one that would be selected as the cost-effective policy choice with the common approach using incremental cost-effectiveness ratios. We use a cost-effectiveness threshold of $750, as this is approximately the cost per life year averted of HIV interventions at the borderline for inclusion within the South African HIV Investment Case that prioritizes use of the national HIV budget on the basis of intervention cost-effectiveness [36]. We therefore adopt an opportunity-cost based assessment of cost-effectiveness, rather than using GDP-per-capita–based thresholds that are now recognized as being too high, especially for middle-income countries like South Africa [36–38].
RESULTS
The HIV epidemic and programmatic characteristics estimated by the model for KZN in 2017 and comparable observed data are shown in Table 1. Table 2 shows the predicted effect of the PrEP policies on a range of intermediate outputs relating to PrEP use over the next 20 years. On average, around 8% of 15 to 24-year-old females are projected to be on PrEP at any point in time (ie, in a given 3-month interval) over the next 20 years, with 1.3% (with PrEP-for-AGYW/FSW) and 3.4% (PrEP-for-all) of all people aged 15–64 years (and 25% and 29% of FSW, respectively) on PrEP. Of women aged 15–24 years who have 1 or more condomless sex partners in a 3-month period, the average proportion on PrEP at any 1 point in time over the next 20 years is 37%. In 20 years’ time, under the PrEP-for-AGYW/FSW policy 0.4% of all people would have taken PrEP in their lifetimes for over 5 years, and 1.4% for the PrEP-for-all policy. In the PrEP-for-all policy, 2.1% of people on PrEP are expected to be (unknowingly) infected with HIV (2.7% under PrEP-for-AGYW/FSW).
HIV Epidemic and Programmatic Characteristics in 2017, KZN, South Africa, Based on 500 Model Runs
| Characteristic | Model, Median (90% range) | Examples of Observed Data (Location, Year) |
|---|---|---|
| HIV prevalence, % | ||
| Age 15–49 y, men and women combined | 27 (25–29) | 27 men and women (19.8 men, 33.0 women) (KZN, 2017) [22] |
| Age 15–19 y, men/women | 2.3/7.4 | 2.2/8.5 (KZN, 2012) [21] 3.6/5.3 (KZN, 2017) [22] |
| Age 20–24 y, men/women | 8.7/24.4 | 10.0/25.5 (KZN, 2012) [21] 7.8/18.1 (KZN, 2017) [22] |
| Female sex workersa | 72 (60–84) | 7.6/22.3 aged 15–24 y (2014/2015) [20] 76 (2015) [39] |
| HIV incidence/100 person-years | ||
| Age 15–49 y men and women combined | 2.6 (1.9–3.2) | 3.3 (2012) [21] |
| Age 15–24 y women | 3.6 (2.1–5.4) | 1.5 in women aged 15–24 y; 0.93 in women aged 15–49 y (South Africa as a whole, 2017) [22] |
| Female sex workersa | 60 (28–109) | |
| Proportion of new infections from new/short-term partners | 51 (38–66) | No data identified |
| Proportion of HIV-positive people diagnosed, % | 83 (75–89) | 83 (2015) [40] 84.9 (South Africa, 2017) [22] 76 (2013) [41] 77 in men aged 15–49 y; 90 in women aged 15–49 y (KZN, 2017) [22] |
| Proportion of diagnosed people who are on ART, % | 76 (70–83) | 71 (South Africa, 2017) [22] 77 in men aged 15–49 y; 79 in women aged 15–49 (KZN, 2017) [22] |
| Proportion of all HIV-positive people with viral load <1000 copies/mL, % | 50 (44–57) | 55 in women, 42 in men, <400 copies/mL (2014/2015) [20] 52 in HIV+ people are on ART with VL <1000 (South Africa, 2017) [22] 67.5 in all HIV+ people, including people with VL 1000 not on ART (KZN, 2017) [22] |
| Number of adults on ART | 1 144 000 | 1 222 000 (2017) personal communication, authors |
| Of people on ART, proportion with VL <1000 copies/mL, % | 82 (79–88) | 87 women, 84 men, <400 copies /mLb (2014/2015) [20] 85, <400 copies/mL (South Africa, 2015) [40] 77 in men aged 15–49 y; 89 in women aged 15–49 y (KZN, 2017) [22] |
| Of people who started ART 1 year ago and are still on ART, proportion with VL <500 copies/mL, % | 80 (70–89) | No data identified |
| Of people on ART with VL >1000 c0pies/mL, proportion with K65R/M184V mutation in majority of virus, % | 64 (44–79) / 92 (85–95) | 56–60 (Africa) [42] 59–71 (Africa) [42] |
| Proportion of all people with HIV who have viral load >1000 copies/mL and carry M184V/K65R in majority of virus, % | 11 (7–14) / 7 (4–11) | No data identified |
| Of people starting ART, proportion with NNRTI drug resistance, % | 11 (5–17) | 14 [43, 44] |
| Proportion of women who are female sex workers,a % | 2.8 (0.9–4.7) | 0.4–4.3 (urban areas in SSA, 2006) [45] 0.9 [46] |
| Proportion of men aged 15–64 y (aged 15–24 y) who are circumcised, % | 35 (31–45) | 32 medically circumcised [22] |
| Cost of clinical care, including ART costs, per year per person with HIV in care, mean | $367 | $240, excluding inpatient costs [34] |
People aged 15–64 y unless stated. Population size 7.1 million, AGYW 1.1 million.
Abbreviations: AGYW, adolescent girls and young women; ART, antiretroviral therapy; HIV, human immunodeficiency virus; KZN, KwaZulu-Natal; NNRTI, nonnucleoside reverse transcriptase inhibitor; SSA, sub-Saharan Africa.
aFemale sex workers defined as women having >5 condomless sex partners in a 3-month period in past year.
bSome people on ART with poor adherence do not report being on ART, which affects comparison of model output with observed data.
Predicted Effects of PrEP Policies on Use and Intermediate Health Outcomes Over 20 Years (2017–2036)
| Outcome Mean, % (90% Uncertainty Range; 95% CI)a,b | |||
|---|---|---|---|
| No PrEP | PrEP for AGYW/FSW | PrEP for All | |
| Proportion of women aged 15–24 y on PrEP | 0 | 7.6 (3.4–12.4; 7.3–7.9) | 7.9 (3.5–12.7; 7.6–8.2) |
| Proportion of people aged 15–64 y on PrEP | 0 | 1.3 (0.6–2.0; 1.3–1.3) | 3.4 (1.9–5.4; 3.4–3.4) |
| In 2037, proportion of people aged 15–64 y ever taken PrEP | 0 | 13 (8–17; 13–13) | 31 (23–39; 31–32) |
| Of women aged 15–24 y who have ≥1 new condomless sex partner in a 3-month period, proportion on PrEP | 0 | 37 (28–45; 36–38) | 37 (30–46; 36–38) |
| Number of people on PrEP | 0 | 103 000 (49 000–159 000; 100 000–106 000) | 275 000 (151 000–444 000; 266 000–284 000) |
| Of people on PrEP, percent with (undetected) HIVc | … | 2.7 (1.0–5.1; 2.6–2.8) | 2.1 (0.8–3.4; 2.0–2.2) |
| Of all people living with HIV, percent on ART | 75 (68–80; 75–75) | 76 (70–81; 76–76) | 79 (73–84; 79–79) |
| Of people starting ART, proportion with NNRTI drug resistance | 9 (4–14; 8–9) | 10 (5–16; 10–10) | 14 (8–22; 14–14) |
| Proportion of all people with HIV who have viral load >1000 copies/mL and carry M184V/K65R in majority of virus | 6 (4–8; 6–6) / 4 (2–7; 4–4) | 7 (4–9; 7–7) / 5 (2–7; 5–5) | 8 (5–10; 8–8) / 6 (3–9; 6–6) |
| Of people starting ART, proportion with resistance to at least 1 drug in their 1st-line regimen | 7 (4–10; 7–7) | 11 (7–16; 11–11) | 22 (15–29; 22–22) |
| Of people who started ART 1 y ago and are still on ART, proportion with VL <500 copies/mL | 84 (78–89; 84–84) | 83 (77–89; 82–83) | 81 (75–88; 81–81) |
| Of all people on ART, percent with viral load <1000 copies/mL | 91 (89–94; 91–91) | 91 (89–94; 91–92) | 91 (89–94; 90–91) |
| Of all people living with HIV, percent with viral load <1000 copies/mL | 67 (61–74; 67–68) | 69 (62–75; 69–69) | 71 (66–77; 71–71) |
| Of adult population, proportion with HIV and viral load >1000 copies/mL | 10 (8–13; 10–10) | 10 (7–12; 10–10) | 8 (6–10; 8–8) |
Abbreviations: AGYW, adolescent girls and young women; ART, antiretroviral therapy; CI, confidence interval; FSW, female sex workers; HIV, human immunodeficiency virus; NNRTI, nonnucleoside reverse transcriptase inhibitor; PrEP, preexposure prophylaxis.
aOutcome mean is over 3-month periods 2017–2036, except where stated.
bThe 90% uncertainty range represent variability across scenarios (n = 500) that are consistent with observed data used in calibration (likely largely due to different sexual behavior patterns in different scenarios; they do not include uncertainty over uptake and persistence of PrEP use). The 95% CI represents uncertainty in the mean due to stochastic uncertainty (ie, this tends to zero with increasing number of model runs).
cReasons for HIV infection in people on PrEP are (in order of importance): infection on PrEP with drug-resistant HIV; infection on PrEP with drug-sensitive HIV due to fact that efficacy is 95% and not 100%; starting PrEP in primary infection; and starting PrEP while HIV positive due to <100% sensitivity of HIV test.
PrEP policies lead to an increase in the proportion of ART initiators having resistance to at least 1 drug in their first-line regimen (7% for the no PrEP policy and 22% for the policy of PrEP-for-all), which translates into 84% and 81%, respectively, of ART initiators who remain on ART at 1 year having viral suppression.
There is predicted to be an average 25% decline in mean annual HIV incidence in women aged 15–24 years over 20 years (23% over 5 years and 26% over 50 years; Figure 1) with PrEP-for-AGYW/FSW and a 36% (31% and 35%) decline in HIV incidence in women aged 15–24 years with the policy of PrEP-for-all, and a 33% (27% and 36%) lower overall incidence in people aged 15–64 years with PrEP-for-all. In FSWs the predicted decline in incidence over 20 years is 33% (28% over 5 years and 35% over 50 years) with PrEP-for-AGYW/FSW and 43% (39% and 43%) with PrEP-for-all. The HIV prevalence for people aged 15–49 years in 20 (5 and 50) years’ time is predicted to be 23% (26% and 22%) with no PrEP, 21% (26% and 19%) with PrEP-for-AGYW/FSW, and 17% (25% and 14%) with PrEP-for-all. With the rate of scale-up as indicated, the annual cost of PrEP over the first 3 years is $7.4m ($20.7m) in year 1 (2017–2018), $9.5m ($25.3m) in year 2 (2018–2019), $10.4m ($27.2m) in year 3 (2019–2020), $11.7m ($30.4m) in year 5 (2021–22), and $13.2m ($33.8m) in year 10 (2026–2027) for PrEP-for-AGYW/FSW (PrEP-for-all).

Percent reduction in HIV incidence compared with no PrEP introduction (mean over 20 years), with 95% confidence interval (black thick lines) and 90% uncertainty range (grey thinner lines): (A) in women aged 15–24 years; and (B) in people aged 15–64 years. The 90% uncertainty range represent variability across scenarios (n = 500) that are consistent with observed data used in calibration (likely largely due to different sexual behavior patterns in different scenarios they do not include uncertainty over uptake and persistence of use). The 95% confidence interval represents uncertainty in the mean due to stochastic uncertainty (ie, this tends to zero with increasing number of model runs). Abbreviations: AGYW, adolescent girls and young women; FSW, female sex workers; HIV, human immunodeficiency virus; PrEP, preexposure prophylaxis.
Figure 2 shows that PrEP-for-all, while averting DALYs, is not expected to increase overall costs over the long term (50 years, at a 3% discount rate), suggesting that it is cost-effective. However, given the cost increases in the early years of introduction, especially with the PrEP-for-all approach, any cost savings would only be realized over an extended time horizon. We show the cumulative net DALYs averted over time expressed as a mean per year of the time horizon in Figure 2C. There is a cumulative net health benefit by 2034 (17 years from PrEP introduction) with PrEP-for-all and by 2039 (22 years after PrEP introduction) with PrEP-for-AGYW/FSW.
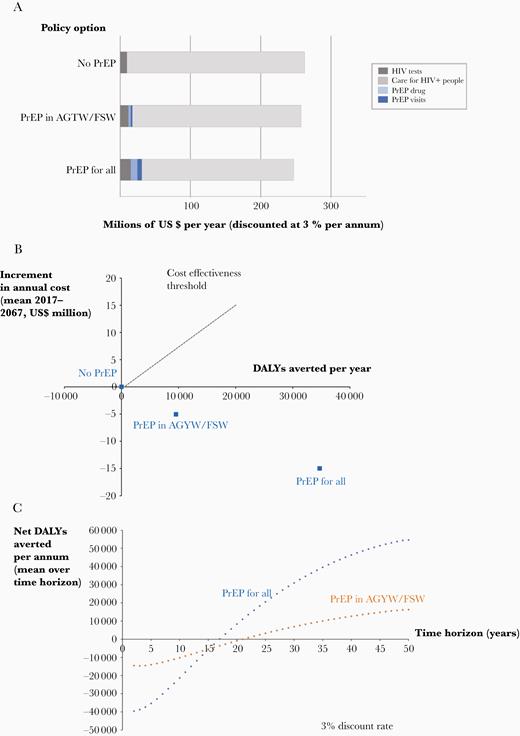
Cost, DALY, and net DALY outcomes over 50-year time horizon, 3% per annum discount rate. A, Breakdown of costs according to policy. B, DALYs averted and increment in cost for alternative PrEP targeting policies; PrEP-for-all is cost saving compared with no PrEP and compared with PrEP-for-FSW/AGYW. C, Cumulative net DALYs averted per annum according to length of time horizon, 3% discount rate. See Supplementary Material for similar figure with 7% discount rate. Abbreviations: AGYW, adolescent girls and young women; DALY, disability-adjusted life-year; FSW, female sex workers; HIV, human immunodeficiency virus; PrEP, preexposure prophylaxis.
Table 3 and Supplementary Table 1 summarize the impact and cost-effectiveness of PrEP for our primary analysis, and then shows the effect of variations in many of the model assumptions. As well as showing effects on DALYs, costs, and net DALYs, we show effects on HIV incidence and, reflecting the impact of PrEP on acquisition and transmission of resistance, on virologic response to first-line ART. In the primary analysis (row 1), the PrEP-for-all policy is the cost-effective policy choice (most net DALYs averted) in 100% of scenarios. PrEP-for-all tended to remain cost-effective in most 1-way sensitivity analyses, although quantitatively the net health benefit (net DALYs averted) was, as expected, lower with lower PrEP efficacy, adherence, and uptake, and less concentration of use around periods of condomless sex.
Reduction in Incidence, Difference in Response to First-Line ART, DALYs Averted, and Net DALYS Averted with Policies of PrEP for AGYW/FSW and PrEP for All
| Variation From Primary Analysis Assumptions | Reduction in Incidence, %a | Difference in Response to 1st-Line ART, %b | DALYs Averted, No.d | Difference in Cost Compared With no PrEP, US$ Million | Net DALYs averted, No. (%)d,e | |||||
|---|---|---|---|---|---|---|---|---|---|---|
| PrEP for FSW/AGYWc | PrEP for all | PrEP for FSW/ AGYW | PrEP for all | PrEP for FSW/ AGYW | PrEP for all | PrEP for FSW/ AGYW | PrEP for all | PrEP for FSW/ AGYW | PrEP for all | |
| No variation, primary analysis | 25 (25–26) | 33 (32–33) | −1 (−1 to −1) | −3 (−2 to −3) | 9.6 (9.0–10.0) | 34.7 (33.7–35.7) | −$5.1 (−5.4 to −4.8) | −$15.0 (−15.6 to −14.4) | 16.3 (0) (15.3–16.7) | 54.7 (100) (54.0–56.4) |
| 100% adherence when on PrEP | 41 (39–42) | 48 (45–50) | −0 (0–0) | −2 (−2 to −2) | 20.6 (18.1–23.1) | 58.0 (51.6–64.4) | −$15.1 (−17.0 to −13.2) | −$35.0 (−38.9 to −31.1) | 40.7 (0) (36.1–45.3) | 105.6 (100) (94.9–116.3) |
| PrEP efficacy 80%, primary analysis 95% | 20 (18–22) | 27 (24–29) | −1 (−1 to 0) | −2 (−2 to −2) | 6.3 (4.5–8.1) | 26.3 (21.4–31.2) | −$1.2 (−2.8 to .4) | −$5.2 (−8.5 to −1.9) | 7.8 (5) (4.6–11.0) | 33.2 (95) (25.2–41.2) |
| Probability of restarting PrEP during a period with condomless sex partner(s)f having previously interrupted for a period with no new condomless sex partners 50%, primary analysis 95%h | 24 (22–26) | 32 (29–36) | −0 (−1 to 0) | −2 (−2 to −2) | 8.9 (6.7–11.1) | 32.2 (27.0–37.7) | −$4.0 (−5.9 to −2.1) | −$13.7 (−17.9 to −9.5) | 14.3 (3) (10.1–18.5) | 50.1 (97) (40.6–59.6) |
| Risk of stopping/interrupting PrEP per 3 mo, despite continuing to have new condomless sex partner(s) 10%, primary analysis 3%h | 20 (17–22) | 27 (25–29) | −2 (−1 to −2) | −1 (0 to −1) | 6.5 (5.2–7.8) | 26.1 (22.8–29.3) | −$3.2 (−4.4 to 2.0) | −$11.2 (−13.4 to −9.0) | 10.8 (0) (8.3–13.3) | 41.0 (100) (35.9–46.1) |
| 50% of people will not consider starting PrEP despite having condomless sex partner(s),f primary analysis 15%h | 23 (21–24) | 19 (18–22) | 0 (−1 to 0) | −1 (−1 to −1) | 6.9 (5.1–8.8) | 23.1 (20.2–26.0) | −$4.8 (−5.9 to −3.7) | −$11.4 (−13.4 to −9.2) | 13.3 (0) (10.6–16.0) | 38.3 (100) (33.6–43.0) |
| Lower PrEP uptake and retention, as reflected by simultaneous variationsh | 17 (16–18) | 14 (13–15) | 0 (−1 to 0) | −1 (−1 to −1) | 5.0 (3.6–6.4) | 16.6 (15.0–18.2) | −$2.5 (−3.3 to −1.7) | −$8.2 (−9.0 to −7.4) | 8.3 (0) (6.3–10.3) | 27.5 (100) (25.5–29.5) |
| Efavirenz as 1st-line ART in all, primary analysis dolutegravir as 1st-line in all | 21 (20–22) | 24 (22–25) | −5 (−5 to −5) | −14 (−14 to −14) | −0.8i (−2.7 to 1.1) | 10.0 (6.4–13.6) | $1.6 (.4–2.8) | $0.9 (−1.3 to 3.1) | −3.0k (6) (−7.2 to .2) | 8.9 (60) (3.1–14.7) |
| PrEP has 0.5-fold lower efficacy against virus with K65R regardless of presence of M184V | 25 (24–27) | 33 (31–35) | −1 (−1 to 0) | −3 (−3 to −2) | 9.2 (7.9–10.5) | 31.6 (28.1–35.1) | −$4.6 (−5.9 to −3.3) | −$13.6 (−15.5 to −11.7) | 15.3 (1) (13.4–17.2) | 49.6 (99) (44.5–55.0) |
| PrEP has zero efficacy against virus containing both M184V and K65R mutations | 24 (23–26) | 29 (26–30) | −1 (−1 to −1) | −4 (−4 to −3) | 7.4 (5.9–8.9) | 25.4 (22.0–28.8) | −$3.3 (−4.8 to −1.8) | −$4.7 (−8.3 to −1.1) | 11.8 (6) (8.8–14.8) | 31.7 (94) (25.0–38.4) |
| PrEP clinic visits and 6-mo HIV testing, primary analysis 3 mo | 25 (24–27) | 34 (32–35) | −1 (−1 to 0) | −3 (−3 to −2) | 8.9 (7.9–9.9) | 32.9 (30.0–35.5) | −$5.8 (−6.7 to −4.9) | −$17.8 (−19.7 to −15.9) | 16.2 (0) (14.4–18.0) | 56.6 (100) (51.0–61.2) |
| HIV testing uses antigen/antibody tests, primary analysis antibody onlyg | 25 (23–26) | 33 (31–35) | −1 (−1 to 0) | −2 (−2 to −2) | 9.4 (8.1–10.7) | 35.9 (33.3–38.5) | −$5.3 (−6.2 to −4.4) | −$16.3 (−18.1 to −14.5) | 16.5 (0) (14.3–18.7) | 57.6 (100) (53.2–62.0) |
| People on PrEP have 2-fold increased numbers of condomless sex partners due to taking PrEP, primary analysis no increase | 16 (15–17) | 15 (14–16) | −1 (−1 to −1) | −4 (−4 to −4) | −3.2j (−4.2 to −2.2) | 4.9 (2.9–6.9) | $6.3 (5.5–7.1) | $12.2 (10.8–13.6) | −11.7k (5) (−13.4 to −10.0) | −11.3k (27) (−14.7 to −6.9) |
| One 3-mo period of PrEP while no condomless sex is experienced, not even with a primary partner, for each 3-mo period of PrEP while having condomless sex partners,f primary analysis PrEP not used in 3-mo periods with no new condomless sex partnersi | As primary analysis | As primary analysis | As primary analysis | As primary analysis | As primary analysis | As primary analysis | $0.7 (−0.2 to 1.6) | $0.8 (.4–1.2) | 8.6 (4) (7.9–9.3) | 33.7 (95) (31.9–35.5) |
| 7% discount rate, primary analysis 3%i | As primary analysis | As primary analysis | As primary analysis | As primary analysis | 2.7 (2.5–2.9) | 10.6 (10.2–11.0) | −$0.3 (−0.5 to −0.1) | −$1.8 (1.5–2.1) | 3.1 (2) (2.8–3.4) | 13.0 (98) (12.5–13.5) |
| Plausible future reduced PrEP costs: 4 HIV tests/y $3 each, 1 PrEP clinic visit/y, PrEP drug $35–$57/y, primary analysis $136/yi | As primary analysis | As primary analysis | As primary analysis | As primary analysis | As primary analysis | As primary analysis | −$8.5 (−8.8 to −8.2) | −$24.5 (−25.1 to −23.9) | 20.9 (0) (19.2–22.6) | 67.4 (100) (66.7–68/1) |
Data are mean over 50 years (20 years for HIV incidencea and difference in response to first-line ARTb) and 95% confidence interval.
Abbreviations: AGYW, adolescent girls and young women; ART, antiretroviral therapy; DALY, disability-adjusted life-year; FSW, female sex workers; HIV, human immunodeficiency virus; PrEP, preexposure prophylaxis.
aReduction in incidence is shown over a shorter time period than 50 years as a mechanism of effect on DALYs is via reduction in new infections.
bOf people who started ART 1 year ago and are still on ART, proportion with VL <500 copies/mL, the differences is due to difference in drug-resistance outcomes and this output is shown over a shorter time period than 50 years as drug resistance is a mechanism of effect on DALYs.
cReduction in incidence relates in AGYW only in relation to PrEP for AGW and to all aged 15–64 y for PrEP for all.
dDALYS and net DALYs averted in whole population in 1000s; net DALYs based on cost-effectiveness threshold of $750.
eOr a period percent of scenarios in which PrEP policy is the cost-effective policy choice. In the remainder of scenarios no PrEP introduction is the most cost-effective policy.
fPeriod with a primary on-going condomless sex partner who is diagnosed with HIV but off ART.
gTest cost assumed the same as antibody-only test.
hLower PrEP uptake and retention, as reflected by simultaneous variations in indicated items given in rows: 50% of people will not consider starting PrEP despite having condomless sex partner(s); risk of stopping/interrupting PrEP per 3 mo; and probability of restarting PrEP during a period with condomless sex partner(s).
iUses base runs.
jDALYs not averted.
kNet DALYs not averted.
Percentage of scenarios in which policy is cost-effective choice considering only no PrEP and PrEP for FSW
PrEP was not cost-effective if it leads to substantial increases in condomless sex amongst people on PrEP. The continued use of efavirenz rather than dolutegravir in ART initiators would be predicted to lead to a substantial reduction in overall PrEP effectiveness, due to increased drug resistance. In this context of continuation of use of efavirenz in first-line ART regimens, the response to first-line ART would be predicted to be significantly reduced over the next 20 years with PrEP introduction. Six-monthly HIV testing for people on PrEP is predicted to be of similar effectiveness and cost-effectiveness compared with 3-monthly testing.
DISCUSSION
This modelling study suggests that PrEP use concentrated amongst people and periods of condomless sex has the potential to be highly impactful on HIV incidence and cost-effective in KZN. The PrEP-for-all policy is predicted to have a substantially greater overall impact on incidence and be more cost-effective than a policy of restricting PrEP availability to AGYW/FSW. There is also predicted to be a greater impact on incidence in women aged 15–24 years with PrEP-for-all than when PrEP use is restricted to such women and FSW, due to the effects of a reduction in HIV prevalence in men. A policy of PrEP-for-all may have advantages over policies that restrict by demographics as it removes any issues with eligibility and helps to avoid PrEP programs potentially spotlighting and stigmatizing groups of people.
Cost-effectiveness of PrEP programs remains subject to some uncertainty. If PrEP use leads to significant increases in condomless sex episodes that are not covered by PrEP it is unlikely to be cost-effective. Cost-effectiveness of PrEP is also related to whether its use is concentrated in periods of condomless sex, but even with less concentrated use of PrEP, so that there is one 3-month period of use when there is no risk for each 3-month period in which there is risk through condomless sex, PrEP remained cost-effective. However, if we assume that PrEP use is entirely unrelated to condomless sex (which perhaps seems unlikely but remains possible), it is not cost-effective. A major challenge for programs is to achieve and maintain high levels of PrEP use during periods of condomless sex. The impact and cost-effectiveness of PrEP is substantially dependent on the avoidance of use of efavirenz in first-line regimens compared with use of dolutegravir. This is to avoid increases in nonnucleoside reverse transcriptase inhibitor (NNRTI) resistance, secondary to emergence of resistance to lamivudine/emtricitabine and TDF, which would be predicted to lead to effects of ART being undermined. In other work outside the context of PrEP we have considered the risks and benefits of this choice [47]. We found that PrEP with 6-monthly HIV testing has similar effectiveness and cost-effectiveness to 3-monthly testing but we see no compelling case to recommend less frequent testing than 3-monthly. PrEP impact and cost-effectiveness is influenced by the extent to which PrEP has efficacy in preventing infection when the partner’s virus has drug resistance to PrEP drugs. Continued monitoring of drug resistance is important.
In our primary analysis the time point at which a net health benefit is achieved is 2034 with the PrEP-for-all policy and 2039 for the policy of PrEP-for-AGYW/FSW. Policymakers will need to trade short-term imposition of costs with longer-term health benefits and cost reductions as a result of HIV infections averted. Short-term costs and longer-term benefits are expected to be greater with PrEP-for-all than PrEP-for-AGYW/FSW only. The use of discount rates facilitates the comparison of costs and health effects occurring at different points through time, but the appropriate discount rates are uncertain.
Programs will need to innovate if they are to overcome the challenges of implementing PrEP as it has been modelled. Self-report of risk is unreliable. One approach would be to advise people to take daily PrEP for the next 3 months if they may have new sexual partners and are unsure about their ability to use condoms consistently with those new partners. We note our assumption that periods of PrEP use around condomless sex last at least 3 months, which may be conservative and PrEP use may be further concentrated in practice into shorter periods than we have assumed. We assume daily dosing during 3-month periods on PrEP, although dosing around sex acts may be feasible [48, 49]. A key challenge in the use of PrEP in Africa is the low reported levels of persistent use (eg, [50]). The reasons underlying this, and solutions to addressing those causes, will need to be identified if effects of the magnitude we have modelled are to be realized.
Limitations of our analysis, as for any cost-effectiveness analysis, include that it involves projection of the HIV epidemic and HIV program over several years—we assume rates of voluntary medical male circumcision, HIV testing, and ART initiation given HIV diagnosis remain constant, which is associated with uncertainty that we explored in sensitivity analyses. We define an FSW as a woman who had over 5 short-term condomless sex partners in a 3-month period over the past year and this is a relatively simple characterization. We combined AGYW/FSW into 1 group although provision of PrEP to FSW is likely to be more cost-effective than provision to AGYW. We do not model sex between men, although we would note that an added benefit of the policy of PrEP-for-all is that MSM would be able to access PrEP without having to state their sexuality should they wish. We use a relatively long time-step of 3 months, which we consider should be adequate to accurately capture most effects but we cannot exclude the possibility that a shorter time-step would reveal nuances that we missed. Lastly, we focused on KZN province and further analyses of other provinces would be needed to assess how generalizable our findings are across South Africa.
CONCLUSIONS
PrEP use concentrated during time periods of condomless sex has the potential to substantively impact HIV incidence and to be cost-effective. Further research and monitoring are required to understand the effects of PrEP programs, including on HIV drug resistance.
Supplementary Data
Supplementary materials are available at The Journal of Infectious Diseases online. Consisting of data provided by the authors to benefit the reader, the posted materials are not copyedited and are the sole responsibility of the authors, so questions or comments should be addressed to the corresponding author.
Notes
Author contributions. All authors contributed to the concept of the analysis, specific modelling aspects, interpretation of results, and critical comments on manuscript drafts; A. P. drafted of the manuscript; and A. P. and F. N. implemented the modelling.
Disclaimer. The contents are the responsibility of the authors and do not necessarily reflect the views of United States Agency for International Development (USAID), US President’s Emergency Plan for AIDS Relief (PEPFAR), or the United States Government.
Financial support. This work was supported by USAID and PEPFAR (grant numbers AID-OAA-A-15-00031 to University of Pittsburgh; AID 674-A-12-00029 and 72067419CA00004 to the Health Economics and Epidemiology Research Office); and the Academy of Medical Sciences (to F. T.).
Potential conflicts of interest. J. W. M. is a consultant for Gilead Sciences and Xi’an Yufan Biotechnologies, has received research grants to the University of Pittsburgh from Gilead Sciences and Janssen Pharmaceuticals, and owns share options in Co-Crystal Pharma, Inc., which are unrelated to the current study. All other authors report no potential conflicts.
All authors have submitted the ICMJE Form for Disclosure of Potential Conflicts of Interest. Conflicts that the editors consider relevant to the content of the manuscript have been disclosed.
References
Moyo S, Hunt G, Khangelani Z, et al. .

