


Abstract
HIV-1 proviruses persist in people on antiretroviral therapy (ART) but most are defective and do not constitute a replication-competent reservoir. The decay of infected cells carrying intact compared with defective HIV-1 proviruses has not been well defined in people on ART.
We separately quantified intact and defective proviruses, residual plasma viremia, and markers of inflammation and activation in people on long-term ART.
Among 40 participants tested longitudinally from a median of 7.1 years to 12 years after ART initiation, intact provirus levels declined significantly over time (median half-life, 7.1 years; 95% confidence interval [CI], 3.9–18), whereas defective provirus levels did not decrease. The median half-life of total HIV-1 DNA was 41.6 years (95% CI, 13.6–75). The proportion of all proviruses that were intact diminished over time on ART, from about 10% at the first on-ART time point to about 5% at the last. Intact provirus levels on ART correlated with total HIV-1 DNA and residual plasma viremia, but there was no evidence for associations between intact provirus levels and inflammation or immune activation.
Cells containing intact, replication-competent proviruses are selectively lost during suppressive ART. Defining the mechanisms involved should inform strategies to accelerate HIV-1 reservoir depletion.
(.)
Human immunodeficiency virus-1 (HIV-1) infection cannot be cured in most people because of a latent reservoir that persists despite clinically effective antiretroviral therapy (ART) [1–5]. Progress towards achieving HIV-1 cure, or ART-free remission, depends on the ability to accurately measure the HIV-1 reservoir and impact of interventions on it. Most assays of HIV-1 persistence have important limitations that have hindered the ability to detect effects of interventions on the HIV-1 reservoir. Specifically, measures of HIV-1 DNA targeting gag or pol genes overestimate the size of the reservoir because >90% of proviruses that persist in people on ART are defective [6–12]. Conversely, virus outgrowth assays may underestimate the HIV-1 reservoir because not all replication-competent proviruses can be induced ex vivo with a single cycle of activation [6, 13–15]. Furthermore, virus outgrowth assays are cumbersome for use in interventional trials because they require large amounts of blood or leukapheresis products, and are quite laborious, time-consuming, and expensive.
Recently, an assay that measures intact proviral DNA has been developed [16]. This droplet digital PCR assay, called the intact proviral DNA assay (IPDA), distinguishes between and separately quantifies intact HIV-1 proviruses, which are potentially replication competent, and defective HIV-1 proviruses, which are not. Levels of intact proviral DNA measured with the IPDA correlate with levels of replication-competent HIV-1 assessed by the virus outgrowth assay but are, on average, 50 to 100-fold higher [16]. Hence, the assay is likely detecting and quantifying replication-competent proviruses that are more difficult to induce ex vivo with a single round of CD4+ T-cell activation in a standard virus outgrowth assay [6, 13–15]. Little is known, however, about whether the intact proviral DNA reservoir declines over time on ART, how intact proviral DNA values relate to other measures of HIV-1 persistence (such as HIV-1 DNA, cell-associated HIV-1 RNA, and residual plasma viremia), and whether intact proviral DNA levels are correlated with persistent inflammation and T-cell activation in people on virologically suppressive ART. We addressed these questions by studying longitudinal specimens from a cohort of people on ART with long-term suppression of viremia.
METHODS
Study Approval
All participants were in the United States and provided informed consent in compliance with US Department of Health and Human Services and institutional review board guidelines of the authors’ institutions.
Study Population
We evaluated a longitudinal cohort of participants with chronic HIV-1 infection who initiated ART in AIDS Clinical Trials Group (ACTG) trials for treatment-naive people and had subsequent follow-up while continuing to receive ART (ACTG A5321) [17]. Participants had plasma HIV-1 RNA levels <50 copies/mL by commercial assays starting at week 48 of ART and at all subsequent time points, and no reported ART interruptions. Blood samples from participants were tested at a median of 7.1 years after ART initiation (time point 1); median of 3.7 years after time point 1 (time point 2); and median of 1.8 years after time point 2 (time point 3).
Virologic and Immunologic Assays
HIV-1 persistence was assessed by measuring: (1) plasma HIV-1 RNA by single-copy assay (SCA) targeting the 3′ end of integrase (copies/mL plasma); (2) total HIV-1 3′ integrase DNA by quantitative polymerase chain reaction (qPCR) targeting the same region as the SCA (copies/million CD4+ T cells); (3) cell-associated unspliced HIV-1 RNA from the same 3′ integrase region (copies/million CD4+ T cells); and (4) intact proviral DNA, defective proviral DNA (5′ defective and hypermutated/3′ defective), and total HIV-1 DNA (sum of intact plus 5′ defective and hypermutated/3′ defective DNA) (copies/million CD4+ T cells). Plasma HIV-1 RNA, total HIV-1 integrase DNA, and cell-associated HIV-1 RNA were measured by qPCR as reported [18, 19]. For cell-associated HIV-1 DNA and RNA, nucleic acid was obtained from peripheral blood mononuclear cells (PBMCs) using a guanidium-based extraction method, quantified by UV spectroscopy. Half of the PBMC extract was used for HIV-1 integrase DNA quantification by qPCR and the other half was DNAsed, reextracted, and reverse transcribed for cell-associated HIV-1 RNA detection by reverse transcription PCR (RT-PCR). The IPDA was performed as reported [16]. We initially tested 50 participants; data from participants who had 1 or more samples with amplicon signal failure (n = 6) were excluded from all analyses.
Soluble markers of inflammation (interleukin-6 [IL-6], C-X-C motif chemokine ligand 10 [CXCL10], sCD14, sCD163, neopterin, tumor necrosis factor-α [TNF-α], and high sensitivity C reactive protein [hsCRP]) were quantified using enzyme-linked immunosorbent assays and multiplex fluorescent platform per manufacturer’s instructions (R&D). We measured levels of T-cell activation (CD38/HLA-DR) and T-cell cycling (Ki67) using antibodies to CD3 APC-H7, CD4 A488, CD8 V450, HLA-DR PE, CD38 APC, Ki-67 PerCP-Cy5.5, and Live/Dead AQUA (all BD except Live/Dead, Invitrogen). Frequencies of T cells expressing exhaustion markers were determined by staining with antibodies to CD3 APC-H7, CD4 PC5, CD8 V450, PD-1 A488, PD-L1 PE-CF594, CTLA-4, PerCP-eF710, TIM3 PC7, TIGIT APC, LAG-3 PE, CD45RA AF700, and LIVE/DEAD Aqua. Samples were fixed in 1% paraformaldehyde and analyzed using BD LSR Fortessa within 24 hours.
Statistical Analysis
To reduce the influence of not-detected (zero copy) measurements of proviral DNA, rank-based summaries and analyses were used. Spearman correlations assessed associations between measures of HIV-1 persistence, including intact proviral DNA; results below assay limit were analyzed as the lowest rank. Wilcoxon rank-sum test was used to compare groups. Longitudinal changes were estimated by the median change per year, derived from participant-specific changes of log-transformed measures. Participants whose proviral DNA levels went from detected to nondetected were analyzed as the change with the lowest rank. Participants with nondetected levels at both time points were excluded from analyses of change. In addition, participants who initiated medication that might influence HIV-1 persistence were excluded. Changes were translated into half-life estimates assuming exponential decay. The sign test compared change per year in intact versus defective proviruses.
RESULTS
Study Population
Forty-four participants with chronic HIV-1 and long-term virologic suppression on ART had the following measurements performed on blood samples taken at a median of 7.1 years after initiation of ART (time point 1): intact and defective proviral DNA (using an IPDA), total HIV-1 integrase DNA by standard qPCR, cell-associated HIV-1 RNA, residual plasma viremia by SCA, markers of inflammation, and T-cell activation.
The median age of participants at time point 1 was 46 years. Twenty-seven percent were female. The median pre-ART CD4+ T-cell count was 319/mm3; the median CD4+ T-cell count at on-ART time point 1 was 748/mm3. Additional characteristics of the study population, including antiretroviral regimen, are summarized in Table 1.
Participant Characteristics
| Characteristic (N = 44) | Value |
|---|---|
| Age at 1st time point, y, median (Q1, Q3) | 46 (38, 52) |
| Sex, n (%) | |
| Male | 32 (73) |
| Female | 12 (27) |
| Race/ethnicity, n (%) | |
| White non-Hispanic | 22 (50) |
| Black non-Hispanic | 9 (20) |
| Hispanic (regardless of race) | 13 (30) |
| Years on ART at 1st time point, median (Q1, Q3) min, max | 7.1 (4.4, 8.0) 4.2, 14.8 |
| Pre-ART plasma HIV-1 RNA, log10cps/mL, median (Q1, Q3) | 4.5 (4.2, 4.9) |
| Pre-ART CD4+ T-cell count, cells/mm3, median (Q1, Q3) | 319 (224, 410) |
| Pre-ART CD4:CD8 ratio, median (Q1, Q3) | 0.4 (0.2, 0.5) |
| CD4+ T-cell count, cells/mm3 at 1st time point, median (Q1, Q3) | 748 (572, 878) |
| CD4:CD8 ratio at 1st time point, median (Q1, Q3) | 1.1 (0.8, 1.2) |
| ARV group at time of treatment initiation, n (%) | |
| NNRTI + NRTI | 20 (45) |
| PI + NRTI | 15 (34) |
| INSTI + NRTI | 8 (18) |
| Other | 1 (2) |
| ARV group at time of 1st time point, n (%) | |
| NNRTI + NRTI | 18 (41) |
| PI + NRTI | 16 (36) |
| INSTI + NRTI | 10 (23) |
Abbreviations: ART, antiretroviral therapy; ARV, antiretroviral; INSTI, integrase strand transfer inhibitor; NNRTI, nonnucleoside reverse transcriptase inhibitor; NRTI, nucleoside reverse transcriptase inhibitor; PI, protease inhibitor; Q, quartile.
Of the forty-four participants, 40 were included in a longitudinal analysis of intact and defective proviral DNA and other measures of HIV-1 persistence between time point 1 and time point 2, which occurred at a median of 3.7 years after time point 1 (Figure 1). Four participants were excluded from this longitudinal analysis: 1 participant because no intact proviruses were detected by IPDA at time point 1 or time point 2, 1 participant because of a technical issue at time point 2, and 2 participants because they started on an exclusionary medication between time point 1 and time point 2.
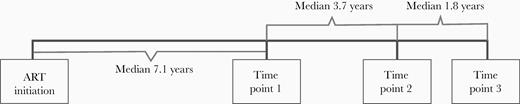
Study time points. Abbreviation: ART, antiretroviral therapy.
Thirty-three of the 40 participants had intact and defective proviral DNA measurements performed at time point 3, which occurred a median of 5.5 years after time point 1 and a median of 1.8 years after time point 2 (Figure 1). For 6 participants who did not have samples from time point 3 and for 1 participant who started on an exclusionary medication, the time point 2 results were used to calculate proviral DNA decline.
Intact and Defective Proviral DNA Levels and Other Measures of HIV-1 Persistence
At time point 1 (median of 7.1 years after ART initiation), we quantified intact, hypermutated/3′ defective, 5′ defective, and total HIV-1 proviruses (sum of intact and defective proviruses) by IPDA as well as total HIV-1 integrase DNA by qPCR. The median level of intact proviruses (64.6 copies/million CD4+ T cells) was substantially lower than median levels of hypermutated/3′ defective and 5′ defective proviruses (269 and 208 copies/million CD4+ T cells, respectively) (Supplementary Table 1). Intact proviruses were a median of 9.8% (quartile 1 [Q1], Q3: 6.1%, 20.0%) of the total HIV-1 proviruses. In relation to total HIV-1 integrase DNA by qPCR, the median fraction of intact proviruses was 8.0% (Q1, Q3: 3.9%, 15.9%).
Lower pre-ART CD4+ T-cell counts and pre-ART CD4:CD8 ratios were associated with higher total number of HIV-1 proviruses (r = −0.44, P = .003; r = −0.44, P = .003) but not with absolute levels of intact proviruses (r = −0.10, P = .54; r = −0.13, P = .38). Participants with lower pre-ART CD4+ T-cell counts and pre-ART CD4:CD8 ratios had a lower fraction of intact proviruses on ART (r = 0.35, P = .02; r = 0.30, P = .05) (Figure 2 and Supplementary Figure 1). Higher CD4+ T-cell proliferation on ART (measured by Ki67 expression) was also associated with a lower fraction of intact proviruses (r = −0.36, P = .015).
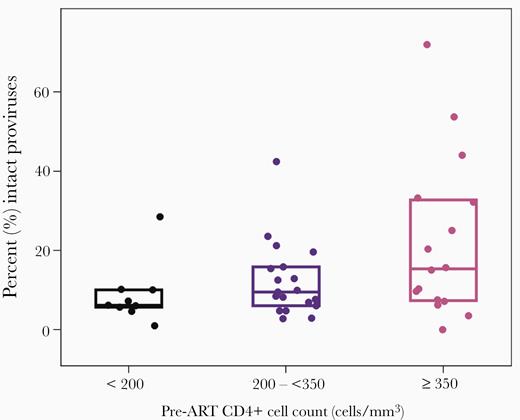
Intact proviruses at time point 1 by pre-ART CD4+ T-cell count. Boxes display quartile 1, median and quartile 3. Abbreviation: ART, antiretroviral therapy.
Higher intact proviral DNA levels on-ART were associated with higher total HIV-1 integrase DNA by qPCR before initiation of ART (r = 0.47, P = .002). Women had numerically lower intact proviral DNA levels than men but the difference was not significant (median 49 vs 72 intact proviruses/million CD4+ T cells, P = .36).
We also evaluated the association between intact proviral DNA levels and other measures of HIV-1 persistence at time point 1 (Supplementary Table 2). Higher intact proviral DNA was correlated with higher total HIV-1 integrase DNA by qPCR (r = 0.61, P < .001), higher cell-associated unspliced HIV-1 RNA (r = 0.57, P < .001) and higher plasma HIV-1 RNA by SCA (r = 0.53, P < .001) (Supplementary Figure 2). These associations remained significant after adjustment for pre-ART HIV-1 RNA levels.
No Evidence for Association Between Intact Proviral DNA Levels and Inflammation or Activation
HIV-1 persistence has been proposed to be a cause or, conversely, a consequence of persistent inflammation in people on ART. In previous studies in this cohort, we did not find evidence for an association between HIV-1 DNA, cell-associated RNA, or plasma HIV-1 RNA by SCA and soluble biomarkers of inflammation [17]. At time point 1, we found no evidence for associations between on-ART intact proviral DNA levels and inflammation (interleukin-6, IP-10, sCD14, sCD163, neopterin, TNF-α, and hsCRP) (Supplementary Table 3). Similarly, we found no evidence for associations between on-ART intact proviral DNA levels and CD4+ or CD8+ T-cell activation, proliferation, or exhaustion (Supplementary Table 3).
Total HIV-1 integrase DNA, Cell-Associated RNA, and Residual Viremia Are Stable During Long-term ART
We measured levels of HIV-1 integrase DNA by standard qPCR, cell-associated HIV-1 RNA, and residual plasma viremia in 40 participants at time points 1 and 2 in the longitudinal analysis (Figure 1; see section “Study Population,” above). HIV-1 integrase DNA levels remained stable: 821 copies/million CD4+ T cells at time point 1 and 836 copies/million CD4+ T cells at time point 2 (Table 2). Similarly, cell-associated RNA did not decline significantly between time points 1 and 2 (51 and 45 copies/million CD4+ T cells, respectively). At both time points 1 and 2, 55% of participants had <0.3 copies/mL of plasma HIV-1 RNA by SCA.
HIV-1 Integrase DNA, Cell-Associated HIV-1 RNA, and Plasma HIV RNA by SCA at Time Point 1 (Median of 7.1 Years After ART Initiation) and Time Point 2 (Median of 3.7 Years After Time Point 1)
| Measure | Result Time Point | |
|---|---|---|
| 1 (N = 40) | 2 (N = 40) | |
| HIV-1 integrase DNA, cps/106 CD4+ T cells | ||
| Median | 821.0 | 835.7 |
| Q1, Q3 | 444.2, 2552.3 | 390.9, 1739.4 |
| Min, max | <2.6, 5663.2 | <2.6, 5929.2 |
| CA HIV-1 RNA, cps/106 CD4+ T cells | ||
| Median | 50.6 | 45.1 |
| Q1, Q3 | 21.0, 189.6 | 10.7, 124.7 |
| Min, max | <2.9, 909.8 | <2.9, 1058.0 |
| HIV-1 RNA by SCA, cps/mL | ||
| Min, max | <0.3, 3.1 | <0.3, 5.7 |
| <0.3, n (%) | 22 (55) | 22 (55) |
Abbreviations: ART, antiretroviral therapy; CA, cell-associated; cps, copies; Q, quartile; SCA, single copy assay.
Intact Proviruses Decrease on Long-term ART
Intact proviral DNA levels declined significantly between time points 1, 2, and the last time point: median of 65, 53, and 36 copies/million CD4+ T cells, respectively; P < .001 for time point 1 to both time point 2 and the last time point (Figure 3). There was no evidence that intact proviral DNA decay differed by age or sex. Between the first and the last time point (median of 7.1 and 12 years after ART initiation, respectively), 83% of participants had a decrease in intact proviral DNA levels. For intact proviral DNA, the median (Q1, Q3) half-life was 7.1 years (2.7, 33.9), with a 95% confidence interval of 3.9 to 18 years.
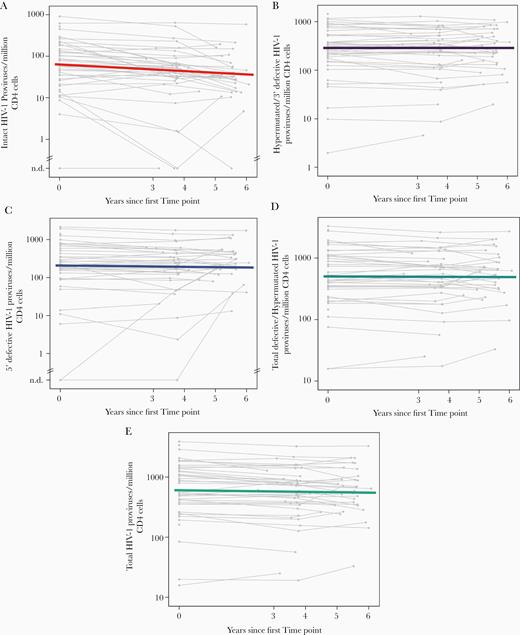
Intact proviral DNA declines in people with HIV-1 on long-term ART whereas defective proviruses do not. (A) intact proviral DNA; (B) hypermutated/3′ defective proviruses; (C) 5′ defective proviruses; (D) total defective/hypermutated proviruses (sum of hypermutated/3′ defective and 5′ defective proviruses); (E) total HIV-1 proviruses. Colored lines display median decay; grey lines represent longitudinal measurements for individual participants. Abbreviations: ART, antiretroviral therapy; n.d., not detected.
By contrast, defective proviral DNA did not decay over the same time period (Figure 3). At time points 1, 2, and the last time point, median hypermutated/3′ defective proviral DNA levels were 289, 307, and 320 copies/million CD4+ T cells, and median 5′ defective proviral DNA levels were 208, 219, and 214 copies/million CD4+ T cells. Between time points 1 and the last time point, 50% of participants had a decrease in hypermutated/3′ defective proviruses and 50% had an increase; 65% of participants had a decrease in 5′ defective proviruses and 35% had an increase. The median change per year for hypermutated/3′ defective proviruses was positive but essentially zero (0.000 log10 per year); that is, there was no evidence for any decay. The median (Q1, Q3) half-life of 5′ defective proviruses was 33.9 years (12.5, infinity), with a 95% confidence interval of 21.6 years to infinity. Total proviral HIV-1 DNA levels by IPDA (the sum of intact and defective proviruses) had a median (Q1, Q3) half-life of 41.6 years (11.7, 311), with a 95% confidence interval of 13.6 to 75 years.
When we evaluated the change in proviral DNA per year, intact proviral DNA declined significantly more (P < .001) than defective proviral DNA (the latter did not change) (Figure 4). Consistent with the differential decline in intact and defective proviral DNA, the fraction of intact proviruses decreased substantially over time: at time point 1, 9.8% of total proviruses were intact; by the last time point, only 5.8% of intact proviruses were intact (Figure 5) and the rest were defective.
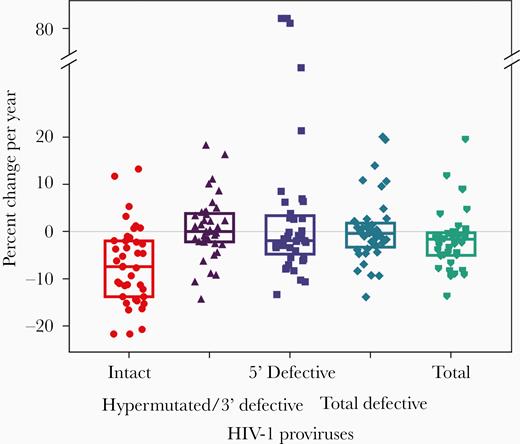
Percent change in HIV-1 proviral DNA per year. Boxes display quartile 1, median and quartile 3.
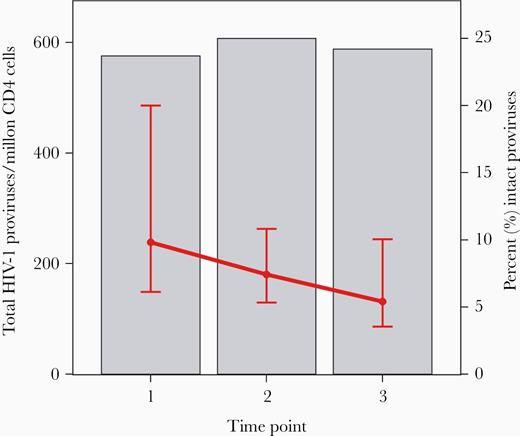
Total HIV-1 proviruses (grey bars) and the percentage of intact proviruses (red lines, displaying median, quartile 1, and quartile 3), by time point. Time point 1 is median 7.1 years on antiretroviral therapy (ART). Time point 2 is median 3.7 years later. Time point 3 is median 5.5 years after time point 1 and a median 12 years after starting ART. See online version for color figure.
Factors Associated With Change in Intact Proviral DNA Levels
Lower pre-ART CD4+ T-cell count was associated with lesser decline in intact proviral DNA levels (r = −0.32, P = .047). We did not detect evidence for associations between change in intact proviral DNA levels over time and pre-ART CD4:CD8 ratio, HIV-1 RNA, CD4+ or CD8+ T-cell activation, or soluble inflammatory biomarkers. We saw a similar negative association between change in intact proviral DNA levels and on-ART CD4+ T-cell counts (measured at time point 1, r = −0.32, P = .047). We did not see evidence for associations between change in intact proviral DNA levels and age, years on ART at time point 1, sex, on-ART CD4:CD8 ratio, CD4+ or CD8+ T-cell activation, or soluble inflammatory biomarkers.
DISCUSSION
In people on long-term ART with well-documented virologic suppression, we find that intact proviral DNA levels decline significantly over time (half-life, 7.1 years) whereas defective proviral levels do not. Consistent with the differential decline in intact and defective proviral DNA, we find that the fraction of total proviruses that are intact in people on ART decreases substantially over time.
In line with other studies [6–12], we find that most proviruses in people on ART are defective; indeed, at a median of 7.1 years after ART initiation, only about 10% of total HIV-1 proviruses were intact. Lower CD4+ T-cell counts (and CD4:CD8 ratios) before ART initiation were associated with higher total HIV-1 provirus levels and a higher fraction of defective proviruses (lower proportion of intact proviruses) while on ART. One potential explanation is that lower pre-ART CD4+ T-cell counts (and CD4:CD8 ratios) reflect longer duration of untreated HIV-1 infection, during which time defective proviruses might accumulate preferentially over intact proviruses, which may be more vulnerable to reactivation during ongoing infection; earlier treatment may result, therefore, in a higher proportion of total HIV-1 DNA being composed of intact proviruses. This finding is consistent with a report that people treated during acute HIV-1 infection have a higher proportion of intact proviruses than those who receive ART during chronic infection [7], and suggests that, after acute infection, a longer duration of untreated HIV-1 results in accumulation of defective proviruses [20].
The decline in intact proviral DNA levels over time observed in our study (to a median of 12.0 years after ART initiation) suggests there is selective loss of cells containing intact replication-competent proviruses. Similar findings were seen in a separate study performed in the SCOPE cohort and in a longitudinal study of 8 people on ART [21, 22]. Indeed, in our longitudinal study, we see an increase in the proportion of proviruses that are defective and a corresponding diminution of the fraction of intact proviruses with increasing time on ART (from about 10% at our first time point to about 5% at the last time point).
There are several possible explanations for the decline in intact proviruses in the face of stable levels of defective proviruses. Some infected cells contain intact proviruses that may be transcriptionally active and produce mRNA, protein, and virions. (The correlations we observed between intact proviral DNA and cell-associated RNA and residual plasma HIV-1 RNA support this possibility.) If these infected cells containing intact proviral DNA express HIV-1 RNA and protein, they may be targeted by the immune system for elimination or may be lost by viral cytopathic effects. By contrast, defective proviruses, which have lower levels of gene expression, may persist indefinitely. In this scenario, the reason that intact proviruses have such a slow decay may be because immune-mediated clearance of these cells is inefficient (perhaps related to immune dysfunction [23]) or because most intact proviruses remain transcriptionally silent. In the latter case, if latency reversal, which may not occur very often in vivo, could be enhanced by an intervention, that may accelerate clearance of intact proviruses. Another possible explanation for our findings is that defective proviruses are present in infected cells that proliferate over time and outcompete cells containing intact proviruses, which are eliminated by viral cytopathic effects when activated to proliferate. HIV-1 integration into genes that control cell proliferation [24–25] may lead to clonal expansion, as may antigen-induced proliferation. Additional studies are needed to assess whether clones containing defective proviruses preferentially persist over time as compared with clones containing intact proviruses.
The observation in our cohort that the half-life of intact proviral DNA decline (7.1 years) is longer than the half-life of replication-competent virus as assessed by the viral outgrowth assay (3.6–3.7 years) [3, 5] suggests that some intact proviruses are in a deeper state of latency than others, perhaps because of chromosomal location or epigenetic modifications. Indeed, recent evidence suggests that intact proviruses accumulate in nongenic chromosomal positions and in other locations that may result in deeper viral latency [27].
The lack of evidence for associations between on-ART intact proviral DNA and on-ART soluble markers of inflammation or T-cell activation is in line with previous findings from this cohort [17]. In a study of a larger number of participants from this cohort, we found that on-ART inflammation and activation did not correlate with on-ART levels of total HIV-1 DNA, cell-associated RNA, or residual viremia. Taken together, our results suggest that HIV-1 persistence is not driving or driven by inflammation or activation.
We find that on-ART intact proviral DNA levels correlate with other measures of HIV-1 persistence—total HIV-1 integrase DNA, cell-associated HIV-1 RNA, and plasma HIV-1 RNA by single-copy assay. The new finding of a correlation with plasma HIV-1 RNA suggests that intact proviruses that are transcriptionally activated are a source of persistent viremia. Because most HIV-1 DNA in people on ART is defective, interventional trials that focus on measuring total HIV-1 DNA may miss effects on intact proviruses because the effect may be obscured by the large proportion of defective proviruses. This thesis is supported by a recent trial in HIV controllers, in which a Toll-like receptor-7 (TLR-7) agonist reduced intact proviral DNA levels but not total HIV-1 DNA [28]. This finding, if borne out in other trials, points to the possibility that intact proviral DNA may be decreased by an intervention even when total HIV-1 DNA is not.
There are several limitations to our study. Our ability to evaluate sex-based differences in intact proviral DNA was underpowered because of the small number of women in our cohort. Second, our cohort may not have been large enough to identify factors associated with more rapid decay of intact proviral DNA levels. Third, the IPDA does not measure replication-competent HIV-1 and there may be sequence-intact HIV genomes that are not transcribed, translated, or producing infectious virus; additional studies of the IPDA’s role and potential limitations in reservoir-depletion studies are warranted. Fourth, there were some participants (n = 6, 12%) who could not be evaluated by the IPDA because of PCR amplification failure, which may be influenced by HIV-1 sequence polymorphisms; in such cases, tailored primers or probes may be needed to quantitate intact provirus. Finally, there may be differences in the decay rate of different classes or types of defective proviruses [29] that are not picked up by the IPDA; nevertheless, the main finding of our study is that intact proviruses selectively decay over time whereas defective proviruses in general do not decline.
Despite these limitations, the study also has multiple strengths. We were able to carefully evaluate factors associated with intact proviral DNA and, because of longitudinal assessments, we were able to demonstrate continued decline over time in intact proviral DNA, but not defective proviruses, in people on ART. Additional studies are needed to evaluate whether intact proviral DNA levels predict time to HIV-1 rebound when ART is stopped and to evaluate the impact of novel interventions on intact proviral DNA levels in people on ART.
What are the implications of our work for HIV-1 cure research? The decline of intact proviral DNA over time implies that cells containing replication-competent proviruses are selectively being lost while defective proviruses remain stable during suppressive ART. Defining the mechanisms involved should inform strategies to accelerate HIV reservoir depletion. In addition, the more dynamic nature of the intact proviral landscape, compared with total proviral HIV DNA, supports the use of the IPDA to assess the impact of interventions targeting the HIV reservoir. Because the intact proviral DNA assay is more feasible to perform in clinical trials than the virus outgrowth assay, we anticipate it will have an important role in future HIV-1 cure research studies.
Supplementary Data
Supplementary materials are available at The Journal of Infectious Diseases online. Consisting of data provided by the authors to benefit the reader, the posted materials are not copyedited and are the sole responsibility of the authors, so questions or comments should be addressed to the corresponding author.
Notes
Acknowledgments. We would like to acknowledge all the members of the A5321 team, including Evelyn Hogg, Rebecca LeBlanc, Christine Scello, David Palm, Monica Gandhi, Courtney Fletcher, Anthony Podany, Fran Aweeka, Lou Halvas, Joan Dragavon, Jeymohan Joseph, Rose Lagattuta, Leyi Lin, Susan Pederson, Kevin Robertson, Leah Rubin, Davey Smith, Serena Spudich, and Athe Tsibris. We thank Dr Robert Siliciano for his invaluable contributions to this work. We appreciate the site staff who enrolled participants into the ACTG A5321 study and the participants who contributed so much to this study. We thank Delaney Taylor for all her help in preparing this manuscript.
Financial support. This work was supported by the National Institute of Allergy and Infectious Diseases (grant numbers UM1AI068636, UM1AI106701, UM1AI068634, and UM1AI069481); the National Institutes of Health Small Business Innovation Research Grant Program (grant numbers R43AI142866 and R44AI124996 to A. M. and G. L.); NIH Martin Delaney I4C (UM1 AI126603), Beat-HIV (UM1 AI126620) and DARE (UM1 AI126611) Collaboratories (JDS); and the National Science Foundation Small Business Innovation Research Grant Program (grant number 1738428 to A. M. and G. L.).
Potential conflicts of interest. R. T. G. has served on scientific advisory boards for Merck and Gilead. B. J. M. has received grants from Gilead. G. M. L. and A. M. are employees of and hold equity in Accelevir Diagnostics. J. D. S. has served on scientific advisory boards for Gilead and US Military HIV Research Program. J. W. M. has been a consultant to Gilead Sciences, AccelevirDx, and Merck, has received research grants from Gilead, and owns share options in Co-Crystal Pharmaceuticals and Abound Bio.
All other authors report no potential conflicts. All authors have submitted the ICMJE Form for Disclosure of Potential Conflicts of Interest. Conflicts that the editors consider relevant to the content of the manuscript have been disclosed.
Presented in part: HIV Persistence During Therapy: Reservoirs and Eradication Strategies Workshop, 10–13 December 2019, Miami, FL, Abstract O.P 5.6; and Conference on Retroviruses and Opportunistic Infections, 8–11 March 2020, Boston, MA, Abstract 75.
References

